Project
GSE43616: Time-course of wild-type Arabidopsis leaf
Navigation
Downloads
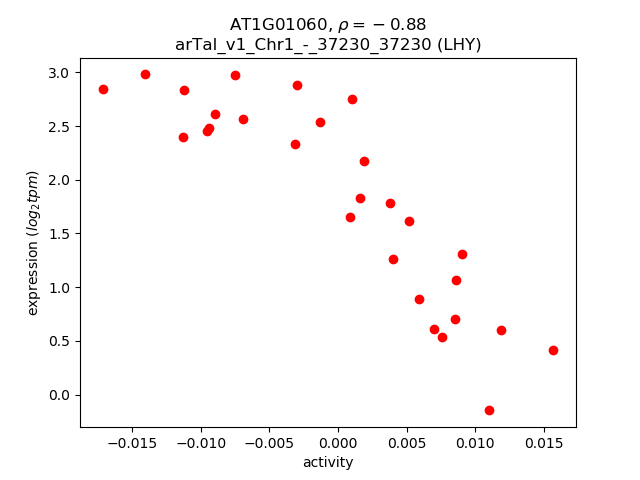
Results for AT1G01060
Z-value: 0.94
Transcription factors associated with AT1G01060
| Gene Symbol | Gene ID | Gene Info |
|---|---|---|
|
AT1G01060
|
AT1G01060 | Homeodomain-like superfamily protein |
Activity-expression correlation:
| Gene | Promoter | Pearson corr. coef. | P-value | Plot |
|---|---|---|---|---|
| LHY | arTal_v1_Chr1_-_37230_37230 | -0.88 | 8.0e-10 | Click! |
Activity profile of AT1G01060 motif
Sorted Z-values of AT1G01060 motif
| Promoter | Log-likelihood | Transcript | Gene | Gene Info |
|---|---|---|---|---|
| arTal_v1_Chr2_-_4312103_4312162 | 3.92 |
AT2G10940.2
AT2G10940.1 |
AT2G10940
|
Bifunctional inhibitor/lipid-transfer protein/seed storage 2S albumin superfamily protein |
| arTal_v1_Chr5_+_9072708_9072727 | 3.51 |
AT5G25980.2
AT5G25980.1 AT5G25980.3 |
TGG2
|
glucoside glucohydrolase 2 |
| arTal_v1_Chr5_-_19648362_19648362 | 3.11 |
AT5G48490.1
|
AT5G48490
|
Bifunctional inhibitor/lipid-transfer protein/seed storage 2S albumin superfamily protein |
| arTal_v1_Chr4_-_18098633_18098633 | 2.90 |
AT4G38770.1
|
PRP4
|
proline-rich protein 4 |
| arTal_v1_Chr5_-_9082384_9082384 | 2.86 |
AT5G26000.1
AT5G26000.2 |
TGG1
|
thioglucoside glucohydrolase 1 |
| arTal_v1_Chr1_-_20648891_20648891 | 2.55 |
AT1G55330.1
|
AGP21
|
arabinogalactan protein 21 |
| arTal_v1_Chr2_+_14524607_14524607 | 2.54 |
AT2G34430.1
|
LHB1B1
|
light-harvesting chlorophyll-protein complex II subunit B1 |
| arTal_v1_Chr3_-_21523375_21523518 | 2.49 |
AT3G58120.2
AT3G58120.1 |
BZIP61
|
Basic-leucine zipper (bZIP) transcription factor family protein |
| arTal_v1_Chr5_+_8863224_8863224 | 2.48 |
AT5G25460.1
|
DGR2
|
transmembrane protein, putative (Protein of unknown function, DUF642) |
| arTal_v1_Chr4_-_7493080_7493080 | 2.44 |
AT4G12730.1
|
FLA2
|
FASCICLIN-like arabinogalactan 2 |
| arTal_v1_Chr4_-_10391298_10391298 | 2.43 |
AT4G18970.1
|
AT4G18970
|
GDSL-like Lipase/Acylhydrolase superfamily protein |
| arTal_v1_Chr4_-_10390991_10390991 | 2.41 |
AT4G18970.2
|
AT4G18970
|
GDSL-like Lipase/Acylhydrolase superfamily protein |
| arTal_v1_Chr5_-_25343369_25343369 | 2.31 |
AT5G63180.1
|
AT5G63180
|
Pectin lyase-like superfamily protein |
| arTal_v1_Chr5_-_15378416_15378416 | 2.31 |
AT5G38410.3
AT5G38410.2 |
RBCS3B
|
Ribulose bisphosphate carboxylase (small chain) family protein |
| arTal_v1_Chr5_-_15378642_15378642 | 2.31 |
AT5G38410.1
|
RBCS3B
|
Ribulose bisphosphate carboxylase (small chain) family protein |
| arTal_v1_Chr3_-_11013451_11013451 | 2.28 |
AT3G29030.1
|
EXPA5
|
expansin A5 |
| arTal_v1_Chr3_-_4008018_4008018 | 2.21 |
AT3G12610.1
|
DRT100
|
Leucine-rich repeat (LRR) family protein |
| arTal_v1_Chr5_+_4087689_4087689 | 2.20 |
AT5G12940.1
|
AT5G12940
|
Leucine-rich repeat (LRR) family protein |
| arTal_v1_Chr5_-_6976036_6976036 | 2.20 |
AT5G20630.1
|
GER3
|
germin 3 |
| arTal_v1_Chr1_+_10371675_10371675 | 2.19 |
AT1G29660.1
|
AT1G29660
|
GDSL-like Lipase/Acylhydrolase superfamily protein |
| arTal_v1_Chr4_-_176870_176870 | 2.14 |
AT4G00400.1
|
GPAT8
|
glycerol-3-phosphate acyltransferase 8 |
| arTal_v1_Chr1_+_10375754_10375754 | 2.11 |
AT1G29670.1
|
AT1G29670
|
GDSL-like Lipase/Acylhydrolase superfamily protein |
| arTal_v1_Chr2_+_2763449_2763513 | 2.09 |
AT2G06850.1
AT2G06850.2 |
XTH4
|
xyloglucan endotransglucosylase/hydrolase 4 |
| arTal_v1_Chr1_+_10375599_10375599 | 2.09 |
AT1G29670.2
|
AT1G29670
|
GDSL-like Lipase/Acylhydrolase superfamily protein |
| arTal_v1_Chr1_+_28053030_28053030 | 2.02 |
AT1G74670.1
|
GASA6
|
Gibberellin-regulated family protein |
| arTal_v1_Chr4_+_12660687_12660687 | 2.01 |
AT4G24510.1
|
CER2
|
HXXXD-type acyl-transferase family protein |
| arTal_v1_Chr1_-_4090857_4090857 | 1.97 |
AT1G12090.1
|
ELP
|
extensin-like protein |
| arTal_v1_Chr2_-_9428170_9428170 | 1.95 |
AT2G22170.1
|
PLAT2
|
Lipase/lipooxygenase, PLAT/LH2 family protein |
| arTal_v1_Chr3_-_8589754_8589754 | 1.93 |
AT3G23810.1
|
SAHH2
|
S-adenosyl-l-homocysteine (SAH) hydrolase 2 |
| arTal_v1_Chr4_+_2449434_2449434 | 1.92 |
AT4G04840.1
|
MSRB6
|
methionine sulfoxide reductase B6 |
| arTal_v1_Chr3_-_5508414_5508414 | 1.90 |
AT3G16250.1
|
PnsB3
|
NDH-dependent cyclic electron flow 1 |
| arTal_v1_Chr5_-_14562863_14562863 | 1.90 |
AT5G36910.1
|
THI2.2
|
thionin 2.2 |
| arTal_v1_Chr4_-_12400231_12400231 | 1.90 |
AT4G23820.1
|
AT4G23820
|
Pectin lyase-like superfamily protein |
| arTal_v1_Chr1_+_9740508_9740508 | 1.89 |
AT1G27950.1
|
LTPG1
|
glycosylphosphatidylinositol-anchored lipid protein transfer 1 |
| arTal_v1_Chr3_-_977474_977474 | 1.87 |
AT3G03820.1
|
SAUR29
|
SAUR-like auxin-responsive protein family |
| arTal_v1_Chr2_-_9062093_9062093 | 1.86 |
AT2G21140.1
|
PRP2
|
proline-rich protein 2 |
| arTal_v1_Chr3_+_23345754_23345754 | 1.84 |
AT3G63200.1
|
PLP9
|
PATATIN-like protein 9 |
| arTal_v1_Chr3_-_7796310_7796460 | 1.84 |
AT3G22120.1
AT3G22120.2 |
CWLP
|
cell wall-plasma membrane linker protein |
| arTal_v1_Chr1_+_7252111_7252111 | 1.83 |
AT1G20850.1
|
XCP2
|
xylem cysteine peptidase 2 |
| arTal_v1_Chr1_+_25401514_25401514 | 1.83 |
AT1G67750.1
|
AT1G67750
|
Pectate lyase family protein |
| arTal_v1_Chr1_+_20614573_20614610 | 1.82 |
AT1G55260.1
AT1G55260.2 |
AT1G55260
|
Bifunctional inhibitor/lipid-transfer protein/seed storage 2S albumin superfamily protein |
| arTal_v1_Chr2_+_1676999_1676999 | 1.82 |
AT2G04780.2
|
FLA7
|
FASCICLIN-like arabinoogalactan 7 |
| arTal_v1_Chr3_+_18046144_18046144 | 1.82 |
AT3G48720.1
|
DCF
|
HXXXD-type acyl-transferase family protein |
| arTal_v1_Chr3_-_16448844_16448844 | 1.82 |
AT3G44990.1
|
XTH31
|
xyloglucan endo-transglycosylase-related 8 |
| arTal_v1_Chr5_+_17712203_17712203 | 1.81 |
AT5G44020.1
|
AT5G44020
|
HAD superfamily, subfamily IIIB acid phosphatase |
| arTal_v1_Chr1_-_6999839_6999839 | 1.79 |
AT1G20190.1
|
EXPA11
|
expansin 11 |
| arTal_v1_Chr5_-_4392227_4392227 | 1.79 |
AT5G13630.2
|
GUN5
|
magnesium-chelatase subunit chlH, chloroplast, putative / Mg-protoporphyrin IX chelatase, putative (CHLH) |
| arTal_v1_Chr5_-_4392429_4392429 | 1.79 |
AT5G13630.1
|
GUN5
|
magnesium-chelatase subunit chlH, chloroplast, putative / Mg-protoporphyrin IX chelatase, putative (CHLH) |
| arTal_v1_Chr1_+_418726_418767 | 1.79 |
AT1G02205.4
AT1G02205.3 AT1G02205.5 AT1G02205.1 |
CER1
|
Fatty acid hydroxylase superfamily |
| arTal_v1_Chr5_+_3644547_3644547 | 1.78 |
AT5G11420.1
|
AT5G11420
|
transmembrane protein, putative (Protein of unknown function, DUF642) |
| arTal_v1_Chr2_+_1676717_1676717 | 1.78 |
AT2G04780.1
|
FLA7
|
FASCICLIN-like arabinoogalactan 7 |
| arTal_v1_Chr2_-_15790139_15790139 | 1.76 |
AT2G37640.1
|
EXP3
|
Barwin-like endoglucanases superfamily protein |
| arTal_v1_Chr3_-_23334034_23334034 | 1.76 |
AT3G63160.1
|
OEP6
|
outer envelope membrane protein |
| arTal_v1_Chr2_-_15789605_15789605 | 1.76 |
AT2G37640.2
|
EXP3
|
Barwin-like endoglucanases superfamily protein |
| arTal_v1_Chr5_+_21020014_21020014 | 1.75 |
AT5G51750.1
|
SBT1.3
|
subtilase 1.3 |
| arTal_v1_Chr3_+_4956349_4956349 | 1.74 |
AT3G14760.1
|
AT3G14760
|
transmembrane protein |
| arTal_v1_Chr1_+_7886323_7886323 | 1.72 |
AT1G22330.1
|
AT1G22330
|
RNA-binding (RRM/RBD/RNP motifs) family protein |
| arTal_v1_Chr3_-_2334185_2334185 | 1.72 |
AT3G07320.1
|
AT3G07320
|
O-Glycosyl hydrolases family 17 protein |
| arTal_v1_Chr5_+_152446_152446 | 1.72 |
AT5G01370.1
|
ACI1
|
ALC-interacting protein 1 |
| arTal_v1_Chr4_+_14517393_14517393 | 1.71 |
AT4G29610.1
|
AT4G29610
|
Cytidine/deoxycytidylate deaminase family protein |
| arTal_v1_Chr1_+_17918207_17918207 | 1.71 |
AT1G48480.1
|
RKL1
|
receptor-like kinase 1 |
| arTal_v1_Chr2_-_12433796_12433796 | 1.70 |
AT2G28950.1
|
EXPA6
|
expansin A6 |
| arTal_v1_Chr3_-_15617149_15617149 | 1.69 |
AT3G43720.2
|
LTPG2
|
Bifunctional inhibitor/lipid-transfer protein/seed storage 2S albumin superfamily protein |
| arTal_v1_Chr1_-_84864_84946 | 1.69 |
AT1G01190.1
AT1G01190.2 |
CYP78A8
|
cytochrome P450, family 78, subfamily A, polypeptide 8 |
| arTal_v1_Chr5_-_2185972_2185972 | 1.69 |
AT5G07030.1
|
AT5G07030
|
Eukaryotic aspartyl protease family protein |
| arTal_v1_Chr1_-_464981_464981 | 1.69 |
AT1G02335.1
|
GL22
|
germin-like protein subfamily 2 member 2 precursor |
| arTal_v1_Chr3_-_15617309_15617309 | 1.67 |
AT3G43720.1
|
LTPG2
|
Bifunctional inhibitor/lipid-transfer protein/seed storage 2S albumin superfamily protein |
| arTal_v1_Chr5_+_4944816_4944816 | 1.67 |
AT5G15230.1
|
GASA4
|
GAST1 protein homolog 4 |
| arTal_v1_Chr2_-_8971339_8971339 | 1.67 |
AT2G20835.1
|
AT2G20835
|
hypothetical protein |
| arTal_v1_Chr5_+_1664040_1664062 | 1.66 |
AT5G05580.2
AT5G05580.1 |
FAD8
|
fatty acid desaturase 8 |
| arTal_v1_Chr5_-_671687_671687 | 1.66 |
AT5G02890.1
|
AT5G02890
|
HXXXD-type acyl-transferase family protein |
| arTal_v1_Chr4_+_620691_620697 | 1.66 |
AT4G01460.1
AT4G01460.2 |
AT4G01460
|
basic helix-loop-helix (bHLH) DNA-binding superfamily protein |
| arTal_v1_Chr1_-_6999523_6999523 | 1.65 |
AT1G20190.2
|
EXPA11
|
expansin 11 |
| arTal_v1_Chr1_+_20447157_20447208 | 1.65 |
AT1G54820.1
AT1G54820.2 AT1G54820.3 AT1G54820.4 |
AT1G54820
|
Protein kinase superfamily protein |
| arTal_v1_Chr5_+_7502427_7502427 | 1.64 |
AT5G22580.1
|
AT5G22580
|
Stress responsive A/B Barrel Domain-containing protein |
| arTal_v1_Chr1_-_2560432_2560432 | 1.64 |
AT1G08160.1
|
AT1G08160
|
Late embryogenesis abundant (LEA) hydroxyproline-rich glycoprotein family |
| arTal_v1_Chr5_+_21009347_21009347 | 1.63 |
AT5G51720.1
|
NEET
|
2 iron, 2 sulfur cluster binding protein |
| arTal_v1_Chr5_+_18528267_18528267 | 1.62 |
AT5G45670.1
|
AT5G45670
|
GDSL-like Lipase/Acylhydrolase superfamily protein |
| arTal_v1_Chr3_-_9492655_9492655 | 1.60 |
AT3G25920.1
|
RPL15
|
ribosomal protein L15 |
| arTal_v1_Chr5_-_18026077_18026077 | 1.60 |
AT5G44680.1
|
AT5G44680
|
DNA glycosylase superfamily protein |
| arTal_v1_Chr1_+_16575759_16575759 | 1.60 |
AT1G43790.1
|
TED6
|
tracheary element differentiation-related 6 |
| arTal_v1_Chr2_-_15137012_15137012 | 1.59 |
AT2G36050.1
|
OFP15
|
ovate family protein 15 |
| arTal_v1_Chr2_+_14427509_14427893 | 1.58 |
AT2G34170.3
AT2G34170.2 AT2G34170.1 AT2G34170.4 AT2G34170.5 AT2G34170.6 |
AT2G34170
|
hypothetical protein (DUF688) |
| arTal_v1_Chr3_-_19595834_19595834 | 1.58 |
AT3G52870.1
|
AT3G52870
|
IQ calmodulin-binding motif family protein |
| arTal_v1_Chr1_-_25049424_25049424 | 1.57 |
AT1G67090.2
|
RBCS1A
|
ribulose bisphosphate carboxylase small chain 1A |
| arTal_v1_Chr1_-_25049667_25049667 | 1.57 |
AT1G67090.1
|
RBCS1A
|
ribulose bisphosphate carboxylase small chain 1A |
| arTal_v1_Chr5_+_5078200_5078293 | 1.57 |
AT5G15600.1
AT5G15600.2 |
SP1L4
|
SPIRAL1-like4 |
| arTal_v1_Chr5_+_19825078_19825078 | 1.57 |
AT5G48900.1
|
AT5G48900
|
Pectin lyase-like superfamily protein |
| arTal_v1_Chr2_-_7496292_7496292 | 1.54 |
AT2G17230.1
|
EXL5
|
EXORDIUM like 5 |
| arTal_v1_Chr5_+_4945062_4945062 | 1.54 |
AT5G15230.2
|
GASA4
|
GAST1 protein homolog 4 |
| arTal_v1_Chr4_+_16397995_16397995 | 1.54 |
AT4G34260.1
|
FUC95A
|
1,2-alpha-L-fucosidase |
| arTal_v1_Chr4_-_16583075_16583075 | 1.53 |
AT4G34760.1
|
AT4G34760
|
SAUR-like auxin-responsive protein family |
| arTal_v1_Chr5_-_6842946_6842946 | 1.53 |
AT5G20270.1
|
HHP1
|
heptahelical transmembrane protein1 |
| arTal_v1_Chr5_+_1919080_1919179 | 1.52 |
AT5G06290.1
AT5G06290.2 |
2-Cys Prx B
|
2-cysteine peroxiredoxin B |
| arTal_v1_Chr4_+_13391293_13391344 | 1.52 |
AT4G26530.2
AT4G26530.1 |
FBA5
|
Aldolase superfamily protein |
| arTal_v1_Chr1_-_26711462_26711587 | 1.52 |
AT1G70830.4
AT1G70830.2 AT1G70830.1 AT1G70830.5 AT1G70830.3 |
MLP28
|
MLP-like protein 28 |
| arTal_v1_Chr5_+_2803833_2803957 | 1.52 |
AT5G08640.1
AT5G08640.2 |
FLS1
|
flavonol synthase 1 |
| arTal_v1_Chr2_+_1594588_1594588 | 1.51 |
AT2G04570.1
|
AT2G04570
|
GDSL-like Lipase/Acylhydrolase superfamily protein |
| arTal_v1_Chr1_-_22317070_22317070 | 1.51 |
AT1G60590.1
|
AT1G60590
|
Pectin lyase-like superfamily protein |
| arTal_v1_Chr1_-_7531108_7531108 | 1.51 |
AT1G21500.1
|
AT1G21500
|
hypothetical protein |
| arTal_v1_Chr3_+_17228642_17228642 | 1.50 |
AT3G46780.1
|
PTAC16
|
plastid transcriptionally active 16 |
| arTal_v1_Chr4_+_13390754_13390754 | 1.50 |
AT4G26530.3
|
FBA5
|
Aldolase superfamily protein |
| arTal_v1_Chr1_+_11343854_11343854 | 1.50 |
AT1G31690.1
|
AT1G31690
|
Copper amine oxidase family protein |
| arTal_v1_Chr3_+_19845097_19845172 | 1.50 |
AT3G53530.2
AT3G53530.1 |
NAKR3
|
Chloroplast-targeted copper chaperone protein |
| arTal_v1_Chr1_-_15607966_15607966 | 1.49 |
AT1G41830.1
|
SKS6
|
SKU5-similar 6 |
| arTal_v1_Chr3_-_5252697_5252792 | 1.48 |
AT3G15520.1
AT3G15520.2 AT3G15520.3 |
AT3G15520
|
Cyclophilin-like peptidyl-prolyl cis-trans isomerase family protein |
| arTal_v1_Chr3_-_373805_373805 | 1.48 |
AT3G02110.1
|
scpl25
|
serine carboxypeptidase-like 25 |
| arTal_v1_Chr4_+_6100714_6100714 | 1.47 |
AT4G09650.1
|
ATPD
|
F-type H+-transporting ATPase subunit delta |
| arTal_v1_Chr4_-_12772438_12772479 | 1.47 |
AT4G24780.1
AT4G24780.2 |
AT4G24780
|
Pectin lyase-like superfamily protein |
| arTal_v1_Chr3_+_5358601_5358601 | 1.47 |
AT3G15850.1
|
FAD5
|
fatty acid desaturase 5 |
| arTal_v1_Chr4_-_18067873_18067873 | 1.46 |
AT4G38660.2
|
AT4G38660
|
Pathogenesis-related thaumatin superfamily protein |
| arTal_v1_Chr3_+_5314817_5314817 | 1.46 |
AT3G15680.1
AT3G15680.2 |
AT3G15680
|
Ran BP2/NZF zinc finger-like superfamily protein |
| arTal_v1_Chr3_-_4744263_4744263 | 1.46 |
AT3G14240.1
|
AT3G14240
|
Subtilase family protein |
| arTal_v1_Chr4_+_12390167_12390167 | 1.44 |
AT4G23800.1
AT4G23800.2 |
3xHMG-box2
|
HMG (high mobility group) box protein |
| arTal_v1_Chr4_-_18068293_18068293 | 1.44 |
AT4G38660.1
|
AT4G38660
|
Pathogenesis-related thaumatin superfamily protein |
| arTal_v1_Chr1_-_11548016_11548016 | 1.44 |
AT1G32100.1
|
PRR1
|
pinoresinol reductase 1 |
| arTal_v1_Chr1_-_1940463_1940496 | 1.43 |
AT1G06360.1
AT1G06360.2 |
AT1G06360
|
Fatty acid desaturase family protein |
| arTal_v1_Chr2_+_19145218_19145218 | 1.43 |
AT2G46630.1
|
AT2G46630
|
serine/arginine repetitive matrix protein |
| arTal_v1_Chr3_-_6882235_6882315 | 1.42 |
AT3G19820.3
AT3G19820.1 AT3G19820.2 |
DWF1
|
cell elongation protein / DWARF1 / DIMINUTO (DIM) |
| arTal_v1_Chr3_-_20576249_20576249 | 1.41 |
AT3G55500.1
|
EXPA16
|
expansin A16 |
| arTal_v1_Chr3_-_2216483_2216483 | 1.41 |
AT3G07010.1
AT3G07010.2 |
AT3G07010
|
Pectin lyase-like superfamily protein |
| arTal_v1_Chr5_-_24990331_24990331 | 1.41 |
AT5G62220.1
|
GT18
|
glycosyltransferase 18 |
| arTal_v1_Chr2_-_11717432_11717437 | 1.40 |
AT2G27385.3
AT2G27385.2 AT2G27385.1 |
AT2G27385
|
Pollen Ole e 1 allergen and extensin family protein |
| arTal_v1_Chr1_+_3530353_3530451 | 1.40 |
AT1G10657.4
AT1G10657.2 AT1G10657.3 AT1G10657.1 |
AT1G10657
|
transmembrane protein |
| arTal_v1_Chr1_+_10323636_10323636 | 1.39 |
AT1G29520.1
|
AT1G29520
|
AWPM-19-like family protein |
| arTal_v1_Chr1_+_26141726_26141836 | 1.39 |
AT1G69530.2
AT1G69530.1 AT1G69530.3 AT1G69530.5 AT1G69530.4 |
EXPA1
|
expansin A1 |
| arTal_v1_Chr2_+_16476198_16476216 | 1.38 |
AT2G39470.1
AT2G39470.2 AT2G39470.3 |
PnsL1
|
PsbP-like protein 2 |
| arTal_v1_Chr1_+_4868346_4868346 | 1.38 |
AT1G14250.1
|
AT1G14250
|
GDA1/CD39 nucleoside phosphatase family protein |
| arTal_v1_Chr5_+_18945543_18945543 | 1.38 |
AT5G46690.2
AT5G46690.1 |
bHLH071
|
beta HLH protein 71 |
| arTal_v1_Chr1_-_4530222_4530222 | 1.38 |
AT1G13250.1
|
GATL3
|
galacturonosyltransferase-like 3 |
| arTal_v1_Chr2_-_12785037_12785037 | 1.36 |
AT2G29980.2
|
FAD3
|
fatty acid desaturase 3 |
| arTal_v1_Chr1_-_8183570_8183650 | 1.36 |
AT1G23080.2
AT1G23080.3 AT1G23080.4 AT1G23080.1 |
PIN7
|
Auxin efflux carrier family protein |
| arTal_v1_Chr2_-_12785190_12785190 | 1.35 |
AT2G29980.1
|
FAD3
|
fatty acid desaturase 3 |
| arTal_v1_Chr1_-_20719165_20719261 | 1.35 |
AT1G55490.1
AT1G55490.2 AT1G55490.4 AT1G55490.3 AT1G55490.5 |
CPN60B
|
chaperonin 60 beta |
| arTal_v1_Chr1_+_5058583_5058680 | 1.34 |
AT1G14700.4
AT1G14700.1 AT1G14700.3 AT1G14700.2 |
PAP3
|
purple acid phosphatase 3 |
| arTal_v1_Chr5_-_20712386_20712473 | 1.34 |
AT5G50915.4
AT5G50915.2 AT5G50915.1 AT5G50915.3 |
AT5G50915
|
basic helix-loop-helix (bHLH) DNA-binding superfamily protein |
| arTal_v1_Chr1_-_18405493_18405681 | 1.34 |
AT1G49730.3
AT1G49730.4 AT1G49730.2 AT1G49730.5 AT1G49730.1 |
AT1G49730
|
Protein kinase superfamily protein |
| arTal_v1_Chr1_-_28423520_28423520 | 1.33 |
AT1G75690.1
|
LQY1
|
DnaJ/Hsp40 cysteine-rich domain superfamily protein |
| arTal_v1_Chr1_+_10149791_10149791 | 1.33 |
AT1G29070.1
|
AT1G29070
|
Ribosomal protein L34 |
| arTal_v1_Chr1_+_12026936_12026936 | 1.33 |
AT1G33170.1
|
AT1G33170
|
S-adenosyl-L-methionine-dependent methyltransferases superfamily protein |
| arTal_v1_Chr2_+_6399621_6399621 | 1.33 |
AT2G14890.2
|
AGP9
|
arabinogalactan protein 9 |
| arTal_v1_Chr3_-_19467455_19467455 | 1.32 |
AT3G52500.1
|
AT3G52500
|
Eukaryotic aspartyl protease family protein |
| arTal_v1_Chr2_-_12173951_12173991 | 1.32 |
AT2G28470.2
AT2G28470.4 AT2G28470.1 AT2G28470.3 |
BGAL8
|
beta-galactosidase 8 |
| arTal_v1_Chr1_+_418416_418416 | 1.31 |
AT1G02205.2
|
CER1
|
Fatty acid hydroxylase superfamily |
| arTal_v1_Chr1_+_1231452_1231452 | 1.31 |
AT1G04520.1
|
PDLP2
|
plasmodesmata-located protein 2 |
| arTal_v1_Chr3_+_3698658_3698658 | 1.31 |
AT3G11700.1
|
FLA18
|
FASCICLIN-like arabinogalactan protein 18 precursor |
| arTal_v1_Chr4_-_846792_846814 | 1.31 |
AT4G01950.1
AT4G01950.2 |
GPAT3
|
glycerol-3-phosphate acyltransferase 3 |
| arTal_v1_Chr1_-_21626402_21626402 | 1.31 |
AT1G58290.1
|
HEMA1
|
Glutamyl-tRNA reductase family protein |
| arTal_v1_Chr3_+_17949416_17949416 | 1.31 |
AT3G48460.1
|
AT3G48460
|
GDSL-like Lipase/Acylhydrolase superfamily protein |
| arTal_v1_Chr5_-_18371021_18371021 | 1.31 |
AT5G45340.2
AT5G45340.1 |
CYP707A3
|
cytochrome P450, family 707, subfamily A, polypeptide 3 |
| arTal_v1_Chr3_+_18049571_18049571 | 1.31 |
AT3G48730.1
|
GSA2
|
glutamate-1-semialdehyde 2,1-aminomutase 2 |
| arTal_v1_Chr2_+_9636346_9636492 | 1.31 |
AT2G22670.1
AT2G22670.4 AT2G22670.2 AT2G22670.5 AT2G22670.3 |
IAA8
|
indoleacetic acid-induced protein 8 |
| arTal_v1_Chr5_-_3278461_3278461 | 1.31 |
AT5G10430.1
|
AGP4
|
arabinogalactan protein 4 |
| arTal_v1_Chr1_-_6319427_6319427 | 1.31 |
AT1G18360.1
|
AT1G18360
|
alpha/beta-Hydrolases superfamily protein |
| arTal_v1_Chr1_+_3008910_3008910 | 1.30 |
AT1G09310.1
|
AT1G09310
|
plant/protein (Protein of unknown function, DUF538) |
| arTal_v1_Chr4_+_8931617_8931617 | 1.29 |
AT4G15680.1
|
AT4G15680
|
Thioredoxin superfamily protein |
| arTal_v1_Chr2_+_15934244_15934244 | 1.29 |
AT2G38080.1
|
IRX12
|
Laccase/Diphenol oxidase family protein |
| arTal_v1_Chr2_-_14125526_14125526 | 1.29 |
AT2G33330.1
|
PDLP3
|
plasmodesmata-located protein 3 |
| arTal_v1_Chr4_-_7857933_7857933 | 1.28 |
AT4G13500.1
|
AT4G13500
|
transmembrane protein |
| arTal_v1_Chr3_+_19613078_19613078 | 1.28 |
AT3G52900.1
|
AT3G52900
|
RAB6-interacting golgin (DUF662) |
| arTal_v1_Chr1_-_5858446_5858550 | 1.28 |
AT1G17140.1
AT1G17140.2 |
ICR1
|
interactor of constitutive active rops 1 |
| arTal_v1_Chr1_+_28428671_28428671 | 1.28 |
AT1G75710.1
|
AT1G75710
|
C2H2-like zinc finger protein |
| arTal_v1_Chr5_-_8707885_8707885 | 1.28 |
AT5G25190.1
|
ESE3
|
Integrase-type DNA-binding superfamily protein |
| arTal_v1_Chr2_-_18914739_18914739 | 1.27 |
AT2G45970.1
|
CYP86A8
|
cytochrome P450, family 86, subfamily A, polypeptide 8 |
| arTal_v1_Chr5_-_5072492_5072492 | 1.27 |
AT5G15580.1
|
LNG1
|
longifolia1 |
| arTal_v1_Chr4_-_15059846_15059846 | 1.27 |
AT4G30950.1
|
FAD6
|
fatty acid desaturase 6 |
| arTal_v1_Chr5_+_17937622_17937622 | 1.27 |
AT5G44530.3
AT5G44530.2 AT5G44530.1 |
AT5G44530
|
Subtilase family protein |
| arTal_v1_Chr4_+_13133402_13133402 | 1.27 |
AT4G25830.1
|
AT4G25830
|
Uncharacterized protein family (UPF0497) |
| arTal_v1_Chr2_+_17854557_17854557 | 1.27 |
AT2G42900.1
|
AT2G42900
|
Plant basic secretory protein (BSP) family protein |
| arTal_v1_Chr4_+_11907355_11907355 | 1.27 |
AT4G22620.1
|
AT4G22620
|
SAUR-like auxin-responsive protein family |
| arTal_v1_Chr1_-_26515188_26515255 | 1.27 |
AT1G70370.2
AT1G70370.1 |
PG2
|
polygalacturonase 2 |
| arTal_v1_Chr4_+_15819489_15819489 | 1.26 |
AT4G32800.1
|
AT4G32800
|
Integrase-type DNA-binding superfamily protein |
| arTal_v1_Chr3_-_6980523_6980523 | 1.26 |
AT3G20015.1
|
AT3G20015
|
Eukaryotic aspartyl protease family protein |
| arTal_v1_Chr3_+_8586359_8586359 | 1.26 |
AT3G23805.1
|
RALFL24
|
ralf-like 24 |
| arTal_v1_Chr5_+_834859_834859 | 1.26 |
AT5G03390.1
|
AT5G03390
|
hypothetical protein (DUF295) |
| arTal_v1_Chr2_+_6399405_6399405 | 1.25 |
AT2G14890.1
|
AGP9
|
arabinogalactan protein 9 |
| arTal_v1_Chr5_+_2680401_2680401 | 1.25 |
AT5G08330.1
|
TCP11
|
TCP family transcription factor |
| arTal_v1_Chr5_-_17581275_17581275 | 1.25 |
AT5G43750.1
|
PnsB5
|
NAD(P)H dehydrogenase 18 |
| arTal_v1_Chr4_+_13725546_13725546 | 1.25 |
AT4G27440.2
AT4G27440.1 |
PORB
|
protochlorophyllide oxidoreductase B |
| arTal_v1_Chr3_-_18628888_18628914 | 1.25 |
AT3G50240.3
AT3G50240.2 AT3G50240.4 AT3G50240.1 |
KICP-02
|
ATP binding microtubule motor family protein |
| arTal_v1_Chr2_+_19191247_19191247 | 1.24 |
AT2G46710.1
|
ROPGAP3
|
Rho GTPase activating protein with PAK-box/P21-Rho-binding domain-containing protein |
| arTal_v1_Chr3_+_2564153_2564153 | 1.24 |
AT3G08030.2
|
AT3G08030
|
DNA-directed RNA polymerase subunit beta (Protein of unknown function, DUF642) |
| arTal_v1_Chr5_+_1952505_1952505 | 1.24 |
AT5G06390.1
|
FLA17
|
FASCICLIN-like arabinogalactan protein 17 precursor |
| arTal_v1_Chr1_+_23144385_23144385 | 1.24 |
AT1G62520.1
|
AT1G62520
|
sulfated surface-like glycoprotein |
| arTal_v1_Chr1_-_8559066_8559066 | 1.24 |
AT1G24170.1
|
LGT9
|
Nucleotide-diphospho-sugar transferases superfamily protein |
| arTal_v1_Chr3_+_2563803_2563803 | 1.24 |
AT3G08030.1
|
AT3G08030
|
DNA-directed RNA polymerase subunit beta (Protein of unknown function, DUF642) |
| arTal_v1_Chr2_+_13940187_13940187 | 1.23 |
AT2G32860.2
AT2G32860.1 |
BGLU33
|
beta glucosidase 33 |
| arTal_v1_Chr5_-_23576084_23576084 | 1.23 |
AT5G58310.1
|
MES18
|
methyl esterase 18 |
| arTal_v1_Chr2_+_15445294_15445294 | 1.23 |
AT2G36830.1
|
GAMMA-TIP
|
gamma tonoplast intrinsic protein |
| arTal_v1_Chr1_-_28581315_28581315 | 1.23 |
AT1G76160.1
|
sks5
|
SKU5 similar 5 |
| arTal_v1_Chr3_+_1727151_1727151 | 1.22 |
AT3G05800.1
|
AIF1
|
AtBS1(activation-tagged BRI1 suppressor 1)-interacting factor 1 |
| arTal_v1_Chr1_+_3015237_3015241 | 1.22 |
AT1G09340.2
AT1G09340.1 |
CRB
|
chloroplast RNA binding protein |
| arTal_v1_Chr4_+_14017343_14017343 | 1.22 |
AT4G28310.1
|
AT4G28310
|
microtubule-associated protein |
| arTal_v1_Chr1_-_30113489_30113489 | 1.22 |
AT1G80050.2
|
APT2
|
adenine phosphoribosyl transferase 2 |
| arTal_v1_Chr5_-_2993213_2993213 | 1.21 |
AT5G09650.1
|
PPa6
|
pyrophosphorylase 6 |
| arTal_v1_Chr4_+_15185775_15185775 | 1.21 |
AT4G31290.1
|
AT4G31290
|
ChaC-like family protein |
| arTal_v1_Chr5_-_21068327_21068327 | 1.21 |
AT5G51820.1
|
PGM
|
phosphoglucomutase |
| arTal_v1_Chr2_+_1033598_1033598 | 1.20 |
AT2G03410.1
|
AT2G03410
|
Mo25 family protein |
| arTal_v1_Chr5_-_26555781_26555886 | 1.20 |
AT5G66530.1
AT5G66530.2 AT5G66530.3 |
AT5G66530
|
Galactose mutarotase-like superfamily protein |
| arTal_v1_Chr1_+_7696427_7696427 | 1.19 |
AT1G21910.1
|
DREB26
|
Integrase-type DNA-binding superfamily protein |
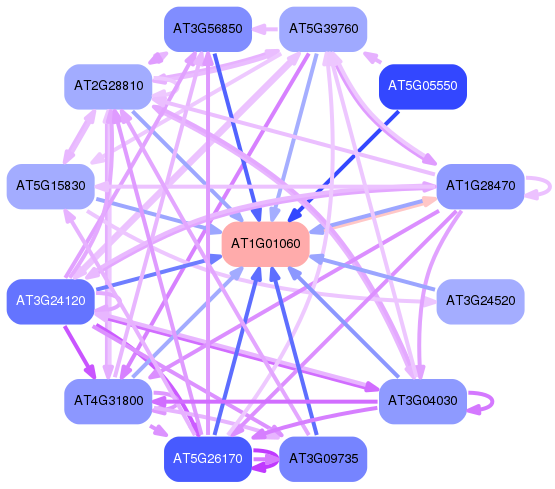
Network of associatons between targets according to the STRING database.
