Project
GSE130291:vernalization in Arabidopsis thaliana
Navigation
Downloads
Results for AT5G25190
Z-value: 0.63
Transcription factors associated with AT5G25190
| Gene Symbol | Gene ID | Gene Info |
|---|---|---|
|
AT5G25190
|
AT5G25190 | Integrase-type DNA-binding superfamily protein |
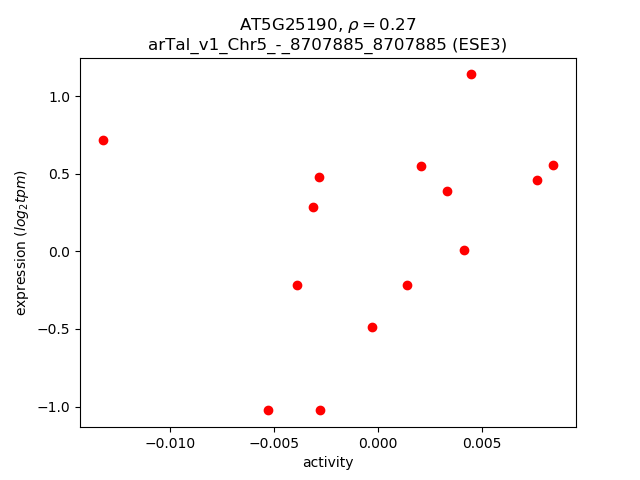
Activity-expression correlation:
| Gene | Promoter | Pearson corr. coef. | P-value | Plot |
|---|---|---|---|---|
| ESE3 | arTal_v1_Chr5_-_8707885_8707885 | 0.27 | 3.5e-01 | Click! |
Activity profile of AT5G25190 motif
Sorted Z-values of AT5G25190 motif
| Promoter | Log-likelihood | Transcript | Gene | Gene Info |
|---|---|---|---|---|
| arTal_v1_Chr4_+_12686459_12686459 | 0.57 |
AT4G24570.1
|
DIC2
|
dicarboxylate carrier 2 |
| arTal_v1_Chr1_-_9956960_9956980 | 0.55 |
AT1G28370.1
AT1G28370.2 |
ERF11
|
ERF domain protein 11 |
| arTal_v1_Chr1_+_6697874_6697874 | 0.54 |
AT1G19380.1
|
AT1G19380
|
sugar, putative (DUF1195) |
| arTal_v1_Chr4_-_17606924_17607050 | 0.43 |
AT4G37450.1
AT4G37450.2 |
AGP18
|
arabinogalactan protein 18 |
| arTal_v1_Chr2_+_18495215_18495215 | 0.43 |
AT2G44840.1
|
ERF13
|
ethylene-responsive element binding factor 13 |
| arTal_v1_Chr4_-_16644928_16644928 | 0.42 |
AT4G34950.1
|
AT4G34950
|
Major facilitator superfamily protein |
| arTal_v1_Chr2_-_8850111_8850111 | 0.40 |
AT2G20560.1
|
AT2G20560
|
DNAJ heat shock family protein |
| arTal_v1_Chr5_+_733887_733887 | 0.40 |
AT5G03120.1
AT5G03120.2 |
AT5G03120
|
transmembrane protein |
| arTal_v1_Chr2_+_11566288_11566288 | 0.40 |
AT2G27080.1
|
AT2G27080
|
Late embryogenesis abundant (LEA) hydroxyproline-rich glycoprotein family |
| arTal_v1_Chr4_+_12137995_12138137 | 0.39 |
AT4G23180.1
AT4G23180.3 AT4G23180.2 |
CRK10
|
cysteine-rich RLK (RECEPTOR-like protein kinase) 10 |
| arTal_v1_Chr4_-_1046993_1047105 | 0.38 |
AT4G02380.2
AT4G02380.1 AT4G02380.3 |
SAG21
|
senescence-associated gene 21 |
| arTal_v1_Chr4_+_14579563_14579563 | 0.38 |
AT4G29780.1
|
AT4G29780
|
nuclease |
| arTal_v1_Chr4_-_12393982_12393982 | 0.37 |
AT4G23810.1
|
WRKY53
|
WRKY family transcription factor |
| arTal_v1_Chr3_-_5445329_5445329 | 0.37 |
AT3G16050.1
|
PDX1.2
|
pyridoxine biosynthesis 1.2 |
| arTal_v1_Chr5_+_23187840_23187840 | 0.36 |
AT5G57220.1
|
CYP81F2
|
cytochrome P450, family 81, subfamily F, polypeptide 2 |
| arTal_v1_Chr2_-_9564850_9564850 | 0.35 |
AT2G22500.1
|
UCP5
|
uncoupling protein 5 |
| arTal_v1_Chr1_+_29502506_29502582 | 0.35 |
AT1G78410.1
AT1G78410.2 |
AT1G78410
|
VQ motif-containing protein |
| arTal_v1_Chr4_+_14304921_14304921 | 0.35 |
AT4G29020.2
AT4G29020.1 |
AT4G29020
|
glycine-rich protein |
| arTal_v1_Chr4_+_18519599_18519599 | 0.34 |
AT4G39940.1
|
AKN2
|
APS-kinase 2 |
| arTal_v1_Chr3_+_23201032_23201033 | 0.34 |
AT3G62720.2
AT3G62720.1 |
XT1
|
xylosyltransferase 1 |
| arTal_v1_Chr1_+_6568002_6568002 | 0.33 |
AT1G19020.1
|
AT1G19020
|
CDP-diacylglycerol-glycerol-3-phosphate 3-phosphatidyltransferase |
| arTal_v1_Chr5_+_5718498_5718498 | 0.33 |
AT5G17350.1
|
AT5G17350
|
hypothetical protein |
| arTal_v1_Chr5_-_18371021_18371021 | 0.33 |
AT5G45340.2
AT5G45340.1 |
CYP707A3
|
cytochrome P450, family 707, subfamily A, polypeptide 3 |
| arTal_v1_Chr1_-_2190784_2190784 | 0.33 |
AT1G07135.1
|
AT1G07135
|
glycine-rich protein |
| arTal_v1_Chr1_-_9649323_9649323 | 0.32 |
AT1G27730.1
|
STZ
|
salt tolerance zinc finger |
| arTal_v1_Chr4_-_12143833_12143858 | 0.32 |
AT4G23190.1
AT4G23190.2 AT4G23190.3 |
CRK11
|
cysteine-rich RLK (RECEPTOR-like protein kinase) 11 |
| arTal_v1_Chr4_-_14841067_14841147 | 0.32 |
AT4G30340.2
AT4G30340.1 |
DGK7
|
diacylglycerol kinase 7 |
| arTal_v1_Chr3_+_18733021_18733042 | 0.32 |
AT3G50480.2
AT3G50480.1 |
HR4
|
homolog of RPW8 4 |
| arTal_v1_Chr1_+_4934120_4934120 | 0.31 |
AT1G14430.1
|
AT1G14430
|
glyoxal oxidase-related protein |
| arTal_v1_Chr5_-_763322_763322 | 0.31 |
AT5G03210.1
|
DIP2
|
E3 ubiquitin-protein ligase |
| arTal_v1_Chr4_+_1032350_1032350 | 0.31 |
AT4G02330.1
|
ATPMEPCRB
|
Plant invertase/pectin methylesterase inhibitor superfamily |
| arTal_v1_Chr4_-_15275404_15275404 | 0.31 |
AT4G31500.1
|
CYP83B1
|
cytochrome P450, family 83, subfamily B, polypeptide 1 |
| arTal_v1_Chr5_-_2622900_2622900 | 0.31 |
AT5G08150.1
|
SOB5
|
suppressor of phytochrome b 5 |
| arTal_v1_Chr2_+_13676389_13676488 | 0.31 |
AT2G32200.2
AT2G32200.1 |
AT2G32200
|
cysteine-rich/transmembrane domain A-like protein |
| arTal_v1_Chr2_-_7496292_7496292 | 0.31 |
AT2G17230.1
|
EXL5
|
EXORDIUM like 5 |
| arTal_v1_Chr2_-_17992047_17992047 | 0.30 |
AT2G43290.1
|
MSS3
|
Calcium-binding EF-hand family protein |
| arTal_v1_Chr4_+_160643_160643 | 0.30 |
AT4G00360.1
|
CYP86A2
|
cytochrome P450, family 86, subfamily A, polypeptide 2 |
| arTal_v1_Chr2_+_11563933_11563933 | 0.30 |
AT2G27080.2
|
AT2G27080
|
Late embryogenesis abundant (LEA) hydroxyproline-rich glycoprotein family |
| arTal_v1_Chr4_-_9754161_9754161 | 0.30 |
AT4G17490.1
|
ERF6
|
ethylene responsive element binding factor 6 |
| arTal_v1_Chr4_+_6374734_6374734 | 0.29 |
AT4G10270.1
|
AT4G10270
|
Wound-responsive family protein |
| arTal_v1_Chr5_-_37999_37999 | 0.29 |
AT5G01100.1
|
FRB1
|
O-fucosyltransferase family protein |
| arTal_v1_Chr1_+_24637196_24637196 | 0.29 |
AT1G66160.2
AT1G66160.1 |
CMPG1
|
CYS, MET, PRO, and GLY protein 1 |
| arTal_v1_Chr2_+_13677986_13677986 | 0.29 |
AT2G32210.3
AT2G32210.2 AT2G32210.1 |
AT2G32210
|
cysteine-rich/transmembrane domain A-like protein |
| arTal_v1_Chr2_+_13674255_13674398 | 0.29 |
AT2G32190.2
AT2G32190.1 |
AT2G32190
|
cysteine-rich/transmembrane domain A-like protein |
| arTal_v1_Chr3_-_17008528_17008528 | 0.29 |
AT3G46280.1
|
AT3G46280
|
kinase-like protein |
| arTal_v1_Chr3_+_10505711_10505711 | 0.29 |
AT3G28180.1
|
CSLC04
|
Cellulose-synthase-like C4 |
| arTal_v1_Chr4_+_7758275_7758275 | 0.28 |
AT4G13340.1
|
LRX3
|
Leucine-rich repeat (LRR) family protein |
| arTal_v1_Chr2_-_9839824_9839824 | 0.28 |
AT2G23100.1
|
AT2G23100
|
Cysteine/Histidine-rich C1 domain family protein |
| arTal_v1_Chr1_+_116784_116784 | 0.28 |
AT1G01300.1
|
AT1G01300
|
Eukaryotic aspartyl protease family protein |
| arTal_v1_Chr5_-_4743512_4743539 | 0.28 |
AT5G14700.2
AT5G14700.1 |
AT5G14700
|
NAD(P)-binding Rossmann-fold superfamily protein |
| arTal_v1_Chr5_+_9683988_9683988 | 0.28 |
AT5G27420.1
|
CNI1
|
carbon/nitrogen insensitive 1 |
| arTal_v1_Chr1_+_23131928_23131928 | 0.27 |
AT1G62500.1
|
AT1G62500
|
Bifunctional inhibitor/lipid-transfer protein/seed storage 2S albumin superfamily protein |
| arTal_v1_Chr1_+_27054030_27054030 | 0.27 |
AT1G71880.1
|
SUC1
|
sucrose-proton symporter 1 |
| arTal_v1_Chr3_+_10517977_10517977 | 0.27 |
AT3G28200.1
|
AT3G28200
|
Peroxidase superfamily protein |
| arTal_v1_Chr5_-_16236_16236 | 0.27 |
AT5G01040.1
|
LAC8
|
laccase 8 |
| arTal_v1_Chr5_-_25843555_25843555 | 0.27 |
AT5G64660.1
|
CMPG2
|
CYS, MET, PRO, and GLY protein 2 |
| arTal_v1_Chr2_+_9488413_9488542 | 0.27 |
AT2G22330.2
AT2G22330.1 |
CYP79B3
|
cytochrome P450, family 79, subfamily B, polypeptide 3 |
| arTal_v1_Chr3_+_16569051_16569051 | 0.27 |
AT3G45230.1
|
AT3G45230
|
hydroxyproline-rich glycoprotein family protein |
| arTal_v1_Chr2_-_15137012_15137012 | 0.27 |
AT2G36050.1
|
OFP15
|
ovate family protein 15 |
| arTal_v1_Chr4_+_7042354_7042354 | 0.26 |
AT4G11660.1
|
AT-HSFB2B
|
winged-helix DNA-binding transcription factor family protein |
| arTal_v1_Chr2_-_16235234_16235367 | 0.26 |
AT2G38860.3
AT2G38860.1 AT2G38860.2 |
YLS5
|
Class I glutamine amidotransferase-like superfamily protein |
| arTal_v1_Chr4_+_13133402_13133402 | 0.26 |
AT4G25830.1
|
AT4G25830
|
Uncharacterized protein family (UPF0497) |
| arTal_v1_Chr1_-_2152541_2152541 | 0.26 |
AT1G07000.1
|
EXO70B2
|
exocyst subunit exo70 family protein B2 |
| arTal_v1_Chr1_-_26327965_26327965 | 0.25 |
AT1G69900.1
|
AT1G69900
|
Actin cross-linking protein |
| arTal_v1_Chr1_-_23460884_23460884 | 0.25 |
AT1G63245.1
|
CLE14
|
CLAVATA3/ESR-RELATED 14 |
| arTal_v1_Chr2_+_9844134_9844230 | 0.25 |
AT2G23130.1
AT2G23130.2 |
AGP17
|
arabinogalactan protein 17 |
| arTal_v1_Chr1_+_10371675_10371675 | 0.25 |
AT1G29660.1
|
AT1G29660
|
GDSL-like Lipase/Acylhydrolase superfamily protein |
| arTal_v1_Chr3_+_5692607_5692607 | 0.25 |
AT3G16720.1
|
ATL2
|
TOXICOS EN LEVADURA 2 |
| arTal_v1_Chr5_+_4826141_4826177 | 0.25 |
AT5G14920.1
AT5G14920.2 |
AT5G14920
|
Gibberellin-regulated family protein |
| arTal_v1_Chr5_-_763480_763480 | 0.24 |
AT5G03210.2
|
DIP2
|
E3 ubiquitin-protein ligase |
| arTal_v1_Chr3_+_21059785_21059785 | 0.24 |
AT3G56880.1
|
AT3G56880
|
VQ motif-containing protein |
| arTal_v1_Chr3_-_6430517_6430517 | 0.24 |
AT3G18690.1
|
MKS1
|
MAP kinase substrate 1 |
| arTal_v1_Chr3_+_1727151_1727151 | 0.24 |
AT3G05800.1
|
AIF1
|
AtBS1(activation-tagged BRI1 suppressor 1)-interacting factor 1 |
| arTal_v1_Chr3_+_3698658_3698658 | 0.24 |
AT3G11700.1
|
FLA18
|
FASCICLIN-like arabinogalactan protein 18 precursor |
| arTal_v1_Chr1_-_8189220_8189234 | 0.24 |
AT1G23090.4
AT1G23090.1 AT1G23090.3 AT1G23090.2 |
AST91
|
sulfate transporter 91 |
| arTal_v1_Chr4_-_12143476_12143476 | 0.24 |
AT4G23190.4
|
CRK11
|
cysteine-rich RLK (RECEPTOR-like protein kinase) 11 |
| arTal_v1_Chr5_+_2680401_2680401 | 0.23 |
AT5G08330.1
|
TCP11
|
TCP family transcription factor |
| arTal_v1_Chr5_+_25016860_25016860 | 0.23 |
AT5G62280.1
|
AT5G62280
|
DUF1442 family protein (DUF1442) |
| arTal_v1_Chr2_-_17002528_17002528 | 0.23 |
AT2G40750.1
|
WRKY54
|
WRKY DNA-binding protein 54 |
| arTal_v1_Chr4_-_14439723_14439769 | 0.23 |
AT4G29310.1
AT4G29310.2 |
AT4G29310
|
DUF1005 family protein (DUF1005) |
| arTal_v1_Chr2_-_13864596_13864710 | 0.23 |
AT2G32690.2
AT2G32690.3 AT2G32690.5 AT2G32690.4 AT2G32690.1 |
GRP23
|
glycine-rich protein 23 |
| arTal_v1_Chr3_-_5254458_5254562 | 0.23 |
AT3G15530.2
AT3G15530.1 |
AT3G15530
|
S-adenosyl-L-methionine-dependent methyltransferases superfamily protein |
| arTal_v1_Chr4_+_14847583_14847583 | 0.23 |
AT4G30350.1
|
AT4G30350
|
Double Clp-N motif-containing P-loop nucleoside triphosphate hydrolases superfamily protein |
| arTal_v1_Chr1_+_11928757_11928757 | 0.22 |
AT1G32920.1
|
AT1G32920
|
hypothetical protein |
| arTal_v1_Chr2_-_17472984_17472984 | 0.22 |
AT2G41870.1
|
AT2G41870
|
Remorin family protein |
| arTal_v1_Chr1_-_28581315_28581315 | 0.22 |
AT1G76160.1
|
sks5
|
SKU5 similar 5 |
| arTal_v1_Chr3_+_618398_618398 | 0.22 |
AT3G02840.1
|
AT3G02840
|
ARM repeat superfamily protein |
| arTal_v1_Chr1_+_18542061_18542061 | 0.22 |
AT1G50040.1
|
AT1G50040
|
formin-like protein, putative (DUF1005) |
| arTal_v1_Chr3_-_7796310_7796460 | 0.22 |
AT3G22120.1
AT3G22120.2 |
CWLP
|
cell wall-plasma membrane linker protein |
| arTal_v1_Chr3_-_20718866_20718866 | 0.22 |
AT3G55840.1
|
AT3G55840
|
Hs1pro-1 protein |
| arTal_v1_Chr3_+_17183042_17183090 | 0.22 |
AT3G46640.1
AT3G46640.3 AT3G46640.2 |
PCL1
|
Homeodomain-like superfamily protein |
| arTal_v1_Chr5_-_1931782_1931782 | 0.22 |
AT5G06320.1
|
NHL3
|
NDR1/HIN1-like 3 |
| arTal_v1_Chr1_-_20015038_20015038 | 0.22 |
AT1G53625.1
|
AT1G53625
|
hypothetical protein |
| arTal_v1_Chr1_+_3157501_3157501 | 0.22 |
AT1G09750.1
|
AT1G09750
|
Eukaryotic aspartyl protease family protein |
| arTal_v1_Chr2_-_17115047_17115047 | 0.22 |
AT2G41010.1
|
CAMBP25
|
calmodulin (CAM)-binding protein of 25 kDa |
| arTal_v1_Chr1_+_11767485_11767504 | 0.22 |
AT1G32540.2
AT1G32540.1 AT1G32540.3 AT1G32540.4 AT1G32540.5 AT1G32540.6 AT1G32540.7 |
LOL1
|
lsd one like 1 |
| arTal_v1_Chr1_-_24362054_24362054 | 0.21 |
AT1G65520.1
|
ECI1
|
delta(3), delta(2)-enoyl CoA isomerase 1 |
| arTal_v1_Chr5_-_4986377_4986377 | 0.21 |
AT5G15350.1
|
ENODL17
|
early nodulin-like protein 17 |
| arTal_v1_Chr2_+_19469571_19469612 | 0.21 |
AT2G47440.2
AT2G47440.1 |
AT2G47440
|
Tetratricopeptide repeat (TPR)-like superfamily protein |
| arTal_v1_Chr5_+_25721733_25721733 | 0.21 |
AT5G64310.1
|
AGP1
|
arabinogalactan protein 1 |
| arTal_v1_Chr3_+_20354351_20354351 | 0.21 |
AT3G54940.3
AT3G54940.2 |
AT3G54940
|
Papain family cysteine protease |
| arTal_v1_Chr4_+_128581_128581 | 0.21 |
AT4G00300.1
|
AT4G00300
|
receptor-like kinase |
| arTal_v1_Chr4_-_947075_947085 | 0.21 |
AT4G02130.2
AT4G02130.3 |
GATL6
|
galacturonosyltransferase 6 |
| arTal_v1_Chr4_-_9331646_9331646 | 0.21 |
AT4G16563.1
|
AT4G16563
|
Eukaryotic aspartyl protease family protein |
| arTal_v1_Chr3_+_2288732_2288838 | 0.21 |
AT3G07195.1
AT3G07195.2 |
AT3G07195
|
RPM1-interacting protein 4 (RIN4) family protein |
| arTal_v1_Chr2_+_14216771_14216771 | 0.21 |
AT2G33570.1
|
GALS1
|
glycosyltransferase family protein (DUF23) |
| arTal_v1_Chr3_-_8902835_8902835 | 0.21 |
AT3G24480.1
|
AT3G24480
|
Leucine-rich repeat (LRR) family protein |
| arTal_v1_Chr1_-_29424589_29424589 | 0.21 |
AT1G78210.1
|
AT1G78210
|
alpha/beta-Hydrolases superfamily protein |
| arTal_v1_Chr4_-_8307934_8307934 | 0.21 |
AT4G14440.1
|
HCD1
|
3-hydroxyacyl-CoA dehydratase 1 |
| arTal_v1_Chr5_+_15616770_15616770 | 0.21 |
AT5G39020.1
|
AT5G39020
|
Malectin/receptor-like protein kinase family protein |
| arTal_v1_Chr3_+_9306776_9306776 | 0.20 |
AT3G25600.1
|
AT3G25600
|
Calcium-binding EF-hand family protein |
| arTal_v1_Chr1_-_27648604_27648709 | 0.20 |
AT1G73550.2
AT1G73550.1 |
AT1G73550
|
Bifunctional inhibitor/lipid-transfer protein/seed storage 2S albumin superfamily protein |
| arTal_v1_Chr4_+_11491482_11491482 | 0.20 |
AT4G21620.2
|
AT4G21620
|
glycine-rich protein |
| arTal_v1_Chr3_-_3357754_3357754 | 0.20 |
AT3G10720.2
|
AT3G10720
|
Plant invertase/pectin methylesterase inhibitor superfamily |
| arTal_v1_Chr3_-_20756690_20756690 | 0.20 |
AT3G55950.1
|
CCR3
|
CRINKLY4 related 3 |
| arTal_v1_Chr1_+_8101593_8101593 | 0.20 |
AT1G22885.2
|
AT1G22885
|
transmembrane protein |
| arTal_v1_Chr5_+_21138703_21138703 | 0.20 |
AT5G52050.1
|
AT5G52050
|
MATE efflux family protein |
| arTal_v1_Chr1_-_8559066_8559066 | 0.20 |
AT1G24170.1
|
LGT9
|
Nucleotide-diphospho-sugar transferases superfamily protein |
| arTal_v1_Chr3_+_677240_677240 | 0.20 |
AT3G03000.1
|
AT3G03000
|
EF hand calcium-binding protein family |
| arTal_v1_Chr2_+_9924886_9924933 | 0.20 |
AT2G23320.1
AT2G23320.2 |
WRKY15
|
WRKY DNA-binding protein 15 |
| arTal_v1_Chr3_+_18867834_18867834 | 0.20 |
AT3G50760.1
|
GATL2
|
galacturonosyltransferase-like 2 |
| arTal_v1_Chr4_-_11623797_11623886 | 0.20 |
AT4G21903.2
AT4G21903.1 |
AT4G21903
|
MATE efflux family protein |
| arTal_v1_Chr5_+_17731005_17731005 | 0.20 |
AT5G44060.1
|
AT5G44060
|
embryo sac development arrest protein |
| arTal_v1_Chr2_+_15158561_15158561 | 0.19 |
AT2G36090.1
|
AT2G36090
|
F-box family protein |
| arTal_v1_Chr1_+_22073352_22073352 | 0.19 |
AT1G59970.1
|
AT1G59970
|
Matrixin family protein |
| arTal_v1_Chr4_+_1041086_1041086 | 0.19 |
AT4G02360.1
|
AT4G02360
|
transmembrane protein, putative (Protein of unknown function, DUF538) |
| arTal_v1_Chr3_+_2620713_2620713 | 0.19 |
AT3G08630.1
|
AT3G08630
|
alphavirus core family protein (DUF3411) |
| arTal_v1_Chr3_-_23013909_23014030 | 0.19 |
AT3G62150.2
AT3G62150.1 AT3G62150.3 |
ABCB21
|
P-glycoprotein 21 |
| arTal_v1_Chr3_-_15617149_15617149 | 0.19 |
AT3G43720.2
|
LTPG2
|
Bifunctional inhibitor/lipid-transfer protein/seed storage 2S albumin superfamily protein |
| arTal_v1_Chr5_+_25322975_25322975 | 0.19 |
AT5G63130.2
AT5G63130.1 |
AT5G63130
|
Octicosapeptide/Phox/Bem1p family protein |
| arTal_v1_Chr1_+_6142402_6142402 | 0.19 |
AT1G17840.1
|
ABCG11
|
white-brown complex-like protein |
| arTal_v1_Chr3_-_4620305_4620305 | 0.19 |
AT3G13980.1
|
AT3G13980
|
SKI/DACH domain protein |
| arTal_v1_Chr5_-_26096114_26096114 | 0.19 |
AT5G65300.1
|
AT5G65300
|
hypothetical protein |
| arTal_v1_Chr2_+_10072057_10072057 | 0.19 |
AT2G23690.1
|
AT2G23690
|
HTH-type transcriptional regulator |
| arTal_v1_Chr5_-_21125065_21125065 | 0.19 |
AT5G52020.1
|
AT5G52020
|
Integrase-type DNA-binding superfamily protein |
| arTal_v1_Chr5_+_17585523_17585523 | 0.19 |
AT5G43760.1
|
KCS20
|
3-ketoacyl-CoA synthase 20 |
| arTal_v1_Chr3_-_15617309_15617309 | 0.19 |
AT3G43720.1
|
LTPG2
|
Bifunctional inhibitor/lipid-transfer protein/seed storage 2S albumin superfamily protein |
| arTal_v1_Chr1_+_23911024_23911024 | 0.19 |
AT1G64390.1
|
GH9C2
|
glycosyl hydrolase 9C2 |
| arTal_v1_Chr2_-_15084559_15084559 | 0.19 |
AT2G35930.1
|
PUB23
|
plant U-box 23 |
| arTal_v1_Chr5_-_17331646_17331646 | 0.19 |
AT5G43170.1
|
ZF3
|
zinc-finger protein 3 |
| arTal_v1_Chr5_-_5310951_5310951 | 0.19 |
AT5G16250.1
|
AT5G16250
|
transmembrane protein |
| arTal_v1_Chr4_-_12520898_12520898 | 0.19 |
AT4G24110.1
|
AT4G24110
|
NADP-specific glutamate dehydrogenase |
| arTal_v1_Chr5_+_6813762_6813762 | 0.19 |
AT5G20190.1
|
AT5G20190
|
Tetratricopeptide repeat (TPR)-like superfamily protein |
| arTal_v1_Chr5_-_26906517_26906524 | 0.19 |
AT5G67420.1
AT5G67420.2 |
LBD37
|
LOB domain-containing protein 37 |
| arTal_v1_Chr1_+_24929887_24929887 | 0.18 |
AT1G66820.1
|
AT1G66820
|
glycine-rich protein |
| arTal_v1_Chr4_-_14859503_14859503 | 0.18 |
AT4G30370.1
|
AT4G30370
|
RING/U-box superfamily protein |
| arTal_v1_Chr1_+_1510404_1510404 | 0.18 |
AT1G05210.1
|
AT1G05210
|
Transmembrane protein 97, Putative |
| arTal_v1_Chr4_+_8309384_8309384 | 0.18 |
AT4G14450.1
|
AT4G14450
|
hypothetical protein |
| arTal_v1_Chr2_+_9006610_9006743 | 0.18 |
AT2G20960.3
AT2G20960.2 AT2G20960.1 AT2G20960.4 |
pEARLI4
|
phospholipase-like protein (PEARLI 4) family protein |
| arTal_v1_Chr3_+_18249663_18249727 | 0.18 |
AT3G49220.2
AT3G49220.3 AT3G49220.1 |
AT3G49220
|
Plant invertase/pectin methylesterase inhibitor superfamily |
| arTal_v1_Chr3_-_18594715_18594715 | 0.18 |
AT3G50140.1
AT3G50140.2 |
AT3G50140
|
transmembrane protein, putative (DUF247) |
| arTal_v1_Chr3_+_18522466_18522466 | 0.18 |
AT3G49950.1
|
AT3G49950
|
GRAS family transcription factor |
| arTal_v1_Chr1_-_27358863_27358863 | 0.18 |
AT1G72670.1
|
iqd8
|
IQ-domain 8 |
| arTal_v1_Chr3_-_5618322_5618322 | 0.18 |
AT3G16510.1
|
AT3G16510
|
Calcium-dependent lipid-binding (CaLB domain) family protein |
| arTal_v1_Chr3_-_8268961_8268961 | 0.18 |
AT3G23170.1
|
AT3G23170
|
hypothetical protein |
| arTal_v1_Chr1_-_4291017_4291017 | 0.18 |
AT1G12610.1
|
DDF1
|
Integrase-type DNA-binding superfamily protein |
| arTal_v1_Chr4_+_18576216_18576216 | 0.18 |
AT4G40070.1
|
AT4G40070
|
RING/U-box superfamily protein |
| arTal_v1_Chr1_+_5148982_5148982 | 0.18 |
AT1G14920.1
|
GAI
|
GRAS family transcription factor family protein |
| arTal_v1_Chr4_+_8984787_8984787 | 0.18 |
AT4G15800.1
|
RALFL33
|
ralf-like 33 |
| arTal_v1_Chr2_-_11173278_11173278 | 0.18 |
AT2G26250.1
|
KCS10
|
3-ketoacyl-CoA synthase 10 |
| arTal_v1_Chr4_-_7493080_7493080 | 0.18 |
AT4G12730.1
|
FLA2
|
FASCICLIN-like arabinogalactan 2 |
| arTal_v1_Chr1_-_8940613_8940613 | 0.18 |
AT1G25450.1
|
KCS5
|
3-ketoacyl-CoA synthase 5 |
| arTal_v1_Chr3_+_19569256_19569256 | 0.18 |
AT3G52800.1
AT3G52800.2 |
AT3G52800
|
A20/AN1-like zinc finger family protein |
| arTal_v1_Chr1_+_19154323_19154323 | 0.18 |
AT1G51660.1
|
MKK4
|
mitogen-activated protein kinase kinase 4 |
| arTal_v1_Chr5_-_22080341_22080341 | 0.18 |
AT5G54380.1
|
THE1
|
protein kinase family protein |
| arTal_v1_Chr4_-_947249_947249 | 0.18 |
AT4G02130.1
|
GATL6
|
galacturonosyltransferase 6 |
| arTal_v1_Chr5_+_25233881_25233881 | 0.18 |
AT5G62865.1
|
AT5G62865
|
hypothetical protein |
| arTal_v1_Chr2_+_17728479_17728479 | 0.18 |
AT2G42580.1
|
TTL3
|
tetratricopetide-repeat thioredoxin-like 3 |
| arTal_v1_Chr5_+_19397041_19397041 | 0.18 |
AT5G47910.1
|
RBOHD
|
respiratory burst oxidase homologue D |
| arTal_v1_Chr4_-_11841450_11841450 | 0.18 |
AT4G22470.1
|
AT4G22470
|
protease inhibitor/seed storage/lipid transfer protein (LTP) family protein |
| arTal_v1_Chr5_-_21098959_21098959 | 0.18 |
AT5G51920.1
|
AT5G51920
|
Pyridoxal phosphate (PLP)-dependent transferases superfamily protein |
| arTal_v1_Chr1_+_4810115_4810115 | 0.18 |
AT1G14040.1
|
AT1G14040
|
EXS (ERD1/XPR1/SYG1) family protein |
| arTal_v1_Chr4_-_12436712_12436827 | 0.18 |
AT4G23930.2
AT4G23930.1 |
AT4G23930
|
Late embryogenesis abundant (LEA) hydroxyproline-rich glycoprotein family |
| arTal_v1_Chr1_+_6679281_6679281 | 0.18 |
AT1G19320.1
|
AT1G19320
|
Pathogenesis-related thaumatin superfamily protein |
| arTal_v1_Chr4_-_8415605_8415650 | 0.17 |
AT4G14680.2
AT4G14680.1 |
APS3
|
Pseudouridine synthase/archaeosine transglycosylase-like family protein |
| arTal_v1_Chr2_-_12785037_12785037 | 0.17 |
AT2G29980.2
|
FAD3
|
fatty acid desaturase 3 |
| arTal_v1_Chr2_+_17902370_17902370 | 0.17 |
AT2G43050.1
|
ATPMEPCRD
|
Plant invertase/pectin methylesterase inhibitor superfamily |
| arTal_v1_Chr1_+_23144385_23144385 | 0.17 |
AT1G62520.1
|
AT1G62520
|
sulfated surface-like glycoprotein |
| arTal_v1_Chr2_+_1966610_1966610 | 0.17 |
AT2G05380.3
|
GRP3S
|
glycine-rich protein 3 short isoform |
| arTal_v1_Chr2_+_1966806_1966816 | 0.17 |
AT2G05380.1
AT2G05380.2 |
GRP3S
|
glycine-rich protein 3 short isoform |
| arTal_v1_Chr2_+_17886101_17886101 | 0.17 |
AT2G43010.1
AT2G43010.3 AT2G43010.4 |
PIF4
|
phytochrome interacting factor 4 |
| arTal_v1_Chr5_+_17451488_17451488 | 0.17 |
AT5G43420.1
|
AT5G43420
|
RING/U-box superfamily protein |
| arTal_v1_Chr5_-_442187_442187 | 0.17 |
AT5G02220.1
|
AT5G02220
|
cyclin-dependent kinase inhibitor |
| arTal_v1_Chr2_-_12149072_12149072 | 0.17 |
AT2G28400.1
|
AT2G28400
|
senescence regulator (Protein of unknown function, DUF584) |
| arTal_v1_Chr5_+_18218586_18218603 | 0.17 |
AT5G45100.2
AT5G45100.1 |
BRG1
|
SBP (S-ribonuclease binding protein) family protein |
| arTal_v1_Chr1_+_21345445_21345445 | 0.17 |
AT1G57630.1
|
AT1G57630
|
Toll-Interleukin-Resistance (TIR) domain family protein |
| arTal_v1_Chr2_-_12785190_12785190 | 0.17 |
AT2G29980.1
|
FAD3
|
fatty acid desaturase 3 |
| arTal_v1_Chr1_-_20019835_20019835 | 0.17 |
AT1G53635.1
|
AT1G53635
|
hypothetical protein |
| arTal_v1_Chr1_-_7958464_7958564 | 0.17 |
AT1G22530.2
AT1G22530.1 |
PATL2
|
PATELLIN 2 |
| arTal_v1_Chr5_+_24772326_24772326 | 0.17 |
AT5G61620.1
|
AT5G61620
|
myb-like transcription factor family protein |
| arTal_v1_Chr1_+_10810877_10810877 | 0.17 |
AT1G30520.4
AT1G30520.3 |
AAE14
|
acyl-activating enzyme 14 |
| arTal_v1_Chr5_+_309374_309434 | 0.17 |
AT5G01810.1
AT5G01810.2 AT5G01810.3 |
CIPK15
|
CBL-interacting protein kinase 15 |
| arTal_v1_Chr3_+_5314817_5314817 | 0.17 |
AT3G15680.1
AT3G15680.2 |
AT3G15680
|
Ran BP2/NZF zinc finger-like superfamily protein |
| arTal_v1_Chr2_-_12343443_12343443 | 0.17 |
AT2G28780.1
|
AT2G28780
|
P-hydroxybenzoic acid efflux pump subunit |
| arTal_v1_Chr3_-_8064649_8064649 | 0.17 |
AT3G22800.1
|
AT3G22800
|
Leucine-rich repeat (LRR) family protein |
| arTal_v1_Chr1_-_10664570_10664668 | 0.17 |
AT1G30280.2
AT1G30280.3 AT1G30280.1 |
AT1G30280
|
Chaperone DnaJ-domain superfamily protein |
| arTal_v1_Chr2_-_17263017_17263017 | 0.17 |
AT2G41410.1
|
AT2G41410
|
Calcium-binding EF-hand family protein |
| arTal_v1_Chr3_+_22129505_22129505 | 0.16 |
AT3G59900.1
|
ARGOS
|
auxin-regulated gene involved in organ size |
| arTal_v1_Chr5_+_26772644_26772644 | 0.16 |
AT5G67080.1
|
MAPKKK19
|
mitogen-activated protein kinase kinase kinase 19 |
| arTal_v1_Chr3_-_19427230_19427230 | 0.16 |
AT3G52400.1
|
SYP122
|
syntaxin of plants 122 |
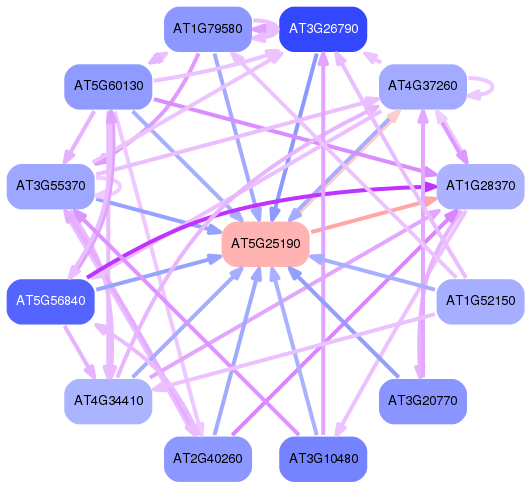
Network of associatons between targets according to the STRING database.

First level regulatory network of AT5G25190
Gene Ontology Analysis
Gene overrepresentation in biological process category:
| Log-likelihood per target | Total log-likelihood | Term | Description |
|---|---|---|---|
| 0.3 | 0.9 | GO:0071422 | thiosulfate transport(GO:0015709) succinate transmembrane transport(GO:0071422) |
| 0.1 | 0.7 | GO:0009759 | indole glucosinolate biosynthetic process(GO:0009759) |
| 0.1 | 0.4 | GO:0080094 | response to trehalose-6-phosphate(GO:0080094) |
| 0.1 | 0.4 | GO:0008615 | pyridoxine biosynthetic process(GO:0008615) |
| 0.1 | 0.3 | GO:0035264 | multicellular organism growth(GO:0035264) |
| 0.1 | 0.2 | GO:1901031 | regulation of response to reactive oxygen species(GO:1901031) |
| 0.1 | 0.3 | GO:0006569 | tryptophan catabolic process(GO:0006569) indolalkylamine catabolic process(GO:0046218) |
| 0.1 | 0.6 | GO:0070814 | hydrogen sulfide biosynthetic process(GO:0070814) |
| 0.1 | 0.2 | GO:0080051 | cutin transport(GO:0080051) |
| 0.1 | 0.2 | GO:0060776 | simple leaf morphogenesis(GO:0060776) |
| 0.1 | 0.2 | GO:0015696 | ammonium transport(GO:0015696) |
| 0.1 | 0.2 | GO:0015854 | adenine transport(GO:0015853) guanine transport(GO:0015854) |
| 0.1 | 0.2 | GO:0046622 | positive regulation of organ growth(GO:0046622) |
| 0.0 | 0.1 | GO:0015840 | urea transport(GO:0015840) |
| 0.0 | 0.2 | GO:0019586 | uronic acid metabolic process(GO:0006063) galacturonate metabolic process(GO:0019586) |
| 0.0 | 0.1 | GO:0048281 | inflorescence morphogenesis(GO:0048281) |
| 0.0 | 0.1 | GO:0090143 | nucleoid organization(GO:0090143) |
| 0.0 | 0.2 | GO:0010185 | regulation of cellular defense response(GO:0010185) |
| 0.0 | 0.2 | GO:0080029 | cellular response to boron-containing substance levels(GO:0080029) |
| 0.0 | 0.3 | GO:0007205 | protein kinase C-activating G-protein coupled receptor signaling pathway(GO:0007205) |
| 0.0 | 0.1 | GO:0017145 | stem cell division(GO:0017145) |
| 0.0 | 0.8 | GO:2000033 | regulation of seed dormancy process(GO:2000033) |
| 0.0 | 0.2 | GO:0060919 | auxin influx(GO:0060919) |
| 0.0 | 0.2 | GO:0048480 | stigma development(GO:0048480) |
| 0.0 | 0.5 | GO:0009554 | megasporogenesis(GO:0009554) |
| 0.0 | 0.1 | GO:0043618 | regulation of transcription from RNA polymerase II promoter in response to stress(GO:0043618) |
| 0.0 | 0.4 | GO:0022610 | cell adhesion(GO:0007155) biological adhesion(GO:0022610) |
| 0.0 | 0.2 | GO:2000037 | regulation of stomatal complex patterning(GO:2000037) |
| 0.0 | 0.7 | GO:0009969 | xyloglucan biosynthetic process(GO:0009969) |
| 0.0 | 0.3 | GO:1902290 | positive regulation of defense response to oomycetes(GO:1902290) |
| 0.0 | 0.1 | GO:0033306 | phytol metabolic process(GO:0033306) |
| 0.0 | 4.8 | GO:0010200 | response to chitin(GO:0010200) |
| 0.0 | 0.3 | GO:0010371 | regulation of gibberellin biosynthetic process(GO:0010371) |
| 0.0 | 0.1 | GO:0006386 | termination of RNA polymerase III transcription(GO:0006386) |
| 0.0 | 0.4 | GO:1900056 | negative regulation of leaf senescence(GO:1900056) |
| 0.0 | 0.1 | GO:0010376 | stomatal complex formation(GO:0010376) |
| 0.0 | 0.2 | GO:0071169 | establishment of mitotic sister chromatid cohesion(GO:0034087) establishment of protein localization to chromosome(GO:0070199) rDNA condensation(GO:0070550) establishment of protein localization to chromatin(GO:0071169) transcriptional activation by promoter-enhancer looping(GO:0071733) gene looping(GO:0090202) dsDNA loop formation(GO:0090579) |
| 0.0 | 0.1 | GO:0006097 | glyoxylate cycle(GO:0006097) |
| 0.0 | 0.3 | GO:0034219 | carbohydrate transmembrane transport(GO:0034219) |
| 0.0 | 1.3 | GO:0045489 | pectin biosynthetic process(GO:0045489) |
| 0.0 | 0.1 | GO:0006307 | DNA dealkylation involved in DNA repair(GO:0006307) |
| 0.0 | 0.1 | GO:0097054 | L-glutamate biosynthetic process(GO:0097054) |
| 0.0 | 0.1 | GO:0010198 | synergid death(GO:0010198) |
| 0.0 | 0.1 | GO:0007076 | mitotic chromosome condensation(GO:0007076) |
| 0.0 | 0.1 | GO:0051016 | barbed-end actin filament capping(GO:0051016) |
| 0.0 | 0.1 | GO:0046087 | cytidine catabolic process(GO:0006216) cytidine deamination(GO:0009972) cytidine metabolic process(GO:0046087) |
| 0.0 | 0.4 | GO:0010600 | regulation of auxin biosynthetic process(GO:0010600) |
| 0.0 | 0.1 | GO:0019310 | inositol catabolic process(GO:0019310) |
| 0.0 | 0.1 | GO:0048657 | anther wall tapetum formation(GO:0048656) anther wall tapetum cell differentiation(GO:0048657) |
| 0.0 | 0.4 | GO:0009870 | defense response signaling pathway, resistance gene-dependent(GO:0009870) |
| 0.0 | 0.2 | GO:1902183 | regulation of shoot apical meristem development(GO:1902183) |
| 0.0 | 0.1 | GO:0097033 | respiratory chain complex III assembly(GO:0017062) mitochondrial respiratory chain complex III assembly(GO:0034551) mitochondrial respiratory chain complex III biogenesis(GO:0097033) |
| 0.0 | 0.1 | GO:0052317 | camalexin biosynthetic process(GO:0010120) camalexin metabolic process(GO:0052317) |
| 0.0 | 0.1 | GO:1902292 | cell cycle DNA replication initiation(GO:1902292) nuclear cell cycle DNA replication initiation(GO:1902315) mitotic DNA replication initiation(GO:1902975) |
| 0.0 | 0.1 | GO:0040019 | positive regulation of embryonic development(GO:0040019) |
| 0.0 | 0.6 | GO:0006636 | unsaturated fatty acid biosynthetic process(GO:0006636) |
| 0.0 | 0.2 | GO:0042753 | positive regulation of circadian rhythm(GO:0042753) |
| 0.0 | 0.1 | GO:0009660 | amyloplast organization(GO:0009660) |
| 0.0 | 0.1 | GO:0080120 | CAAX-box protein processing(GO:0071586) CAAX-box protein maturation(GO:0080120) |
| 0.0 | 0.1 | GO:0034227 | tRNA thio-modification(GO:0034227) |
| 0.0 | 0.2 | GO:0009684 | indoleacetic acid biosynthetic process(GO:0009684) |
| 0.0 | 0.7 | GO:0042335 | cuticle development(GO:0042335) |
| 0.0 | 0.1 | GO:0018364 | box C/D snoRNA 3'-end processing(GO:0000494) peptidyl-glutamine methylation(GO:0018364) box C/D snoRNA metabolic process(GO:0033967) box C/D snoRNA processing(GO:0034963) histone glutamine methylation(GO:1990258) |
| 0.0 | 0.1 | GO:0007187 | G-protein coupled receptor signaling pathway, coupled to cyclic nucleotide second messenger(GO:0007187) adenylate cyclase-modulating G-protein coupled receptor signaling pathway(GO:0007188) |
| 0.0 | 0.1 | GO:1901537 | positive regulation of DNA demethylation(GO:1901537) |
| 0.0 | 0.4 | GO:0010337 | regulation of salicylic acid metabolic process(GO:0010337) |
| 0.0 | 0.1 | GO:0046498 | S-adenosylmethionine cycle(GO:0033353) S-adenosylhomocysteine metabolic process(GO:0046498) |
| 0.0 | 0.1 | GO:0071763 | nuclear membrane organization(GO:0071763) |
| 0.0 | 0.1 | GO:0045038 | protein import into chloroplast thylakoid membrane(GO:0045038) |
| 0.0 | 0.2 | GO:0009610 | response to symbiotic fungus(GO:0009610) |
| 0.0 | 0.0 | GO:0051291 | protein heterooligomerization(GO:0051291) |
| 0.0 | 0.0 | GO:0090355 | positive regulation of auxin metabolic process(GO:0090355) |
| 0.0 | 0.1 | GO:0098534 | centrosome cycle(GO:0007098) centriole replication(GO:0007099) centrosome organization(GO:0051297) centrosome duplication(GO:0051298) centriole assembly(GO:0098534) |
| 0.0 | 0.2 | GO:0042374 | phylloquinone biosynthetic process(GO:0042372) phylloquinone metabolic process(GO:0042374) |
| 0.0 | 0.1 | GO:0046345 | sesquiterpenoid catabolic process(GO:0016107) apocarotenoid catabolic process(GO:0043290) abscisic acid catabolic process(GO:0046345) |
| 0.0 | 0.2 | GO:0052482 | defense response by cell wall thickening(GO:0052482) |
| 0.0 | 0.2 | GO:0006607 | NLS-bearing protein import into nucleus(GO:0006607) |
| 0.0 | 0.4 | GO:2000012 | regulation of auxin polar transport(GO:2000012) |
| 0.0 | 0.1 | GO:0042343 | indole glucosinolate metabolic process(GO:0042343) |
| 0.0 | 0.1 | GO:0006809 | nitric oxide biosynthetic process(GO:0006809) |
| 0.0 | 0.5 | GO:0010193 | response to ozone(GO:0010193) |
| 0.0 | 0.3 | GO:0048826 | cotyledon morphogenesis(GO:0048826) |
| 0.0 | 0.2 | GO:0006086 | acetyl-CoA biosynthetic process from pyruvate(GO:0006086) |
| 0.0 | 1.0 | GO:0051607 | defense response to virus(GO:0051607) |
| 0.0 | 0.0 | GO:0001736 | establishment of planar polarity(GO:0001736) morphogenesis of a polarized epithelium(GO:0001738) morphogenesis of an epithelium(GO:0002009) tissue morphogenesis(GO:0048729) |
| 0.0 | 0.2 | GO:0034312 | sphingosine metabolic process(GO:0006670) diol metabolic process(GO:0034311) diol biosynthetic process(GO:0034312) sphingosine biosynthetic process(GO:0046512) |
| 0.0 | 0.1 | GO:0006272 | leading strand elongation(GO:0006272) |
| 0.0 | 0.3 | GO:0046688 | response to copper ion(GO:0046688) |
| 0.0 | 0.1 | GO:0030259 | lipid glycosylation(GO:0030259) |
| 0.0 | 0.1 | GO:0016103 | diterpenoid catabolic process(GO:0016103) gibberellin catabolic process(GO:0045487) |
| 0.0 | 0.1 | GO:0009697 | salicylic acid biosynthetic process(GO:0009697) |
| 0.0 | 0.0 | GO:0034067 | protein localization to Golgi apparatus(GO:0034067) |
| 0.0 | 0.1 | GO:0009558 | embryo sac cellularization(GO:0009558) |
| 0.0 | 0.1 | GO:0009268 | response to pH(GO:0009268) |
| 0.0 | 0.1 | GO:1901001 | negative regulation of response to salt stress(GO:1901001) |
| 0.0 | 0.1 | GO:0009769 | photosynthesis, light harvesting in photosystem II(GO:0009769) |
| 0.0 | 0.1 | GO:0080026 | indolebutyric acid metabolic process(GO:0080024) response to indolebutyric acid(GO:0080026) |
| 0.0 | 0.1 | GO:0046416 | D-amino acid metabolic process(GO:0046416) |
| 0.0 | 0.1 | GO:0002943 | tRNA dihydrouridine synthesis(GO:0002943) |
| 0.0 | 0.1 | GO:0034635 | glutathione transport(GO:0034635) tripeptide transport(GO:0042939) |
| 0.0 | 0.0 | GO:0043181 | vacuolar sequestering(GO:0043181) |
| 0.0 | 0.1 | GO:0006597 | spermine biosynthetic process(GO:0006597) |
| 0.0 | 0.1 | GO:0009143 | nucleoside triphosphate catabolic process(GO:0009143) |
| 0.0 | 0.1 | GO:0007231 | osmosensory signaling pathway(GO:0007231) |
| 0.0 | 0.1 | GO:1900363 | regulation of mRNA polyadenylation(GO:1900363) |
| 0.0 | 0.0 | GO:0034247 | snoRNA splicing(GO:0034247) |
| 0.0 | 0.2 | GO:0070828 | heterochromatin organization(GO:0070828) |
| 0.0 | 0.0 | GO:0035247 | peptidyl-arginine methylation, to asymmetrical-dimethyl arginine(GO:0019919) peptidyl-arginine N-methylation(GO:0035246) peptidyl-arginine omega-N-methylation(GO:0035247) |
| 0.0 | 0.1 | GO:0015969 | guanosine tetraphosphate metabolic process(GO:0015969) purine ribonucleoside bisphosphate metabolic process(GO:0034035) |
| 0.0 | 0.0 | GO:0035436 | triose phosphate transport(GO:0015717) triose phosphate transmembrane transport(GO:0035436) |
| 0.0 | 0.1 | GO:0032012 | ARF protein signal transduction(GO:0032011) regulation of ARF protein signal transduction(GO:0032012) |
| 0.0 | 0.1 | GO:0046051 | UTP biosynthetic process(GO:0006228) UTP metabolic process(GO:0046051) |
| 0.0 | 0.1 | GO:0080001 | mucilage extrusion from seed coat(GO:0080001) |
| 0.0 | 0.1 | GO:0043410 | positive regulation of MAPK cascade(GO:0043410) |
| 0.0 | 0.1 | GO:0010206 | photosystem II repair(GO:0010206) |
| 0.0 | 0.0 | GO:0001173 | DNA-templated transcriptional start site selection(GO:0001173) |
| 0.0 | 0.2 | GO:0006949 | syncytium formation(GO:0006949) |
| 0.0 | 0.1 | GO:0052542 | defense response by callose deposition(GO:0052542) |
| 0.0 | 0.1 | GO:0043570 | meiotic mismatch repair(GO:0000710) maintenance of DNA repeat elements(GO:0043570) |
| 0.0 | 0.1 | GO:0045903 | positive regulation of translational fidelity(GO:0045903) |
| 0.0 | 0.1 | GO:0072583 | clathrin-mediated endocytosis(GO:0072583) |
| 0.0 | 0.1 | GO:0009954 | proximal/distal pattern formation(GO:0009954) |
| 0.0 | 0.0 | GO:0051457 | maintenance of protein location in nucleus(GO:0051457) |
| 0.0 | 0.1 | GO:0019323 | pentose catabolic process(GO:0019323) |
| 0.0 | 0.0 | GO:0006571 | tyrosine biosynthetic process(GO:0006571) |
| 0.0 | 0.1 | GO:1901269 | lipid A biosynthetic process(GO:0009245) lipid A metabolic process(GO:0046493) lipooligosaccharide metabolic process(GO:1901269) lipooligosaccharide biosynthetic process(GO:1901271) |
| 0.0 | 0.2 | GO:0006268 | DNA unwinding involved in DNA replication(GO:0006268) |
| 0.0 | 0.1 | GO:0072659 | protein localization to plasma membrane(GO:0072659) |
| 0.0 | 0.1 | GO:0045039 | protein import into mitochondrial inner membrane(GO:0045039) |
| 0.0 | 0.0 | GO:0033120 | positive regulation of RNA splicing(GO:0033120) |
Gene overrepresentation in cellular component category:
| Log-likelihood per target | Total log-likelihood | Term | Description |
|---|---|---|---|
| 0.1 | 0.2 | GO:0045334 | clathrin-coated endocytic vesicle(GO:0045334) |
| 0.1 | 0.3 | GO:0009897 | external side of plasma membrane(GO:0009897) |
| 0.0 | 0.2 | GO:0000311 | plastid large ribosomal subunit(GO:0000311) |
| 0.0 | 0.2 | GO:0005640 | nuclear outer membrane(GO:0005640) |
| 0.0 | 0.1 | GO:0030874 | nucleolar chromatin(GO:0030874) |
| 0.0 | 0.1 | GO:0005967 | mitochondrial pyruvate dehydrogenase complex(GO:0005967) |
| 0.0 | 0.3 | GO:1903561 | extracellular organelle(GO:0043230) extracellular exosome(GO:0070062) extracellular vesicle(GO:1903561) |
| 0.0 | 0.1 | GO:0009925 | basal plasma membrane(GO:0009925) basolateral plasma membrane(GO:0016323) basal part of cell(GO:0045178) |
| 0.0 | 0.1 | GO:0055038 | recycling endosome membrane(GO:0055038) |
| 0.0 | 0.1 | GO:0000796 | condensin complex(GO:0000796) |
| 0.0 | 0.1 | GO:0032301 | MutSalpha complex(GO:0032301) |
| 0.0 | 0.1 | GO:0070505 | pollen coat(GO:0070505) |
| 0.0 | 0.1 | GO:0009514 | glyoxysome(GO:0009514) |
| 0.0 | 0.4 | GO:0000792 | heterochromatin(GO:0000792) |
| 0.0 | 0.1 | GO:0005814 | centrosome(GO:0005813) centriole(GO:0005814) |
| 0.0 | 0.1 | GO:0005834 | heterotrimeric G-protein complex(GO:0005834) |
| 0.0 | 0.1 | GO:0009538 | photosystem I reaction center(GO:0009538) |
| 0.0 | 0.1 | GO:0030139 | endocytic vesicle(GO:0030139) |
| 0.0 | 0.0 | GO:0005785 | signal recognition particle receptor complex(GO:0005785) |
| 0.0 | 0.2 | GO:0000326 | storage vacuole(GO:0000322) protein storage vacuole(GO:0000326) |
| 0.0 | 0.1 | GO:0000812 | Swr1 complex(GO:0000812) |
| 0.0 | 0.2 | GO:0005801 | cis-Golgi network(GO:0005801) |
| 0.0 | 0.1 | GO:0005687 | U4 snRNP(GO:0005687) |
| 0.0 | 0.2 | GO:0005750 | mitochondrial respiratory chain complex III(GO:0005750) respiratory chain complex III(GO:0045275) |
| 0.0 | 0.1 | GO:0070652 | HAUS complex(GO:0070652) |
| 0.0 | 3.5 | GO:0031225 | anchored component of membrane(GO:0031225) |
| 0.0 | 0.2 | GO:0033179 | proton-transporting V-type ATPase, V0 domain(GO:0033179) |
| 0.0 | 0.7 | GO:0005797 | Golgi medial cisterna(GO:0005797) |
| 0.0 | 0.0 | GO:0009330 | DNA topoisomerase complex (ATP-hydrolyzing)(GO:0009330) |
| 0.0 | 1.0 | GO:0000138 | Golgi trans cisterna(GO:0000138) |
| 0.0 | 0.0 | GO:0031897 | Tic complex(GO:0031897) |
| 0.0 | 0.1 | GO:0032588 | trans-Golgi network membrane(GO:0032588) |
| 0.0 | 0.2 | GO:0005769 | early endosome(GO:0005769) |
Gene overrepresentation in molecular function category:
| Log-likelihood per target | Total log-likelihood | Term | Description |
|---|---|---|---|
| 0.3 | 0.9 | GO:0015117 | thiosulfate transmembrane transporter activity(GO:0015117) |
| 0.1 | 0.5 | GO:0016712 | oxidoreductase activity, acting on paired donors, with incorporation or reduction of molecular oxygen, reduced flavin or flavoprotein as one donor, and incorporation of one atom of oxygen(GO:0016712) aromatase activity(GO:0070330) |
| 0.1 | 0.5 | GO:0033843 | xyloglucan 6-xylosyltransferase activity(GO:0033843) |
| 0.1 | 0.4 | GO:0016856 | racemase and epimerase activity, acting on hydroxy acids and derivatives(GO:0016856) |
| 0.1 | 0.3 | GO:0008519 | ammonium transmembrane transporter activity(GO:0008519) |
| 0.1 | 0.1 | GO:0004165 | dodecenoyl-CoA delta-isomerase activity(GO:0004165) |
| 0.1 | 0.4 | GO:0004001 | adenosine kinase activity(GO:0004001) |
| 0.1 | 0.6 | GO:0004020 | adenylylsulfate kinase activity(GO:0004020) |
| 0.1 | 0.2 | GO:0035615 | clathrin adaptor activity(GO:0035615) endocytic adaptor activity(GO:0098748) |
| 0.1 | 0.3 | GO:0031956 | medium-chain fatty acid-CoA ligase activity(GO:0031956) |
| 0.1 | 0.2 | GO:0008481 | sphinganine kinase activity(GO:0008481) |
| 0.0 | 0.2 | GO:0047782 | coniferin beta-glucosidase activity(GO:0047782) |
| 0.0 | 0.3 | GO:0080109 | indole-3-acetonitrile nitrile hydratase activity(GO:0080109) |
| 0.0 | 0.2 | GO:0015245 | fatty acid transporter activity(GO:0015245) |
| 0.0 | 0.4 | GO:0009922 | fatty acid elongase activity(GO:0009922) |
| 0.0 | 0.3 | GO:0004143 | diacylglycerol kinase activity(GO:0004143) |
| 0.0 | 1.1 | GO:0047262 | polygalacturonate 4-alpha-galacturonosyltransferase activity(GO:0047262) |
| 0.0 | 0.2 | GO:0050378 | UDP-glucuronate 4-epimerase activity(GO:0050378) |
| 0.0 | 0.2 | GO:0052743 | inositol-polyphosphate 5-phosphatase activity(GO:0004445) inositol-1,3,4,5-tetrakisphosphate 5-phosphatase activity(GO:0052659) inositol tetrakisphosphate phosphatase activity(GO:0052743) |
| 0.0 | 0.5 | GO:0042389 | omega-3 fatty acid desaturase activity(GO:0042389) |
| 0.0 | 0.1 | GO:0015146 | pentose transmembrane transporter activity(GO:0015146) |
| 0.0 | 0.7 | GO:0005199 | structural constituent of cell wall(GO:0005199) |
| 0.0 | 0.1 | GO:0016418 | dihydrolipoyllysine-residue acetyltransferase activity(GO:0004742) S-acetyltransferase activity(GO:0016418) |
| 0.0 | 0.3 | GO:0001653 | peptide receptor activity(GO:0001653) |
| 0.0 | 0.1 | GO:0045485 | omega-6 fatty acid desaturase activity(GO:0045485) |
| 0.0 | 0.1 | GO:0003852 | 2-isopropylmalate synthase activity(GO:0003852) |
| 0.0 | 0.3 | GO:0008506 | sucrose:proton symporter activity(GO:0008506) |
| 0.0 | 0.1 | GO:0031683 | G-protein coupled receptor binding(GO:0001664) G-protein beta/gamma-subunit complex binding(GO:0031683) |
| 0.0 | 0.1 | GO:0045181 | glutamate synthase activity(GO:0015930) glutamate synthase (NADH) activity(GO:0016040) glutamate synthase activity, NAD(P)H as acceptor(GO:0045181) |
| 0.0 | 0.1 | GO:0008311 | phosphodiesterase I activity(GO:0004528) double-stranded DNA 3'-5' exodeoxyribonuclease activity(GO:0008311) |
| 0.0 | 0.1 | GO:0016629 | 12-oxophytodienoate reductase activity(GO:0016629) |
| 0.0 | 0.2 | GO:0010328 | auxin influx transmembrane transporter activity(GO:0010328) |
| 0.0 | 0.2 | GO:0001671 | ATPase activator activity(GO:0001671) |
| 0.0 | 0.1 | GO:0004126 | cytidine deaminase activity(GO:0004126) |
| 0.0 | 0.1 | GO:0008442 | 3-hydroxyisobutyrate dehydrogenase activity(GO:0008442) |
| 0.0 | 0.1 | GO:0050113 | inositol oxygenase activity(GO:0050113) |
| 0.0 | 0.1 | GO:0016768 | spermine synthase activity(GO:0016768) |
| 0.0 | 0.1 | GO:0000248 | C-5 sterol desaturase activity(GO:0000248) |
| 0.0 | 0.1 | GO:0032143 | single base insertion or deletion binding(GO:0032138) single thymine insertion binding(GO:0032143) mismatch repair complex binding(GO:0032404) MutLalpha complex binding(GO:0032405) |
| 0.0 | 0.1 | GO:0035671 | enone reductase activity(GO:0035671) |
| 0.0 | 0.1 | GO:0032131 | alkylated DNA binding(GO:0032131) |
| 0.0 | 0.1 | GO:0010295 | (+)-abscisic acid 8'-hydroxylase activity(GO:0010295) |
| 0.0 | 0.2 | GO:0032266 | phosphatidylinositol-3-phosphate binding(GO:0032266) |
| 0.0 | 0.3 | GO:0004708 | MAP kinase kinase activity(GO:0004708) |
| 0.0 | 0.1 | GO:0008963 | phospho-N-acetylmuramoyl-pentapeptide-transferase activity(GO:0008963) |
| 0.0 | 0.2 | GO:0051747 | cytosine C-5 DNA demethylase activity(GO:0051747) |
| 0.0 | 0.1 | GO:1990259 | protein-glutamine N-methyltransferase activity(GO:0036009) histone-glutamine methyltransferase activity(GO:1990259) |
| 0.0 | 0.1 | GO:0003830 | beta-1,4-mannosylglycoprotein 4-beta-N-acetylglucosaminyltransferase activity(GO:0003830) |
| 0.0 | 0.1 | GO:0016802 | adenosylhomocysteinase activity(GO:0004013) trialkylsulfonium hydrolase activity(GO:0016802) |
| 0.0 | 0.2 | GO:0043495 | protein anchor(GO:0043495) |
| 0.0 | 0.1 | GO:0005459 | UDP-galactose transmembrane transporter activity(GO:0005459) |
| 0.0 | 0.1 | GO:0051377 | mannose-ethanolamine phosphotransferase activity(GO:0051377) |
| 0.0 | 0.0 | GO:0019166 | trans-2-enoyl-CoA reductase (NADPH) activity(GO:0019166) |
| 0.0 | 0.1 | GO:0004750 | ribulose-phosphate 3-epimerase activity(GO:0004750) |
| 0.0 | 0.1 | GO:1990247 | N6-methyladenosine-containing RNA binding(GO:1990247) |
| 0.0 | 0.0 | GO:0003861 | 3-isopropylmalate dehydratase activity(GO:0003861) |
| 0.0 | 0.1 | GO:0005350 | pyrimidine nucleobase transmembrane transporter activity(GO:0005350) uracil transmembrane transporter activity(GO:0015210) |
| 0.0 | 0.0 | GO:0052901 | spermine:oxygen oxidoreductase (spermidine-forming) activity(GO:0052901) |
| 0.0 | 0.2 | GO:0008061 | chitin binding(GO:0008061) |
| 0.0 | 0.1 | GO:0017057 | 6-phosphogluconolactonase activity(GO:0017057) |
| 0.0 | 0.0 | GO:0004042 | acetyl-CoA:L-glutamate N-acetyltransferase activity(GO:0004042) |
| 0.0 | 0.1 | GO:0043682 | copper-transporting ATPase activity(GO:0043682) |
| 0.0 | 0.1 | GO:0004739 | pyruvate dehydrogenase activity(GO:0004738) pyruvate dehydrogenase (acetyl-transferring) activity(GO:0004739) |
| 0.0 | 0.1 | GO:0045543 | gibberellin 2-beta-dioxygenase activity(GO:0045543) C-19 gibberellin 2-beta-dioxygenase activity(GO:0052634) |
| 0.0 | 0.1 | GO:0017091 | AU-rich element binding(GO:0017091) |
| 0.0 | 0.0 | GO:0003962 | cystathionine gamma-synthase activity(GO:0003962) |
| 0.0 | 0.3 | GO:0016843 | amine-lyase activity(GO:0016843) |
| 0.0 | 0.2 | GO:0002020 | protease binding(GO:0002020) |
| 0.0 | 0.1 | GO:0036218 | dTTP diphosphatase activity(GO:0036218) |
| 0.0 | 0.2 | GO:0008139 | nuclear localization sequence binding(GO:0008139) |
| 0.0 | 0.2 | GO:0031176 | endo-1,4-beta-xylanase activity(GO:0031176) |
| 0.0 | 0.1 | GO:0005432 | calcium:sodium antiporter activity(GO:0005432) |
| 0.0 | 0.0 | GO:0016277 | [myelin basic protein]-arginine N-methyltransferase activity(GO:0016277) |
| 0.0 | 0.1 | GO:0008728 | GTP diphosphokinase activity(GO:0008728) |
| 0.0 | 0.1 | GO:0003862 | 3-isopropylmalate dehydrogenase activity(GO:0003862) |
| 0.0 | 0.1 | GO:0017116 | ATP-dependent DNA helicase activity(GO:0004003) ATP-dependent helicase activity(GO:0008026) single-stranded DNA-dependent ATP-dependent DNA helicase activity(GO:0017116) single-stranded DNA-dependent ATPase activity(GO:0043142) purine NTP-dependent helicase activity(GO:0070035) |
| 0.0 | 0.1 | GO:0004312 | fatty acid synthase activity(GO:0004312) |
| 0.0 | 0.0 | GO:0003838 | sterol 24-C-methyltransferase activity(GO:0003838) |
| 0.0 | 0.1 | GO:0000285 | 1-phosphatidylinositol-3-phosphate 5-kinase activity(GO:0000285) |
| 0.0 | 0.0 | GO:0001130 | bacterial-type RNA polymerase transcription factor activity, sequence-specific DNA binding(GO:0001130) bacterial-type RNA polymerase transcriptional activator activity, sequence-specific DNA binding(GO:0001216) |
| 0.0 | 0.6 | GO:0004190 | aspartic-type endopeptidase activity(GO:0004190) |
| 0.0 | 0.1 | GO:0003730 | mRNA 3'-UTR binding(GO:0003730) |
| 0.0 | 0.1 | GO:0001872 | (1->3)-beta-D-glucan binding(GO:0001872) |
| 0.0 | 0.3 | GO:0005179 | hormone activity(GO:0005179) |
| 0.0 | 0.0 | GO:0051669 | levanase activity(GO:0031219) fructan beta-fructosidase activity(GO:0051669) |
| 0.0 | 0.1 | GO:0046509 | 1,2-diacylglycerol 3-beta-galactosyltransferase activity(GO:0046509) |
| 0.0 | 0.1 | GO:0017110 | nucleoside-diphosphatase activity(GO:0017110) |
| 0.0 | 0.1 | GO:0009378 | four-way junction helicase activity(GO:0009378) |
| 0.0 | 0.1 | GO:0035197 | siRNA binding(GO:0035197) |
| 0.0 | 0.0 | GO:0050815 | phosphoserine binding(GO:0050815) RNA polymerase II C-terminal domain phosphoserine binding(GO:1990269) |
| 0.0 | 0.2 | GO:0102336 | 3-oxo-arachidoyl-CoA synthase activity(GO:0102336) 3-oxo-cerotoyl-CoA synthase activity(GO:0102337) 3-oxo-lignoceronyl-CoA synthase activity(GO:0102338) |
Gene overrepresentation in curated gene sets: canonical pathways category:
| Log-likelihood per target | Total log-likelihood | Term | Description |
|---|---|---|---|
| 0.0 | 0.2 | ST WNT BETA CATENIN PATHWAY | Wnt/beta-catenin Pathway |
| 0.0 | 0.2 | PID S1P S1P1 PATHWAY | S1P1 pathway |
| 0.0 | 0.0 | PID PI3KCI PATHWAY | Class I PI3K signaling events |
Gene overrepresentation in curated gene sets: REACTOME pathways category:
| Log-likelihood per target | Total log-likelihood | Term | Description |
|---|---|---|---|
| 0.1 | 0.2 | REACTOME SPHINGOLIPID DE NOVO BIOSYNTHESIS | Genes involved in Sphingolipid de novo biosynthesis |
| 0.0 | 0.1 | REACTOME TRANSCRIPTIONAL ACTIVITY OF SMAD2 SMAD3 SMAD4 HETEROTRIMER | Genes involved in Transcriptional activity of SMAD2/SMAD3:SMAD4 heterotrimer |
| 0.0 | 0.2 | REACTOME CHEMOKINE RECEPTORS BIND CHEMOKINES | Genes involved in Chemokine receptors bind chemokines |
| 0.0 | 0.1 | REACTOME LIPID DIGESTION MOBILIZATION AND TRANSPORT | Genes involved in Lipid digestion, mobilization, and transport |
| 0.0 | 0.1 | REACTOME GOLGI ASSOCIATED VESICLE BIOGENESIS | Genes involved in Golgi Associated Vesicle Biogenesis |
| 0.0 | 0.2 | REACTOME FATTY ACID TRIACYLGLYCEROL AND KETONE BODY METABOLISM | Genes involved in Fatty acid, triacylglycerol, and ketone body metabolism |
| 0.0 | 0.0 | REACTOME AMINO ACID SYNTHESIS AND INTERCONVERSION TRANSAMINATION | Genes involved in Amino acid synthesis and interconversion (transamination) |
| 0.0 | 0.1 | REACTOME INNATE IMMUNE SYSTEM | Genes involved in Innate Immune System |