Project
GSE130291:vernalization in Arabidopsis thaliana
Navigation
Downloads
Results for AT5G14750
Z-value: 0.05
Transcription factors associated with AT5G14750
| Gene Symbol | Gene ID | Gene Info |
|---|---|---|
|
AT5G14750
|
AT5G14750 | myb domain protein 66 |
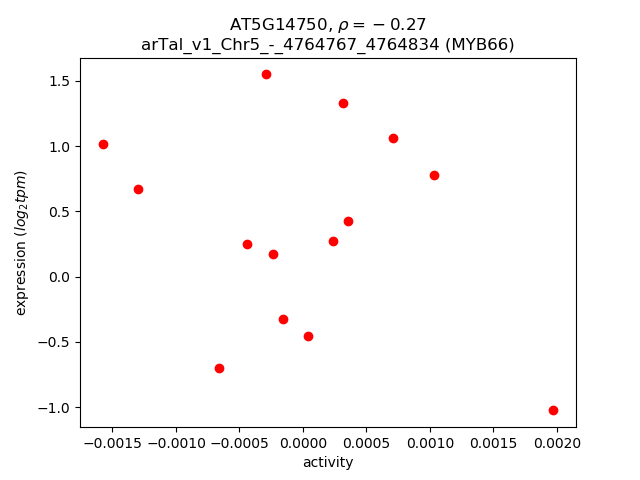
Activity-expression correlation:
| Gene | Promoter | Pearson corr. coef. | P-value | Plot |
|---|---|---|---|---|
| MYB66 | arTal_v1_Chr5_-_4764767_4764834 | -0.27 | 3.6e-01 | Click! |
Activity profile of AT5G14750 motif
Sorted Z-values of AT5G14750 motif
| Promoter | Log-likelihood | Transcript | Gene | Gene Info |
|---|---|---|---|---|
| arTal_v1_Chr1_+_30037376_30037431 | 0.03 |
AT1G79840.1
AT1G79840.5 AT1G79840.4 |
GL2
|
HD-ZIP IV family of homeobox-leucine zipper protein with lipid-binding START domain-containing protein |
| arTal_v1_Chr1_+_30036956_30036956 | 0.03 |
AT1G79840.3
AT1G79840.2 |
GL2
|
HD-ZIP IV family of homeobox-leucine zipper protein with lipid-binding START domain-containing protein |
| arTal_v1_Chr1_+_30037640_30037640 | 0.02 |
AT1G79840.6
|
GL2
|
HD-ZIP IV family of homeobox-leucine zipper protein with lipid-binding START domain-containing protein |
| arTal_v1_Chr2_-_19050369_19050369 | 0.01 |
AT2G46410.1
|
CPC
|
Homeodomain-like superfamily protein |
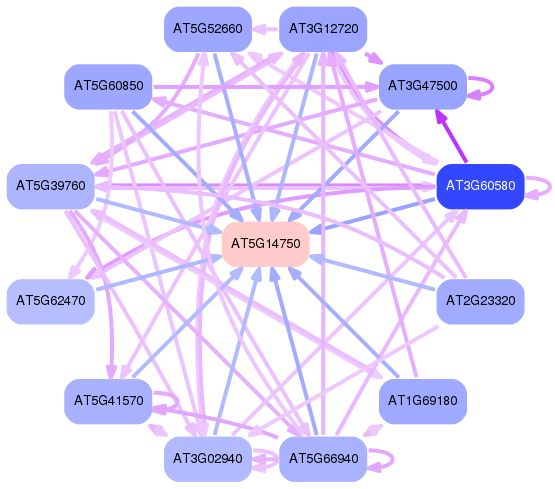
Network of associatons between targets according to the STRING database.

First level regulatory network of AT5G14750
Gene Ontology Analysis
Gene overrepresentation in biological process category:
| Log-likelihood per target | Total log-likelihood | Term | Description |
|---|---|---|---|
| 0.0 | 0.1 | GO:0009996 | negative regulation of cell fate specification(GO:0009996) negative regulation of trichoblast fate specification(GO:0010062) negative regulation of plant epidermal cell differentiation(GO:1903889) |