Project
GSE130291:vernalization in Arabidopsis thaliana
Navigation
Downloads
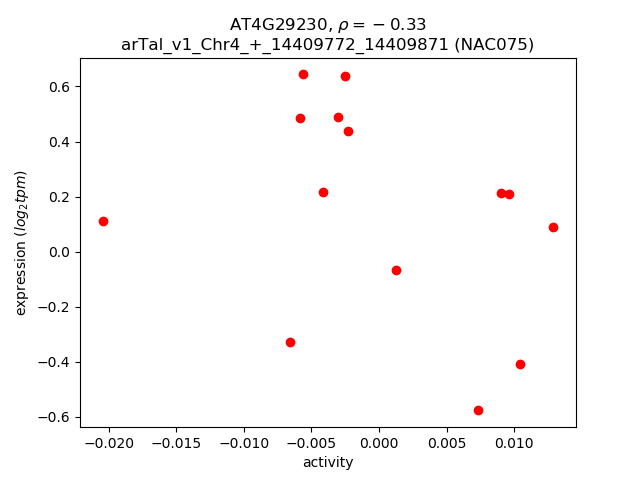
Results for AT4G29230
Z-value: 1.06
Transcription factors associated with AT4G29230
| Gene Symbol | Gene ID | Gene Info |
|---|---|---|
|
AT4G29230
|
AT4G29230 | NAC domain containing protein 75 |
Activity-expression correlation:
| Gene | Promoter | Pearson corr. coef. | P-value | Plot |
|---|---|---|---|---|
| NAC075 | arTal_v1_Chr4_+_14409772_14409871 | -0.33 | 2.5e-01 | Click! |
Activity profile of AT4G29230 motif
Sorted Z-values of AT4G29230 motif
| Promoter | Log-likelihood | Transcript | Gene | Gene Info |
|---|---|---|---|---|
| arTal_v1_Chr4_+_13128394_13128394 | 1.56 |
AT4G25810.1
|
XTR6
|
xyloglucan endotransglycosylase 6 |
| arTal_v1_Chr4_-_14827211_14827211 | 1.38 |
AT4G30280.1
|
XTH18
|
xyloglucan endotransglucosylase/hydrolase 18 |
| arTal_v1_Chr2_+_19568464_19568464 | 1.06 |
AT2G47770.1
|
TSPO
|
TSPO(outer membrane tryptophan-rich sensory protein)-like protein |
| arTal_v1_Chr5_-_17331646_17331646 | 1.05 |
AT5G43170.1
|
ZF3
|
zinc-finger protein 3 |
| arTal_v1_Chr1_-_27940309_27940369 | 0.94 |
AT1G74310.1
AT1G74310.2 |
HSP101
|
heat shock protein 101 |
| arTal_v1_Chr4_-_9754161_9754161 | 0.92 |
AT4G17490.1
|
ERF6
|
ethylene responsive element binding factor 6 |
| arTal_v1_Chr1_-_59215_59215 | 0.90 |
AT1G01120.1
|
KCS1
|
3-ketoacyl-CoA synthase 1 |
| arTal_v1_Chr1_-_749034_749034 | 0.84 |
AT1G03106.1
|
AT1G03106
|
hypothetical protein |
| arTal_v1_Chr2_-_8088302_8088302 | 0.81 |
AT2G18650.1
|
MEE16
|
RING/U-box superfamily protein |
| arTal_v1_Chr4_+_13275200_13275200 | 0.81 |
AT4G26200.1
|
ACS7
|
1-amino-cyclopropane-1-carboxylate synthase 7 |
| arTal_v1_Chr5_-_37999_37999 | 0.81 |
AT5G01100.1
|
FRB1
|
O-fucosyltransferase family protein |
| arTal_v1_Chr3_+_17527507_17527507 | 0.79 |
AT3G47570.1
|
AT3G47570
|
Leucine-rich repeat protein kinase family protein |
| arTal_v1_Chr2_-_108803_108829 | 0.78 |
AT2G01180.7
AT2G01180.2 AT2G01180.5 AT2G01180.1 AT2G01180.8 AT2G01180.4 AT2G01180.3 |
PAP1
|
phosphatidic acid phosphatase 1 |
| arTal_v1_Chr1_+_22628264_22628409 | 0.78 |
AT1G61340.1
AT1G61340.2 |
FBS1
|
F-box family protein |
| arTal_v1_Chr3_+_16896166_16896166 | 0.77 |
AT3G45970.2
AT3G45970.1 |
EXLA1
|
expansin-like A1 |
| arTal_v1_Chr3_-_10590685_10590685 | 0.77 |
AT3G28340.1
|
GATL10
|
galacturonosyltransferase-like 10 |
| arTal_v1_Chr3_+_5249112_5249112 | 0.75 |
AT3G15518.1
|
AT3G15518
|
hypothetical protein |
| arTal_v1_Chr4_+_17752079_17752079 | 0.75 |
AT4G37770.1
|
ACS8
|
1-amino-cyclopropane-1-carboxylate synthase 8 |
| arTal_v1_Chr3_+_8550037_8550037 | 0.72 |
AT3G23730.1
|
XTH16
|
xyloglucan endotransglucosylase/hydrolase 16 |
| arTal_v1_Chr1_+_24602033_24602033 | 0.70 |
AT1G66090.1
|
AT1G66090
|
Disease resistance protein (TIR-NBS class) |
| arTal_v1_Chr4_-_17300367_17300367 | 0.70 |
AT4G36700.1
|
AT4G36700
|
RmlC-like cupins superfamily protein |
| arTal_v1_Chr5_-_1293723_1293723 | 0.69 |
AT5G04530.1
|
KCS19
|
3-ketoacyl-CoA synthase 19 |
| arTal_v1_Chr2_-_6867004_6867004 | 0.69 |
AT2G15760.1
|
AT2G15760
|
calmodulin-binding protein (DUF1645) |
| arTal_v1_Chr1_-_13031375_13031375 | 0.68 |
AT1G35430.1
|
AT1G35430
|
transmembrane protein |
| arTal_v1_Chr3_+_18941925_18941925 | 0.67 |
AT3G50980.1
|
XERO1
|
dehydrin xero 1 |
| arTal_v1_Chr4_+_7487225_7487301 | 0.67 |
AT4G12720.2
AT4G12720.5 AT4G12720.1 AT4G12720.4 |
NUDT7
|
MutT/nudix family protein |
| arTal_v1_Chr4_-_16644928_16644928 | 0.64 |
AT4G34950.1
|
AT4G34950
|
Major facilitator superfamily protein |
| arTal_v1_Chr2_+_10838294_10838420 | 0.63 |
AT2G25470.2
AT2G25470.3 AT2G25470.1 |
RLP21
|
receptor like protein 21 |
| arTal_v1_Chr2_-_14740146_14740146 | 0.63 |
AT2G34930.1
|
AT2G34930
|
disease resistance family protein / LRR family protein |
| arTal_v1_Chr5_+_25721733_25721733 | 0.62 |
AT5G64310.1
|
AGP1
|
arabinogalactan protein 1 |
| arTal_v1_Chr1_-_3392524_3392633 | 0.62 |
AT1G10340.2
AT1G10340.1 |
AT1G10340
|
Ankyrin repeat family protein |
| arTal_v1_Chr5_+_733887_733887 | 0.62 |
AT5G03120.1
AT5G03120.2 |
AT5G03120
|
transmembrane protein |
| arTal_v1_Chr3_-_15953346_15953346 | 0.61 |
AT3G44260.1
|
CAF1a
|
Polynucleotidyl transferase, ribonuclease H-like superfamily protein |
| arTal_v1_Chr4_+_7487543_7487543 | 0.61 |
AT4G12720.3
|
NUDT7
|
MutT/nudix family protein |
| arTal_v1_Chr4_-_11397726_11397726 | 0.60 |
AT4G21390.1
AT4G21390.2 |
B120
|
S-locus lectin protein kinase family protein |
| arTal_v1_Chr4_+_7487918_7487918 | 0.60 |
AT4G12720.6
|
NUDT7
|
MutT/nudix family protein |
| arTal_v1_Chr2_-_16780368_16780368 | 0.60 |
AT2G40170.1
|
GEA6
|
Stress induced protein |
| arTal_v1_Chr3_+_10505711_10505711 | 0.60 |
AT3G28180.1
|
CSLC04
|
Cellulose-synthase-like C4 |
| arTal_v1_Chr4_-_15275404_15275404 | 0.60 |
AT4G31500.1
|
CYP83B1
|
cytochrome P450, family 83, subfamily B, polypeptide 1 |
| arTal_v1_Chr3_+_9480746_9480839 | 0.60 |
AT3G25900.1
AT3G25900.3 AT3G25900.2 |
HMT-1
|
Homocysteine S-methyltransferase family protein |
| arTal_v1_Chr2_-_19512728_19512728 | 0.59 |
AT2G47560.1
|
AT2G47560
|
RING/U-box superfamily protein |
| arTal_v1_Chr5_-_23289635_23289635 | 0.59 |
AT5G57510.1
|
AT5G57510
|
cotton fiber protein |
| arTal_v1_Chr1_+_5940292_5940292 | 0.58 |
AT1G17345.1
|
AT1G17345
|
SAUR-like auxin-responsive protein family |
| arTal_v1_Chr1_+_10308520_10308520 | 0.58 |
AT1G29465.1
|
AT1G29465
|
transmembrane protein |
| arTal_v1_Chr1_+_24257054_24257054 | 0.58 |
AT1G65310.2
|
XTH17
|
xyloglucan endotransglucosylase/hydrolase 17 |
| arTal_v1_Chr3_+_4371441_4371441 | 0.58 |
AT3G13432.1
|
AT3G13432
|
transmembrane protein |
| arTal_v1_Chr5_+_17734706_17734708 | 0.57 |
AT5G44070.1
AT5G44070.2 |
CAD1
|
phytochelatin synthase 1 (PCS1) |
| arTal_v1_Chr5_+_21943983_21943983 | 0.57 |
AT5G54070.1
|
HSFA9
|
heat shock transcription factor A9 |
| arTal_v1_Chr4_+_12137995_12138137 | 0.57 |
AT4G23180.1
AT4G23180.3 AT4G23180.2 |
CRK10
|
cysteine-rich RLK (RECEPTOR-like protein kinase) 10 |
| arTal_v1_Chr5_-_7366799_7366799 | 0.56 |
AT5G22250.1
|
CAF1b
|
Polynucleotidyl transferase, ribonuclease H-like superfamily protein |
| arTal_v1_Chr5_+_9683988_9683988 | 0.56 |
AT5G27420.1
|
CNI1
|
carbon/nitrogen insensitive 1 |
| arTal_v1_Chr1_+_24257216_24257216 | 0.56 |
AT1G65310.1
|
XTH17
|
xyloglucan endotransglucosylase/hydrolase 17 |
| arTal_v1_Chr4_-_11519805_11519805 | 0.56 |
AT4G21680.1
|
NRT1.8
|
NITRATE TRANSPORTER 1.8 |
| arTal_v1_Chr4_-_11896480_11896480 | 0.56 |
AT4G22590.1
|
TPPG
|
Haloacid dehalogenase-like hydrolase (HAD) superfamily protein |
| arTal_v1_Chr4_-_10391298_10391298 | 0.55 |
AT4G18970.1
|
AT4G18970
|
GDSL-like Lipase/Acylhydrolase superfamily protein |
| arTal_v1_Chr5_+_9050660_9050660 | 0.55 |
AT5G25930.1
|
AT5G25930
|
kinase family with leucine-rich repeat domain-containing protein |
| arTal_v1_Chr4_-_10390991_10390991 | 0.55 |
AT4G18970.2
|
AT4G18970
|
GDSL-like Lipase/Acylhydrolase superfamily protein |
| arTal_v1_Chr2_-_108231_108231 | 0.55 |
AT2G01180.6
|
PAP1
|
phosphatidic acid phosphatase 1 |
| arTal_v1_Chr5_+_3206140_3206140 | 0.54 |
AT5G10210.1
|
AT5G10210
|
nitric oxide synthase-interacting protein |
| arTal_v1_Chr5_+_17329275_17329275 | 0.54 |
AT5G43160.2
AT5G43160.1 |
QWRF9
|
QWRF motif protein (DUF566) |
| arTal_v1_Chr3_-_6000447_6000447 | 0.54 |
AT3G17520.1
|
AT3G17520
|
Late embryogenesis abundant protein (LEA) family protein |
| arTal_v1_Chr1_-_24033600_24033674 | 0.53 |
AT1G64670.1
AT1G64670.3 AT1G64670.2 |
BDG1
|
alpha/beta-Hydrolases superfamily protein |
| arTal_v1_Chr5_-_216773_216773 | 0.53 |
AT5G01550.1
|
LECRKA4.2
|
lectin receptor kinase a4.1 |
| arTal_v1_Chr4_-_8753157_8753297 | 0.53 |
AT4G15330.2
AT4G15330.1 |
CYP705A1
|
cytochrome P450, family 705, subfamily A, polypeptide 1 |
| arTal_v1_Chr4_-_6443554_6443554 | 0.53 |
AT4G10390.1
|
AT4G10390
|
Protein kinase superfamily protein |
| arTal_v1_Chr4_+_8984787_8984787 | 0.52 |
AT4G15800.1
|
RALFL33
|
ralf-like 33 |
| arTal_v1_Chr3_+_2209405_2209405 | 0.52 |
AT3G07000.1
|
AT3G07000
|
Cysteine/Histidine-rich C1 domain family protein |
| arTal_v1_Chr1_+_10300631_10300631 | 0.52 |
AT1G29418.1
|
AT1G29418
|
transmembrane protein |
| arTal_v1_Chr5_+_25033471_25033471 | 0.52 |
AT5G62340.1
|
AT5G62340
|
Plant invertase/pectin methylesterase inhibitor superfamily protein |
| arTal_v1_Chr4_+_12660687_12660687 | 0.52 |
AT4G24510.1
|
CER2
|
HXXXD-type acyl-transferase family protein |
| arTal_v1_Chr5_+_280674_280674 | 0.51 |
AT5G01740.1
|
AT5G01740
|
Nuclear transport factor 2 (NTF2) family protein |
| arTal_v1_Chr4_-_947075_947085 | 0.51 |
AT4G02130.2
AT4G02130.3 |
GATL6
|
galacturonosyltransferase 6 |
| arTal_v1_Chr3_-_1758807_1758807 | 0.50 |
AT3G05890.1
|
RCI2B
|
Low temperature and salt responsive protein family |
| arTal_v1_Chr4_-_14958080_14958080 | 0.50 |
AT4G30670.1
|
AT4G30670
|
Putative membrane lipoprotein |
| arTal_v1_Chr4_-_16740601_16740601 | 0.50 |
AT4G35180.2
AT4G35180.1 |
LHT7
|
LYS/HIS transporter 7 |
| arTal_v1_Chr2_-_16792622_16792622 | 0.50 |
AT2G40205.1
|
AT2G40205
|
Ribosomal protein L41 family |
| arTal_v1_Chr2_-_16346769_16346769 | 0.50 |
AT2G39180.1
|
CCR2
|
CRINKLY4 related 2 |
| arTal_v1_Chr3_+_5556710_5556710 | 0.49 |
AT3G16370.1
|
AT3G16370
|
GDSL-like Lipase/Acylhydrolase superfamily protein |
| arTal_v1_Chr4_+_16491692_16491692 | 0.49 |
AT4G34510.1
|
KCS17
|
3-ketoacyl-CoA synthase 17 |
| arTal_v1_Chr5_+_17451488_17451488 | 0.49 |
AT5G43420.1
|
AT5G43420
|
RING/U-box superfamily protein |
| arTal_v1_Chr1_+_5602786_5602786 | 0.48 |
AT1G16390.1
|
OCT3
|
organic cation/carnitine transporter 3 |
| arTal_v1_Chr3_-_3059148_3059244 | 0.48 |
AT3G09940.2
AT3G09940.1 |
MDHAR
|
monodehydroascorbate reductase |
| arTal_v1_Chr2_-_8533779_8533779 | 0.48 |
AT2G19800.1
|
MIOX2
|
myo-inositol oxygenase 2 |
| arTal_v1_Chr1_+_6089460_6089460 | 0.48 |
AT1G17700.1
|
PRA1.F1
|
prenylated RAB acceptor 1.F1 |
| arTal_v1_Chr3_+_1982659_1982659 | 0.47 |
AT3G06460.1
|
AT3G06460
|
GNS1/SUR4 membrane protein family |
| arTal_v1_Chr5_-_24859272_24859341 | 0.47 |
AT5G61900.3
AT5G61900.1 |
BON1
|
Calcium-dependent phospholipid-binding Copine family protein |
| arTal_v1_Chr5_+_2680401_2680401 | 0.47 |
AT5G08330.1
|
TCP11
|
TCP family transcription factor |
| arTal_v1_Chr5_+_23400715_23400715 | 0.47 |
AT5G57760.1
|
AT5G57760
|
hypothetical protein |
| arTal_v1_Chr5_+_25322975_25322975 | 0.47 |
AT5G63130.2
AT5G63130.1 |
AT5G63130
|
Octicosapeptide/Phox/Bem1p family protein |
| arTal_v1_Chr3_+_20296130_20296130 | 0.47 |
AT3G54810.2
|
BME3
|
Plant-specific GATA-type zinc finger transcription factor family protein |
| arTal_v1_Chr3_+_20296416_20296416 | 0.47 |
AT3G54810.1
|
BME3
|
Plant-specific GATA-type zinc finger transcription factor family protein |
| arTal_v1_Chr3_-_21087710_21087710 | 0.46 |
AT3G56980.1
|
bHLH39
|
basic helix-loop-helix (bHLH) DNA-binding superfamily protein |
| arTal_v1_Chr4_-_7353117_7353135 | 0.46 |
AT4G12420.1
AT4G12420.2 |
SKU5
|
Cupredoxin superfamily protein |
| arTal_v1_Chr3_+_20005616_20005616 | 0.46 |
AT3G54020.1
|
AtIPCS1
|
Inositol phosphorylceramide synthase 1 |
| arTal_v1_Chr4_-_947249_947249 | 0.46 |
AT4G02130.1
|
GATL6
|
galacturonosyltransferase 6 |
| arTal_v1_Chr3_-_20418910_20418910 | 0.46 |
AT3G55090.1
|
ABCG16
|
ABC-2 type transporter family protein |
| arTal_v1_Chr3_+_18929526_18929526 | 0.46 |
AT3G50930.1
|
BCS1
|
cytochrome BC1 synthesi |
| arTal_v1_Chr3_+_6045002_6045002 | 0.46 |
AT3G17690.3
AT3G17690.2 AT3G17690.1 |
CNGC19
|
cyclic nucleotide gated channel 19 |
| arTal_v1_Chr3_-_3003454_3003454 | 0.46 |
AT3G09780.1
|
CCR1
|
CRINKLY4 related 1 |
| arTal_v1_Chr3_-_10231567_10231567 | 0.46 |
AT3G27630.1
|
AT3G27630
|
cyclin-dependent kinase inhibitor SMR3-like protein |
| arTal_v1_Chr3_-_7286442_7286442 | 0.46 |
AT3G20830.1
|
UCNL
|
AGC (cAMP-dependent, cGMP-dependent and protein kinase C) kinase family protein |
| arTal_v1_Chr1_+_19140130_19140130 | 0.45 |
AT1G51620.2
AT1G51620.1 |
AT1G51620
|
Protein kinase superfamily protein |
| arTal_v1_Chr4_+_12249033_12249071 | 0.45 |
AT4G23470.2
AT4G23470.3 AT4G23470.4 |
AT4G23470
|
PLAC8 family protein |
| arTal_v1_Chr1_+_10371675_10371675 | 0.45 |
AT1G29660.1
|
AT1G29660
|
GDSL-like Lipase/Acylhydrolase superfamily protein |
| arTal_v1_Chr1_+_26852406_26852456 | 0.45 |
AT1G71230.1
AT1G71230.2 |
CSN5B
|
COP9-signalosome 5B |
| arTal_v1_Chr2_+_11852078_11852080 | 0.45 |
AT2G27810.1
AT2G27810.3 AT2G27810.2 AT2G27810.4 |
NAT12
|
nucleobase-ascorbate transporter 12 |
| arTal_v1_Chr1_-_19649340_19649340 | 0.44 |
AT1G52750.1
|
AT1G52750
|
alpha/beta-Hydrolases superfamily protein |
| arTal_v1_Chr1_+_29373803_29373889 | 0.44 |
AT1G78090.1
AT1G78090.2 |
TPPB
|
trehalose-6-phosphate phosphatase |
| arTal_v1_Chr2_-_11527854_11527854 | 0.44 |
AT2G27010.1
|
CYP705A9
|
cytochrome P450, family 705, subfamily A, polypeptide 9 |
| arTal_v1_Chr3_-_19658124_19658124 | 0.44 |
AT3G53010.1
|
AT3G53010
|
carbohydrate esterase, putative (DUF303) |
| arTal_v1_Chr1_+_11928757_11928757 | 0.44 |
AT1G32920.1
|
AT1G32920
|
hypothetical protein |
| arTal_v1_Chr2_-_12702443_12702443 | 0.43 |
AT2G29720.1
|
CTF2B
|
FAD/NAD(P)-binding oxidoreductase family protein |
| arTal_v1_Chr5_+_22594617_22594617 | 0.43 |
AT5G55830.1
|
AT5G55830
|
Concanavalin A-like lectin protein kinase family protein |
| arTal_v1_Chr5_+_463073_463073 | 0.43 |
AT5G02260.1
|
EXPA9
|
expansin A9 |
| arTal_v1_Chr3_+_5264001_5264001 | 0.43 |
AT3G15540.1
|
IAA19
|
indole-3-acetic acid inducible 19 |
| arTal_v1_Chr4_-_12551331_12551378 | 0.43 |
AT4G24180.4
AT4G24180.5 AT4G24180.2 AT4G24180.3 AT4G24180.1 AT4G24180.6 |
TLP1
|
THAUMATIN-LIKE PROTEIN 1 |
| arTal_v1_Chr2_+_13916440_13916440 | 0.43 |
AT2G32800.1
|
AP4.3A
|
protein kinase family protein |
| arTal_v1_Chr1_-_24023424_24023424 | 0.43 |
AT1G64640.1
|
ENODL8
|
early nodulin-like protein 8 |
| arTal_v1_Chr4_+_15230008_15230008 | 0.43 |
AT4G31380.1
|
FLP1
|
flowering-promoting factor-like protein |
| arTal_v1_Chr5_-_20552670_20552670 | 0.43 |
AT5G50460.1
|
AT5G50460
|
secE/sec61-gamma protein transport protein |
| arTal_v1_Chr5_-_20959409_20959409 | 0.43 |
AT5G51590.1
|
AT5G51590
|
AT hook motif DNA-binding family protein |
| arTal_v1_Chr3_-_2491180_2491180 | 0.43 |
AT3G07800.1
|
TK1a
|
Thymidine kinase |
| arTal_v1_Chr3_+_8581890_8581890 | 0.42 |
AT3G23800.2
|
SBP3
|
selenium-binding protein 3 |
| arTal_v1_Chr4_-_14439723_14439769 | 0.42 |
AT4G29310.1
AT4G29310.2 |
AT4G29310
|
DUF1005 family protein (DUF1005) |
| arTal_v1_Chr1_+_729830_729830 | 0.42 |
AT1G03070.1
AT1G03070.3 AT1G03070.2 |
AT1G03070
|
Bax inhibitor-1 family protein |
| arTal_v1_Chr3_+_6127001_6127041 | 0.42 |
AT3G17890.1
AT3G17890.2 AT3G17890.3 |
AT3G17890
|
hypothetical protein |
| arTal_v1_Chr2_+_11247160_11247160 | 0.42 |
AT2G26440.1
|
AT2G26440
|
Plant invertase/pectin methylesterase inhibitor superfamily |
| arTal_v1_Chr1_+_25132498_25132574 | 0.42 |
AT1G67190.2
AT1G67190.1 |
AT1G67190
|
F-box/RNI-like superfamily protein |
| arTal_v1_Chr3_-_8064649_8064649 | 0.42 |
AT3G22800.1
|
AT3G22800
|
Leucine-rich repeat (LRR) family protein |
| arTal_v1_Chr1_+_27127170_27127170 | 0.42 |
AT1G72100.1
|
AT1G72100
|
late embryogenesis abundant domain-containing protein / LEA domain-containing protein |
| arTal_v1_Chr5_-_6842946_6842946 | 0.42 |
AT5G20270.1
|
HHP1
|
heptahelical transmembrane protein1 |
| arTal_v1_Chr1_+_12261165_12261165 | 0.42 |
AT1G33800.1
|
GXMT1
|
glucuronoxylan 4-O-methyltransferase-like protein (DUF579) |
| arTal_v1_Chr5_-_23175476_23175495 | 0.42 |
AT5G57190.1
AT5G57190.2 |
PSD2
|
phosphatidylserine decarboxylase 2 |
| arTal_v1_Chr1_+_12188678_12188678 | 0.41 |
AT1G33610.1
|
AT1G33610
|
Leucine-rich repeat (LRR) family protein |
| arTal_v1_Chr5_-_5966785_5966785 | 0.41 |
AT5G18020.1
|
SAUR20
|
SAUR-like auxin-responsive protein family |
| arTal_v1_Chr1_-_6496491_6496491 | 0.41 |
AT1G18835.1
|
MIF3
|
mini zinc finger |
| arTal_v1_Chr4_-_12062757_12062858 | 0.41 |
AT4G23010.2
AT4G23010.1 AT4G23010.3 |
UTR2
|
UDP-galactose transporter 2 |
| arTal_v1_Chr2_+_18253610_18253610 | 0.41 |
AT2G44130.1
|
AT2G44130
|
Galactose oxidase/kelch repeat superfamily protein |
| arTal_v1_Chr3_+_4642657_4642657 | 0.41 |
AT3G14020.2
|
NF-YA6
|
nuclear factor Y, subunit A6 |
| arTal_v1_Chr4_+_7924135_7924135 | 0.41 |
AT4G13615.1
|
AT4G13615
|
Uncharacterized protein family SERF |
| arTal_v1_Chr4_+_12248842_12248842 | 0.41 |
AT4G23470.1
|
AT4G23470
|
PLAC8 family protein |
| arTal_v1_Chr5_+_24252138_24252138 | 0.40 |
AT5G60250.1
|
AT5G60250
|
zinc finger (C3HC4-type RING finger) family protein |
| arTal_v1_Chr5_+_18559060_18559060 | 0.40 |
AT5G45750.1
|
RABA1c
|
RAB GTPase homolog A1C |
| arTal_v1_Chr2_-_16563441_16563441 | 0.40 |
AT2G39710.1
|
AT2G39710
|
Eukaryotic aspartyl protease family protein |
| arTal_v1_Chr1_-_16657686_16657686 | 0.40 |
AT1G43910.1
|
AT1G43910
|
P-loop containing nucleoside triphosphate hydrolases superfamily protein |
| arTal_v1_Chr2_+_10662190_10662190 | 0.40 |
AT2G25060.1
|
ENODL14
|
early nodulin-like protein 14 |
| arTal_v1_Chr2_-_18914739_18914739 | 0.40 |
AT2G45970.1
|
CYP86A8
|
cytochrome P450, family 86, subfamily A, polypeptide 8 |
| arTal_v1_Chr5_-_26970668_26970668 | 0.40 |
AT5G67640.1
|
AT5G67640
|
hypothetical protein |
| arTal_v1_Chr2_-_13684248_13684248 | 0.39 |
AT2G32235.2
AT2G32235.1 |
AT2G32235
|
hypothetical protein |
| arTal_v1_Chr5_+_2206000_2206000 | 0.39 |
AT5G07110.1
|
PRA1.B6
|
prenylated RAB acceptor 1.B6 |
| arTal_v1_Chr2_+_1676999_1676999 | 0.39 |
AT2G04780.2
|
FLA7
|
FASCICLIN-like arabinoogalactan 7 |
| arTal_v1_Chr4_-_5325363_5325374 | 0.39 |
AT4G08400.3
AT4G08400.1 AT4G08400.2 |
AT4G08400
|
Proline-rich extensin-like family protein |
| arTal_v1_Chr3_+_2206387_2206387 | 0.39 |
AT3G06990.1
|
AT3G06990
|
Cysteine/Histidine-rich C1 domain family protein |
| arTal_v1_Chr5_-_22358381_22358413 | 0.39 |
AT5G55090.1
AT5G55090.2 |
MAPKKK15
|
mitogen-activated protein kinase kinase kinase 15 |
| arTal_v1_Chr2_+_1676717_1676717 | 0.39 |
AT2G04780.1
|
FLA7
|
FASCICLIN-like arabinoogalactan 7 |
| arTal_v1_Chr5_+_9275893_9275947 | 0.39 |
AT5G26667.2
AT5G26667.1 AT5G26667.4 AT5G26667.3 |
PYR6
|
P-loop containing nucleoside triphosphate hydrolases superfamily protein |
| arTal_v1_Chr3_-_19731519_19731519 | 0.39 |
AT3G53232.1
|
RTFL1
|
ROTUNDIFOLIA like 1 |
| arTal_v1_Chr3_-_4620305_4620305 | 0.39 |
AT3G13980.1
|
AT3G13980
|
SKI/DACH domain protein |
| arTal_v1_Chr3_-_20756690_20756690 | 0.39 |
AT3G55950.1
|
CCR3
|
CRINKLY4 related 3 |
| arTal_v1_Chr3_+_8581446_8581446 | 0.39 |
AT3G23800.1
|
SBP3
|
selenium-binding protein 3 |
| arTal_v1_Chr3_+_3189918_3190001 | 0.38 |
AT3G10310.2
AT3G10310.1 |
AT3G10310
|
P-loop nucleoside triphosphate hydrolases superfamily protein with CH (Calponin Homology) domain-containing protein |
| arTal_v1_Chr1_-_28823727_28823727 | 0.38 |
AT1G76790.1
|
IGMT5
|
O-methyltransferase family protein |
| arTal_v1_Chr1_-_4882265_4882265 | 0.38 |
AT1G14290.1
|
SBH2
|
sphingoid base hydroxylase 2 |
| arTal_v1_Chr5_+_25233881_25233881 | 0.38 |
AT5G62865.1
|
AT5G62865
|
hypothetical protein |
| arTal_v1_Chr2_+_16531527_16531527 | 0.38 |
AT2G39660.1
|
BIK1
|
botrytis-induced kinase1 |
| arTal_v1_Chr1_-_4882003_4882003 | 0.38 |
AT1G14290.2
|
SBH2
|
sphingoid base hydroxylase 2 |
| arTal_v1_Chr5_+_16733663_16733663 | 0.38 |
AT5G41800.1
|
AT5G41800
|
Transmembrane amino acid transporter family protein |
| arTal_v1_Chr3_-_9710100_9710100 | 0.38 |
AT3G26500.1
|
PIRL2
|
plant intracellular ras group-related LRR 2 |
| arTal_v1_Chr5_+_18875382_18875382 | 0.38 |
AT5G46530.1
|
AT5G46530
|
AWPM-19-like family protein |
| arTal_v1_Chr3_+_16163709_16163850 | 0.37 |
AT3G44590.1
AT3G44590.2 |
AT3G44590
|
60S acidic ribosomal protein family |
| arTal_v1_Chr1_+_27054030_27054030 | 0.37 |
AT1G71880.1
|
SUC1
|
sucrose-proton symporter 1 |
| arTal_v1_Chr1_+_27283628_27283628 | 0.37 |
AT1G72470.1
|
EXO70D1
|
exocyst subunit exo70 family protein D1 |
| arTal_v1_Chr5_+_26671273_26671273 | 0.37 |
AT5G66800.1
|
AT5G66800
|
membrane-associated kinase regulator-like protein |
| arTal_v1_Chr5_+_2931963_2931963 | 0.37 |
AT5G09430.1
|
AT5G09430
|
alpha/beta-Hydrolases superfamily protein |
| arTal_v1_Chr3_-_4794417_4794417 | 0.37 |
AT3G14362.1
|
RTFL10
|
ROTUNDIFOLIA like 10 |
| arTal_v1_Chr1_+_23911024_23911024 | 0.37 |
AT1G64390.1
|
GH9C2
|
glycosyl hydrolase 9C2 |
| arTal_v1_Chr2_-_10137595_10137595 | 0.37 |
AT2G23810.1
|
TET8
|
tetraspanin8 |
| arTal_v1_Chr4_-_12339967_12339967 | 0.36 |
AT4G23690.1
|
DIR6
|
Disease resistance-responsive (dirigent-like protein) family protein |
| arTal_v1_Chr1_-_5783840_5783840 | 0.36 |
AT1G16905.1
|
AT1G16905
|
Curculin-like (mannose-binding) lectin family protein |
| arTal_v1_Chr3_+_21893812_21893812 | 0.36 |
AT3G59220.1
|
PRN
|
pirin |
| arTal_v1_Chr4_-_13910995_13910995 | 0.36 |
AT4G27950.1
|
CRF4
|
cytokinin response factor 4 |
| arTal_v1_Chr1_-_4361371_4361371 | 0.36 |
AT1G12790.1
|
AT1G12790
|
DNA ligase-like protein |
| arTal_v1_Chr1_-_9715176_9715176 | 0.36 |
AT1G27890.1
|
AT1G27890
|
Polynucleotidyl transferase, ribonuclease H-like superfamily protein |
| arTal_v1_Chr3_+_1440014_1440126 | 0.36 |
AT3G05150.1
AT3G05150.2 AT3G05150.3 |
AT3G05150
|
Major facilitator superfamily protein |
| arTal_v1_Chr4_-_13836661_13836661 | 0.36 |
AT4G27730.1
|
OPT6
|
oligopeptide transporter 1 |
| arTal_v1_Chr3_+_19772930_19772930 | 0.35 |
AT3G53330.1
|
AT3G53330
|
plastocyanin-like domain-containing protein |
| arTal_v1_Chr1_+_26909792_26909792 | 0.35 |
AT1G71400.1
|
RLP12
|
receptor like protein 12 |
| arTal_v1_Chr4_+_18478890_18478929 | 0.35 |
AT4G39830.3
AT4G39830.1 AT4G39830.2 AT4G39830.4 |
AT4G39830
|
Cupredoxin superfamily protein |
| arTal_v1_Chr3_-_3548877_3548877 | 0.35 |
AT3G11320.1
|
AT3G11320
|
Nucleotide-sugar transporter family protein |
| arTal_v1_Chr1_-_2945976_2945976 | 0.35 |
AT1G09140.3
AT1G09140.2 AT1G09140.1 |
SR30
|
SERINE-ARGININE PROTEIN 30 |
| arTal_v1_Chr5_-_23287739_23287739 | 0.35 |
AT5G57500.1
|
AT5G57500
|
Galactosyltransferase family protein |
| arTal_v1_Chr1_-_28551836_28551836 | 0.35 |
AT1G76090.1
|
SMT3
|
sterol methyltransferase 3 |
| arTal_v1_Chr1_+_16933699_16933699 | 0.35 |
AT1G44830.1
|
AT1G44830
|
Integrase-type DNA-binding superfamily protein |
| arTal_v1_Chr2_-_10745594_10745819 | 0.35 |
AT2G25220.2
AT2G25220.6 AT2G25220.3 AT2G25220.1 |
AT2G25220
|
Protein kinase superfamily protein |
| arTal_v1_Chr2_+_1063943_1064050 | 0.35 |
AT2G03505.1
AT2G03505.2 AT2G03505.3 AT2G03505.4 |
AT2G03505
|
Carbohydrate-binding X8 domain superfamily protein |
| arTal_v1_Chr3_+_7021263_7021263 | 0.35 |
AT3G20110.1
|
CYP705A20
|
cytochrome P450, family 705, subfamily A, polypeptide 20 |
| arTal_v1_Chr2_-_10122479_10122479 | 0.35 |
AT2G23770.1
|
LYK4
|
protein kinase family protein / peptidoglycan-binding LysM domain-containing protein |
| arTal_v1_Chr1_-_5016604_5016708 | 0.35 |
AT1G14620.2
AT1G14620.1 |
DECOY
|
decoy |
| arTal_v1_Chr3_-_1515566_1515568 | 0.35 |
AT3G05320.2
AT3G05320.3 |
AT3G05320
|
O-fucosyltransferase family protein |
| arTal_v1_Chr3_+_2612175_2612175 | 0.35 |
AT3G08600.1
|
AT3G08600
|
transmembrane protein, putative (DUF1191) |
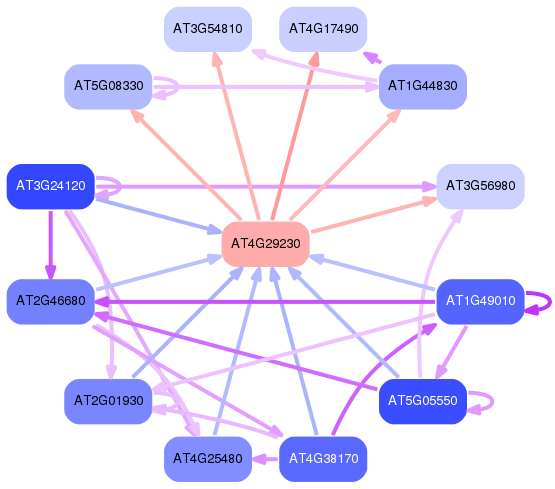
Network of associatons between targets according to the STRING database.

First level regulatory network of AT4G29230
Gene Ontology Analysis
Gene overrepresentation in biological process category:
| Log-likelihood per target | Total log-likelihood | Term | Description |
|---|---|---|---|
| 0.3 | 1.9 | GO:0010581 | regulation of starch biosynthetic process(GO:0010581) |
| 0.2 | 0.6 | GO:0033528 | S-methylmethionine metabolic process(GO:0033477) S-methylmethionine cycle(GO:0033528) |
| 0.2 | 0.8 | GO:0015854 | adenine transport(GO:0015853) guanine transport(GO:0015854) |
| 0.2 | 1.2 | GO:0000289 | nuclear-transcribed mRNA poly(A) tail shortening(GO:0000289) |
| 0.2 | 0.5 | GO:0010501 | RNA secondary structure unwinding(GO:0010501) |
| 0.2 | 1.0 | GO:0009759 | indole glucosinolate biosynthetic process(GO:0009759) |
| 0.1 | 0.7 | GO:0042218 | 1-aminocyclopropane-1-carboxylate biosynthetic process(GO:0042218) |
| 0.1 | 0.4 | GO:0046705 | CDP metabolic process(GO:0046704) CDP biosynthetic process(GO:0046705) |
| 0.1 | 0.4 | GO:0010520 | regulation of reciprocal meiotic recombination(GO:0010520) |
| 0.1 | 0.5 | GO:0010185 | regulation of cellular defense response(GO:0010185) |
| 0.1 | 0.3 | GO:0051973 | positive regulation of telomerase activity(GO:0051973) |
| 0.1 | 0.3 | GO:0071158 | negative regulation of fatty acid biosynthetic process(GO:0045717) regulation of cell cycle arrest(GO:0071156) positive regulation of cell cycle arrest(GO:0071158) |
| 0.1 | 0.6 | GO:0071276 | phytochelatin metabolic process(GO:0046937) phytochelatin biosynthetic process(GO:0046938) cellular response to cadmium ion(GO:0071276) cellular detoxification of cadmium ion(GO:0098849) |
| 0.1 | 0.4 | GO:1902751 | positive regulation of G2/M transition of mitotic cell cycle(GO:0010971) positive regulation of cell cycle G2/M phase transition(GO:1902751) regulation of L-ascorbic acid biosynthetic process(GO:2000082) |
| 0.1 | 0.4 | GO:0046440 | lysine catabolic process(GO:0006554) L-lysine catabolic process to acetyl-CoA(GO:0019474) L-lysine catabolic process(GO:0019477) L-lysine catabolic process to acetyl-CoA via saccharopine(GO:0033512) L-lysine metabolic process(GO:0046440) |
| 0.1 | 1.0 | GO:0031542 | positive regulation of anthocyanin biosynthetic process(GO:0031542) |
| 0.1 | 0.5 | GO:0046622 | positive regulation of organ growth(GO:0046622) |
| 0.1 | 1.6 | GO:0030497 | fatty acid elongation(GO:0030497) |
| 0.1 | 0.4 | GO:0048462 | carpel formation(GO:0048462) |
| 0.1 | 0.5 | GO:0071323 | cellular response to chitin(GO:0071323) |
| 0.1 | 0.3 | GO:0045901 | positive regulation of translational elongation(GO:0045901) positive regulation of translational termination(GO:0045905) |
| 0.1 | 0.5 | GO:0019310 | inositol catabolic process(GO:0019310) |
| 0.1 | 0.5 | GO:0045730 | respiratory burst involved in defense response(GO:0002679) respiratory burst(GO:0045730) |
| 0.1 | 0.5 | GO:0010148 | transpiration(GO:0010148) |
| 0.1 | 0.9 | GO:0022610 | cell adhesion(GO:0007155) biological adhesion(GO:0022610) |
| 0.1 | 0.3 | GO:1901529 | positive regulation of transporter activity(GO:0032411) positive regulation of ion transmembrane transporter activity(GO:0032414) cellular response to absence of light(GO:0071485) positive regulation of anion channel activity(GO:1901529) positive regulation of anion transport(GO:1903793) positive regulation of anion transmembrane transport(GO:1903961) |
| 0.1 | 0.3 | GO:0031297 | DNA recombinase assembly(GO:0000730) replication fork processing(GO:0031297) strand invasion(GO:0042148) |
| 0.1 | 5.2 | GO:0010411 | xyloglucan metabolic process(GO:0010411) |
| 0.1 | 2.5 | GO:0005992 | trehalose biosynthetic process(GO:0005992) |
| 0.1 | 0.3 | GO:0090309 | regulation of methylation-dependent chromatin silencing(GO:0090308) positive regulation of methylation-dependent chromatin silencing(GO:0090309) |
| 0.1 | 0.4 | GO:0009807 | lignan metabolic process(GO:0009806) lignan biosynthetic process(GO:0009807) |
| 0.1 | 0.3 | GO:0009305 | protein biotinylation(GO:0009305) |
| 0.1 | 0.3 | GO:0009660 | amyloplast organization(GO:0009660) |
| 0.1 | 0.4 | GO:0015785 | UDP-galactose transport(GO:0015785) UDP-galactose transmembrane transport(GO:0072334) |
| 0.1 | 0.5 | GO:0034219 | carbohydrate transmembrane transport(GO:0034219) |
| 0.1 | 0.3 | GO:0009304 | tRNA transcription(GO:0009304) |
| 0.1 | 0.3 | GO:0070525 | tRNA threonylcarbamoyladenosine metabolic process(GO:0070525) |
| 0.1 | 0.3 | GO:0046475 | glycerophospholipid catabolic process(GO:0046475) |
| 0.1 | 0.2 | GO:1902289 | negative regulation of defense response to oomycetes(GO:1902289) |
| 0.1 | 0.3 | GO:0045005 | DNA-dependent DNA replication maintenance of fidelity(GO:0045005) |
| 0.1 | 0.3 | GO:0070509 | calcium ion import(GO:0070509) |
| 0.1 | 0.3 | GO:0048656 | anther wall tapetum formation(GO:0048656) anther wall tapetum cell differentiation(GO:0048657) |
| 0.1 | 0.3 | GO:0000080 | mitotic G1 phase(GO:0000080) mitotic S phase(GO:0000084) mitotic G2 phase(GO:0000085) G1 phase(GO:0051318) G2 phase(GO:0051319) S phase(GO:0051320) interphase(GO:0051325) mitotic interphase(GO:0051329) |
| 0.1 | 0.6 | GO:0009961 | response to 1-aminocyclopropane-1-carboxylic acid(GO:0009961) |
| 0.1 | 0.7 | GO:0046520 | sphingoid biosynthetic process(GO:0046520) |
| 0.1 | 0.2 | GO:0042759 | long-chain fatty acid biosynthetic process(GO:0042759) |
| 0.1 | 0.2 | GO:0070193 | synaptonemal complex assembly(GO:0007130) synaptonemal complex organization(GO:0070193) |
| 0.1 | 0.8 | GO:0010262 | somatic embryogenesis(GO:0010262) |
| 0.1 | 0.3 | GO:0009769 | photosynthesis, light harvesting in photosystem II(GO:0009769) |
| 0.1 | 0.6 | GO:0046513 | ceramide biosynthetic process(GO:0046513) |
| 0.1 | 0.2 | GO:0006409 | tRNA export from nucleus(GO:0006409) tRNA transport(GO:0051031) tRNA-containing ribonucleoprotein complex export from nucleus(GO:0071431) |
| 0.1 | 0.4 | GO:0016045 | detection of bacterium(GO:0016045) |
| 0.1 | 0.5 | GO:0010106 | cellular response to iron ion starvation(GO:0010106) |
| 0.1 | 0.2 | GO:0090603 | sieve element differentiation(GO:0090603) |
| 0.1 | 0.3 | GO:0071108 | protein K48-linked deubiquitination(GO:0071108) |
| 0.1 | 0.2 | GO:0010495 | long-distance posttranscriptional gene silencing(GO:0010495) |
| 0.1 | 1.4 | GO:0007264 | small GTPase mediated signal transduction(GO:0007264) |
| 0.0 | 0.2 | GO:0080029 | cellular response to boron-containing substance levels(GO:0080029) |
| 0.0 | 0.5 | GO:0080086 | stamen filament development(GO:0080086) |
| 0.0 | 0.6 | GO:0010244 | response to low fluence blue light stimulus by blue low-fluence system(GO:0010244) |
| 0.0 | 0.1 | GO:0072502 | cellular phosphate ion homeostasis(GO:0030643) cellular trivalent inorganic anion homeostasis(GO:0072502) |
| 0.0 | 0.2 | GO:0046208 | spermine catabolic process(GO:0046208) |
| 0.0 | 0.2 | GO:0080094 | response to trehalose-6-phosphate(GO:0080094) |
| 0.0 | 0.3 | GO:0015837 | amine transport(GO:0015837) regulation of organic acid transport(GO:0032890) regulation of amine transport(GO:0051952) regulation of amino acid transport(GO:0051955) regulation of amino acid export(GO:0080143) |
| 0.0 | 0.3 | GO:0046125 | deoxyribonucleoside metabolic process(GO:0009120) thymidine metabolic process(GO:0046104) pyrimidine deoxyribonucleoside metabolic process(GO:0046125) |
| 0.0 | 0.2 | GO:0042344 | indole glucosinolate catabolic process(GO:0042344) |
| 0.0 | 0.2 | GO:0051016 | barbed-end actin filament capping(GO:0051016) |
| 0.0 | 0.2 | GO:0006556 | S-adenosylmethionine biosynthetic process(GO:0006556) |
| 0.0 | 1.7 | GO:0009828 | plant-type cell wall loosening(GO:0009828) |
| 0.0 | 0.5 | GO:0042761 | very long-chain fatty acid biosynthetic process(GO:0042761) |
| 0.0 | 0.7 | GO:0050829 | defense response to Gram-negative bacterium(GO:0050829) |
| 0.0 | 0.2 | GO:0010387 | COP9 signalosome assembly(GO:0010387) |
| 0.0 | 0.2 | GO:0045332 | phospholipid translocation(GO:0045332) |
| 0.0 | 0.5 | GO:0051365 | cellular response to potassium ion starvation(GO:0051365) |
| 0.0 | 0.2 | GO:0010424 | DNA methylation on cytosine within a CG sequence(GO:0010424) |
| 0.0 | 0.1 | GO:0046085 | inosine catabolic process(GO:0006148) adenosine metabolic process(GO:0046085) inosine metabolic process(GO:0046102) |
| 0.0 | 0.1 | GO:0042353 | fucose biosynthetic process(GO:0042353) |
| 0.0 | 0.1 | GO:0044259 | collagen metabolic process(GO:0032963) multicellular organism metabolic process(GO:0044236) multicellular organismal macromolecule metabolic process(GO:0044259) |
| 0.0 | 0.2 | GO:0009855 | determination of bilateral symmetry(GO:0009855) |
| 0.0 | 0.1 | GO:0080178 | 5-carbamoylmethyl uridine residue modification(GO:0080178) |
| 0.0 | 0.4 | GO:0016925 | protein sumoylation(GO:0016925) |
| 0.0 | 0.2 | GO:0006597 | spermine biosynthetic process(GO:0006597) |
| 0.0 | 0.4 | GO:0002221 | pattern recognition receptor signaling pathway(GO:0002221) |
| 0.0 | 0.5 | GO:0006857 | oligopeptide transport(GO:0006857) peptide transport(GO:0015833) |
| 0.0 | 1.5 | GO:0045489 | pectin biosynthetic process(GO:0045489) |
| 0.0 | 0.2 | GO:0033385 | geranylgeranyl diphosphate metabolic process(GO:0033385) geranylgeranyl diphosphate biosynthetic process(GO:0033386) |
| 0.0 | 0.7 | GO:1905177 | tracheary element differentiation(GO:1905177) |
| 0.0 | 0.1 | GO:0044380 | protein localization to cytoskeleton(GO:0044380) protein localization to microtubule cytoskeleton(GO:0072698) |
| 0.0 | 0.3 | GO:0006646 | phosphatidylethanolamine biosynthetic process(GO:0006646) phosphatidylethanolamine metabolic process(GO:0046337) |
| 0.0 | 0.4 | GO:0006384 | transcription initiation from RNA polymerase III promoter(GO:0006384) |
| 0.0 | 0.2 | GO:0015689 | molybdate ion transport(GO:0015689) |
| 0.0 | 0.2 | GO:0006123 | mitochondrial electron transport, cytochrome c to oxygen(GO:0006123) |
| 0.0 | 0.1 | GO:0035279 | leaf proximal/distal pattern formation(GO:0010589) mRNA cleavage involved in gene silencing by miRNA(GO:0035279) mRNA cleavage involved in gene silencing(GO:0098795) |
| 0.0 | 0.3 | GO:0016121 | carotene catabolic process(GO:0016121) terpene catabolic process(GO:0046247) |
| 0.0 | 0.5 | GO:0080027 | response to herbivore(GO:0080027) |
| 0.0 | 0.1 | GO:1901703 | protein localization involved in auxin polar transport(GO:1901703) |
| 0.0 | 0.2 | GO:0010929 | positive regulation of auxin mediated signaling pathway(GO:0010929) |
| 0.0 | 0.3 | GO:0045840 | positive regulation of mitotic nuclear division(GO:0045840) positive regulation of mitotic metaphase/anaphase transition(GO:0045842) positive regulation of mitotic sister chromatid separation(GO:1901970) positive regulation of metaphase/anaphase transition of cell cycle(GO:1902101) |
| 0.0 | 0.1 | GO:0019322 | pentose biosynthetic process(GO:0019322) arabinose biosynthetic process(GO:0019567) |
| 0.0 | 0.2 | GO:0048530 | fruit morphogenesis(GO:0048530) |
| 0.0 | 0.1 | GO:0080088 | spermidine hydroxycinnamate conjugate biosynthetic process(GO:0080088) |
| 0.0 | 0.4 | GO:0032544 | plastid translation(GO:0032544) |
| 0.0 | 0.2 | GO:0080151 | positive regulation of salicylic acid mediated signaling pathway(GO:0080151) |
| 0.0 | 0.0 | GO:0010618 | aerenchyma formation(GO:0010618) 1-aminocyclopropane-1-carboxylate metabolic process(GO:0018871) |
| 0.0 | 0.1 | GO:1905181 | regulation of urease activity(GO:1905181) positive regulation of urease activity(GO:1905182) |
| 0.0 | 0.3 | GO:1904668 | positive regulation of ubiquitin protein ligase activity(GO:1904668) |
| 0.0 | 0.2 | GO:2000068 | regulation of defense response to insect(GO:2000068) |
| 0.0 | 0.5 | GO:0009768 | photosynthesis, light harvesting in photosystem I(GO:0009768) |
| 0.0 | 0.2 | GO:0080148 | negative regulation of response to water deprivation(GO:0080148) |
| 0.0 | 0.1 | GO:0060321 | acceptance of pollen(GO:0060321) |
| 0.0 | 0.1 | GO:1902626 | assembly of large subunit precursor of preribosome(GO:1902626) |
| 0.0 | 0.6 | GO:1901800 | positive regulation of proteasomal ubiquitin-dependent protein catabolic process(GO:0032436) positive regulation of proteasomal protein catabolic process(GO:1901800) |
| 0.0 | 0.1 | GO:0051703 | synergid death(GO:0010198) pollen tube reception(GO:0010483) intraspecies interaction between organisms(GO:0051703) |
| 0.0 | 0.2 | GO:1900426 | positive regulation of defense response to bacterium(GO:1900426) |
| 0.0 | 0.2 | GO:0006665 | sphingolipid metabolic process(GO:0006665) |
| 0.0 | 0.1 | GO:0043406 | activation of MAPK activity(GO:0000187) positive regulation of MAP kinase activity(GO:0043406) |
| 0.0 | 0.1 | GO:0008216 | spermidine metabolic process(GO:0008216) |
| 0.0 | 0.1 | GO:0007112 | male meiosis cytokinesis(GO:0007112) |
| 0.0 | 0.1 | GO:0006207 | 'de novo' pyrimidine nucleobase biosynthetic process(GO:0006207) |
| 0.0 | 0.1 | GO:0051014 | actin filament severing(GO:0051014) |
| 0.0 | 0.1 | GO:0042144 | regulation of vacuole fusion, non-autophagic(GO:0032889) vacuole fusion, non-autophagic(GO:0042144) |
| 0.0 | 0.3 | GO:0010158 | abaxial cell fate specification(GO:0010158) |
| 0.0 | 0.5 | GO:0045493 | xylan catabolic process(GO:0045493) |
| 0.0 | 0.1 | GO:0034389 | lipid particle organization(GO:0034389) |
| 0.0 | 0.5 | GO:0045727 | positive regulation of translation(GO:0045727) |
| 0.0 | 1.6 | GO:0019722 | calcium-mediated signaling(GO:0019722) |
| 0.0 | 0.1 | GO:0015824 | proline transport(GO:0015824) |
| 0.0 | 0.1 | GO:0009263 | deoxyribonucleotide biosynthetic process(GO:0009263) |
| 0.0 | 0.1 | GO:0046051 | UTP biosynthetic process(GO:0006228) UTP metabolic process(GO:0046051) |
| 0.0 | 0.6 | GO:0046246 | terpene biosynthetic process(GO:0046246) |
| 0.0 | 0.7 | GO:0090329 | regulation of DNA-dependent DNA replication(GO:0090329) |
| 0.0 | 0.3 | GO:0048766 | root hair initiation(GO:0048766) |
| 0.0 | 0.1 | GO:0030148 | sphingolipid biosynthetic process(GO:0030148) |
| 0.0 | 0.1 | GO:0080110 | sporopollenin biosynthetic process(GO:0080110) |
| 0.0 | 0.5 | GO:0006817 | phosphate ion transport(GO:0006817) |
| 0.0 | 0.1 | GO:0060919 | auxin influx(GO:0060919) |
| 0.0 | 0.4 | GO:0007064 | mitotic sister chromatid cohesion(GO:0007064) |
| 0.0 | 0.3 | GO:0046685 | response to arsenic-containing substance(GO:0046685) |
| 0.0 | 0.2 | GO:0010600 | regulation of auxin biosynthetic process(GO:0010600) |
| 0.0 | 0.3 | GO:0071484 | cellular response to light intensity(GO:0071484) |
| 0.0 | 0.4 | GO:0010152 | pollen maturation(GO:0010152) |
| 0.0 | 0.5 | GO:0009693 | ethylene metabolic process(GO:0009692) ethylene biosynthetic process(GO:0009693) cellular alkene metabolic process(GO:0043449) alkene biosynthetic process(GO:0043450) olefin metabolic process(GO:1900673) olefin biosynthetic process(GO:1900674) |
| 0.0 | 0.1 | GO:0006428 | isoleucyl-tRNA aminoacylation(GO:0006428) |
| 0.0 | 0.2 | GO:0046466 | membrane lipid catabolic process(GO:0046466) |
| 0.0 | 0.4 | GO:0003333 | amino acid transmembrane transport(GO:0003333) |
| 0.0 | 0.1 | GO:0006655 | phosphatidylglycerol biosynthetic process(GO:0006655) |
| 0.0 | 0.7 | GO:0051225 | spindle assembly(GO:0051225) |
| 0.0 | 0.5 | GO:0048768 | root hair cell tip growth(GO:0048768) |
| 0.0 | 0.1 | GO:0010019 | chloroplast-nucleus signaling pathway(GO:0010019) |
| 0.0 | 0.3 | GO:2000008 | regulation of protein localization to cell surface(GO:2000008) |
| 0.0 | 0.2 | GO:0045732 | positive regulation of protein catabolic process(GO:0045732) |
| 0.0 | 2.1 | GO:0010200 | response to chitin(GO:0010200) |
| 0.0 | 0.2 | GO:0015976 | carbon utilization(GO:0015976) |
| 0.0 | 0.1 | GO:0000719 | photoreactive repair(GO:0000719) |
| 0.0 | 0.2 | GO:0010037 | response to carbon dioxide(GO:0010037) |
| 0.0 | 0.4 | GO:0045492 | xylan biosynthetic process(GO:0045492) |
| 0.0 | 0.8 | GO:0002239 | response to oomycetes(GO:0002239) |
| 0.0 | 0.1 | GO:0010065 | primary meristem tissue development(GO:0010065) |
| 0.0 | 0.4 | GO:0006378 | mRNA polyadenylation(GO:0006378) |
| 0.0 | 0.8 | GO:0006887 | exocytosis(GO:0006887) |
| 0.0 | 0.5 | GO:0000470 | maturation of LSU-rRNA(GO:0000470) |
| 0.0 | 0.1 | GO:0015691 | cadmium ion transport(GO:0015691) |
| 0.0 | 0.3 | GO:0010103 | stomatal complex morphogenesis(GO:0010103) |
| 0.0 | 0.3 | GO:0007009 | plasma membrane organization(GO:0007009) |
| 0.0 | 0.2 | GO:0016024 | CDP-diacylglycerol biosynthetic process(GO:0016024) CDP-diacylglycerol metabolic process(GO:0046341) |
| 0.0 | 0.0 | GO:0080171 | lytic vacuole organization(GO:0080171) |
| 0.0 | 0.2 | GO:0080163 | regulation of protein serine/threonine phosphatase activity(GO:0080163) |
| 0.0 | 0.3 | GO:0034314 | Arp2/3 complex-mediated actin nucleation(GO:0034314) |
| 0.0 | 0.0 | GO:0010541 | acropetal auxin transport(GO:0010541) |
| 0.0 | 0.1 | GO:0051571 | positive regulation of histone H3-K4 methylation(GO:0051571) |
| 0.0 | 0.3 | GO:0009846 | pollen germination(GO:0009846) |
| 0.0 | 0.0 | GO:2000653 | regulation of genetic imprinting(GO:2000653) |
| 0.0 | 0.2 | GO:0009098 | leucine biosynthetic process(GO:0009098) |
| 0.0 | 0.3 | GO:0043069 | negative regulation of programmed cell death(GO:0043069) |
| 0.0 | 0.2 | GO:0009299 | mRNA transcription(GO:0009299) |
| 0.0 | 0.3 | GO:0071577 | zinc II ion transmembrane transport(GO:0071577) |
| 0.0 | 0.0 | GO:0002698 | negative regulation of immune effector process(GO:0002698) negative regulation of defense response to virus(GO:0050687) |
| 0.0 | 0.3 | GO:0080092 | regulation of pollen tube growth(GO:0080092) |
| 0.0 | 0.2 | GO:0006826 | iron ion transport(GO:0006826) |
| 0.0 | 0.1 | GO:0055069 | zinc ion homeostasis(GO:0055069) |
| 0.0 | 0.6 | GO:0009788 | negative regulation of abscisic acid-activated signaling pathway(GO:0009788) |
| 0.0 | 0.2 | GO:0045787 | positive regulation of cell cycle(GO:0045787) |
| 0.0 | 0.1 | GO:0006307 | DNA dealkylation involved in DNA repair(GO:0006307) |
| 0.0 | 0.2 | GO:0006538 | glutamate catabolic process(GO:0006538) |
| 0.0 | 0.1 | GO:0006884 | cell volume homeostasis(GO:0006884) |
| 0.0 | 0.4 | GO:0000028 | ribosomal small subunit assembly(GO:0000028) |
| 0.0 | 0.2 | GO:0006814 | sodium ion transport(GO:0006814) |
| 0.0 | 0.2 | GO:0019432 | triglyceride biosynthetic process(GO:0019432) |
| 0.0 | 0.1 | GO:0006370 | 7-methylguanosine mRNA capping(GO:0006370) |
| 0.0 | 0.2 | GO:0002098 | tRNA wobble uridine modification(GO:0002098) |
| 0.0 | 0.3 | GO:0085029 | pollen wall assembly(GO:0010208) cellular component assembly involved in morphogenesis(GO:0010927) extracellular matrix assembly(GO:0085029) |
| 0.0 | 0.4 | GO:0009567 | fertilization(GO:0009566) double fertilization forming a zygote and endosperm(GO:0009567) |
| 0.0 | 0.7 | GO:0009809 | lignin biosynthetic process(GO:0009809) |
| 0.0 | 0.1 | GO:0043068 | positive regulation of programmed cell death(GO:0043068) |
| 0.0 | 1.3 | GO:0009932 | cell tip growth(GO:0009932) |
| 0.0 | 0.9 | GO:0045490 | pectin catabolic process(GO:0045490) |
| 0.0 | 0.0 | GO:0006435 | threonyl-tRNA aminoacylation(GO:0006435) |
| 0.0 | 0.5 | GO:0034050 | plant-type hypersensitive response(GO:0009626) host programmed cell death induced by symbiont(GO:0034050) |
| 0.0 | 0.1 | GO:0009662 | etioplast organization(GO:0009662) |
| 0.0 | 0.2 | GO:0050821 | protein stabilization(GO:0050821) |
| 0.0 | 0.0 | GO:0080093 | regulation of photorespiration(GO:0080093) |
Gene overrepresentation in cellular component category:
| Log-likelihood per target | Total log-likelihood | Term | Description |
|---|---|---|---|
| 0.4 | 1.2 | GO:0030015 | CCR4-NOT core complex(GO:0030015) |
| 0.2 | 0.5 | GO:0031390 | Ctf18 RFC-like complex(GO:0031390) |
| 0.1 | 0.5 | GO:0031314 | extrinsic component of mitochondrial inner membrane(GO:0031314) |
| 0.1 | 0.3 | GO:0048476 | Holliday junction resolvase complex(GO:0048476) |
| 0.1 | 0.3 | GO:0008622 | epsilon DNA polymerase complex(GO:0008622) |
| 0.1 | 0.3 | GO:0009897 | external side of plasma membrane(GO:0009897) |
| 0.1 | 0.3 | GO:0000408 | EKC/KEOPS complex(GO:0000408) |
| 0.1 | 0.4 | GO:0070531 | BRCA1-A complex(GO:0070531) |
| 0.0 | 0.7 | GO:0005880 | nuclear microtubule(GO:0005880) |
| 0.0 | 0.4 | GO:0030139 | endocytic vesicle(GO:0030139) |
| 0.0 | 0.3 | GO:0009346 | citrate lyase complex(GO:0009346) |
| 0.0 | 0.1 | GO:0035371 | microtubule plus-end(GO:0035371) |
| 0.0 | 0.4 | GO:0070971 | endoplasmic reticulum exit site(GO:0070971) |
| 0.0 | 0.3 | GO:0045252 | oxoglutarate dehydrogenase complex(GO:0045252) |
| 0.0 | 0.5 | GO:0005885 | Arp2/3 protein complex(GO:0005885) |
| 0.0 | 0.5 | GO:0005720 | nuclear heterochromatin(GO:0005720) |
| 0.0 | 0.1 | GO:0030681 | ribonuclease MRP complex(GO:0000172) nucleolar ribonuclease P complex(GO:0005655) multimeric ribonuclease P complex(GO:0030681) |
| 0.0 | 0.5 | GO:0000418 | DNA-directed RNA polymerase IV complex(GO:0000418) |
| 0.0 | 0.1 | GO:0000015 | phosphopyruvate hydratase complex(GO:0000015) |
| 0.0 | 1.0 | GO:0031228 | integral component of Golgi membrane(GO:0030173) intrinsic component of Golgi membrane(GO:0031228) |
| 0.0 | 0.2 | GO:0031261 | DNA replication preinitiation complex(GO:0031261) |
| 0.0 | 0.2 | GO:0009517 | thylakoid light-harvesting complex(GO:0009503) PSII associated light-harvesting complex II(GO:0009517) light-harvesting complex(GO:0030076) |
| 0.0 | 0.3 | GO:0030131 | clathrin adaptor complex(GO:0030131) |
| 0.0 | 0.6 | GO:0005762 | mitochondrial large ribosomal subunit(GO:0005762) |
| 0.0 | 0.3 | GO:0005849 | mRNA cleavage factor complex(GO:0005849) |
| 0.0 | 0.1 | GO:0033180 | proton-transporting V-type ATPase, V1 domain(GO:0033180) |
| 0.0 | 0.3 | GO:0009986 | cell surface(GO:0009986) |
| 0.0 | 0.5 | GO:0005680 | anaphase-promoting complex(GO:0005680) |
| 0.0 | 0.2 | GO:0035618 | root hair(GO:0035618) root hair tip(GO:0035619) |
| 0.0 | 0.2 | GO:0005742 | mitochondrial outer membrane translocase complex(GO:0005742) |
| 0.0 | 0.2 | GO:0031428 | box C/D snoRNP complex(GO:0031428) |
| 0.0 | 0.6 | GO:0000145 | exocyst(GO:0000145) |
| 0.0 | 3.4 | GO:0009505 | plant-type cell wall(GO:0009505) |
| 0.0 | 1.4 | GO:0042995 | cell projection(GO:0042995) |
| 0.0 | 0.1 | GO:0005884 | actin filament(GO:0005884) |
| 0.0 | 0.3 | GO:0016459 | myosin complex(GO:0016459) |
| 0.0 | 0.2 | GO:0030687 | preribosome, large subunit precursor(GO:0030687) |
| 0.0 | 4.0 | GO:0031225 | anchored component of membrane(GO:0031225) |
| 0.0 | 0.2 | GO:0005750 | mitochondrial respiratory chain complex III(GO:0005750) respiratory chain complex III(GO:0045275) |
| 0.0 | 1.2 | GO:0005887 | integral component of plasma membrane(GO:0005887) |
| 0.0 | 0.6 | GO:0005741 | mitochondrial outer membrane(GO:0005741) |
| 0.0 | 0.1 | GO:0008180 | COP9 signalosome(GO:0008180) |
| 0.0 | 0.1 | GO:0030125 | clathrin vesicle coat(GO:0030125) |
| 0.0 | 0.1 | GO:0000315 | organellar large ribosomal subunit(GO:0000315) |
| 0.0 | 0.0 | GO:0030119 | AP-type membrane coat adaptor complex(GO:0030119) |
| 0.0 | 0.2 | GO:0031305 | integral component of mitochondrial inner membrane(GO:0031305) |
| 0.0 | 0.1 | GO:0033588 | Elongator holoenzyme complex(GO:0033588) |
| 0.0 | 0.3 | GO:0012511 | monolayer-surrounded lipid storage body(GO:0012511) |
Gene overrepresentation in molecular function category:
| Log-likelihood per target | Total log-likelihood | Term | Description |
|---|---|---|---|
| 0.5 | 1.9 | GO:0080042 | ADP-glucose pyrophosphohydrolase activity(GO:0080042) |
| 0.3 | 2.5 | GO:0033946 | xyloglucan-specific endo-beta-1,4-glucanase activity(GO:0033946) |
| 0.3 | 0.8 | GO:0000170 | sphingosine hydroxylase activity(GO:0000170) |
| 0.2 | 1.2 | GO:0004535 | poly(A)-specific ribonuclease activity(GO:0004535) |
| 0.2 | 0.6 | GO:0008898 | S-adenosylmethionine-homocysteine S-methyltransferase activity(GO:0008898) betaine-homocysteine S-methyltransferase activity(GO:0047150) |
| 0.2 | 0.8 | GO:0008430 | selenium binding(GO:0008430) |
| 0.2 | 0.5 | GO:0045140 | inositol phosphoceramide synthase activity(GO:0045140) |
| 0.1 | 0.4 | GO:0019136 | deoxynucleoside kinase activity(GO:0019136) |
| 0.1 | 0.4 | GO:0004609 | phosphatidylserine decarboxylase activity(GO:0004609) |
| 0.1 | 1.0 | GO:0016621 | cinnamoyl-CoA reductase activity(GO:0016621) |
| 0.1 | 1.6 | GO:0016847 | 1-aminocyclopropane-1-carboxylate synthase activity(GO:0016847) |
| 0.1 | 0.4 | GO:0003838 | sterol 24-C-methyltransferase activity(GO:0003838) |
| 0.1 | 0.6 | GO:0015446 | arsenite secondary active transmembrane transporter activity(GO:0008490) arsenite-transmembrane transporting ATPase activity(GO:0015446) anion transmembrane-transporting ATPase activity(GO:0043225) cadmium ion binding(GO:0046870) |
| 0.1 | 0.4 | GO:0019784 | NEDD8-specific protease activity(GO:0019784) |
| 0.1 | 0.4 | GO:0016751 | dihydrolipoyllysine-residue succinyltransferase activity(GO:0004149) succinyltransferase activity(GO:0016748) S-succinyltransferase activity(GO:0016751) |
| 0.1 | 0.1 | GO:0033188 | sphingomyelin synthase activity(GO:0033188) ceramide cholinephosphotransferase activity(GO:0047493) |
| 0.1 | 0.3 | GO:1990380 | Lys48-specific deubiquitinase activity(GO:1990380) |
| 0.1 | 0.4 | GO:0070330 | oxidoreductase activity, acting on paired donors, with incorporation or reduction of molecular oxygen, reduced flavin or flavoprotein as one donor, and incorporation of one atom of oxygen(GO:0016712) aromatase activity(GO:0070330) |
| 0.1 | 0.9 | GO:0009922 | fatty acid elongase activity(GO:0009922) |
| 0.1 | 0.4 | GO:0033862 | UMP kinase activity(GO:0033862) |
| 0.1 | 0.5 | GO:0050113 | inositol oxygenase activity(GO:0050113) |
| 0.1 | 2.3 | GO:0004805 | trehalose-phosphatase activity(GO:0004805) |
| 0.1 | 0.5 | GO:0005544 | calcium-dependent phospholipid binding(GO:0005544) |
| 0.1 | 2.4 | GO:0016762 | xyloglucan:xyloglucosyl transferase activity(GO:0016762) |
| 0.1 | 0.2 | GO:0052901 | spermine:oxygen oxidoreductase (spermidine-forming) activity(GO:0052901) |
| 0.1 | 1.3 | GO:0102337 | 3-oxo-arachidoyl-CoA synthase activity(GO:0102336) 3-oxo-cerotoyl-CoA synthase activity(GO:0102337) 3-oxo-lignoceronyl-CoA synthase activity(GO:0102338) |
| 0.1 | 0.3 | GO:0004077 | biotin-[acetyl-CoA-carboxylase] ligase activity(GO:0004077) biotin-protein ligase activity(GO:0018271) |
| 0.1 | 0.3 | GO:0003862 | 3-isopropylmalate dehydrogenase activity(GO:0003862) |
| 0.1 | 0.3 | GO:0017110 | nucleoside-diphosphatase activity(GO:0017110) |
| 0.1 | 0.3 | GO:0050664 | NAD(P)H oxidase activity(GO:0016174) oxidoreductase activity, acting on NAD(P)H, oxygen as acceptor(GO:0050664) |
| 0.1 | 0.4 | GO:0005459 | UDP-galactose transmembrane transporter activity(GO:0005459) |
| 0.1 | 1.9 | GO:0047262 | polygalacturonate 4-alpha-galacturonosyltransferase activity(GO:0047262) |
| 0.1 | 0.6 | GO:0004806 | triglyceride lipase activity(GO:0004806) |
| 0.1 | 0.3 | GO:0008297 | single-stranded DNA exodeoxyribonuclease activity(GO:0008297) |
| 0.1 | 0.5 | GO:0010011 | auxin binding(GO:0010011) |
| 0.1 | 0.3 | GO:0051731 | polynucleotide 5'-hydroxyl-kinase activity(GO:0051731) |
| 0.1 | 0.2 | GO:0015603 | iron chelate transmembrane transporter activity(GO:0015603) iron-nicotianamine transmembrane transporter activity(GO:0051980) |
| 0.1 | 0.2 | GO:0004347 | glucose-6-phosphate isomerase activity(GO:0004347) |
| 0.1 | 0.2 | GO:0008883 | glutamyl-tRNA reductase activity(GO:0008883) |
| 0.1 | 0.4 | GO:0005350 | pyrimidine nucleobase transmembrane transporter activity(GO:0005350) uracil transmembrane transporter activity(GO:0015210) |
| 0.1 | 0.2 | GO:0042577 | sphingosine-1-phosphate phosphatase activity(GO:0042392) lipid phosphatase activity(GO:0042577) |
| 0.1 | 0.5 | GO:0010429 | methyl-CpNpG binding(GO:0010428) methyl-CpNpN binding(GO:0010429) |
| 0.1 | 0.2 | GO:0071614 | linoleic acid epoxygenase activity(GO:0071614) |
| 0.1 | 0.3 | GO:0000150 | recombinase activity(GO:0000150) |
| 0.1 | 0.8 | GO:0008195 | phosphatidate phosphatase activity(GO:0008195) |
| 0.0 | 0.1 | GO:0019789 | SUMO transferase activity(GO:0019789) |
| 0.0 | 0.2 | GO:0016768 | spermine synthase activity(GO:0016768) |
| 0.0 | 0.2 | GO:0045544 | gibberellin 20-oxidase activity(GO:0045544) |
| 0.0 | 0.2 | GO:0046593 | mandelonitrile lyase activity(GO:0046593) |
| 0.0 | 0.3 | GO:0003878 | ATP citrate synthase activity(GO:0003878) |
| 0.0 | 0.6 | GO:0004714 | transmembrane receptor protein tyrosine kinase activity(GO:0004714) |
| 0.0 | 0.3 | GO:0016453 | acetyl-CoA C-acetyltransferase activity(GO:0003985) C-acetyltransferase activity(GO:0016453) |
| 0.0 | 0.2 | GO:0004478 | methionine adenosyltransferase activity(GO:0004478) |
| 0.0 | 0.2 | GO:0004617 | phosphoglycerate dehydrogenase activity(GO:0004617) |
| 0.0 | 0.1 | GO:0051010 | microtubule plus-end binding(GO:0051010) |
| 0.0 | 0.1 | GO:0004748 | ribonucleoside-diphosphate reductase activity, thioredoxin disulfide as acceptor(GO:0004748) oxidoreductase activity, acting on CH or CH2 groups, disulfide as acceptor(GO:0016728) ribonucleoside-diphosphate reductase activity(GO:0061731) |
| 0.0 | 0.3 | GO:0050105 | L-gulonolactone oxidase activity(GO:0050105) |
| 0.0 | 0.2 | GO:0016675 | cytochrome-c oxidase activity(GO:0004129) heme-copper terminal oxidase activity(GO:0015002) oxidoreductase activity, acting on a heme group of donors(GO:0016675) oxidoreductase activity, acting on a heme group of donors, oxygen as acceptor(GO:0016676) |
| 0.0 | 0.1 | GO:0051669 | levanase activity(GO:0031219) fructan beta-fructosidase activity(GO:0051669) |
| 0.0 | 0.4 | GO:0035673 | oligopeptide transmembrane transporter activity(GO:0035673) peptide transmembrane transporter activity(GO:1904680) |
| 0.0 | 0.8 | GO:0005199 | structural constituent of cell wall(GO:0005199) |
| 0.0 | 0.2 | GO:0005354 | galactose transmembrane transporter activity(GO:0005354) |
| 0.0 | 0.1 | GO:0043812 | phosphatidylinositol phosphate 4-phosphatase activity(GO:0034596) phosphatidylinositol-4-phosphate phosphatase activity(GO:0043812) |
| 0.0 | 0.2 | GO:0070405 | ammonium ion binding(GO:0070405) |
| 0.0 | 0.2 | GO:0004001 | adenosine kinase activity(GO:0004001) |
| 0.0 | 0.3 | GO:0045549 | 9-cis-epoxycarotenoid dioxygenase activity(GO:0045549) |
| 0.0 | 0.2 | GO:0004366 | glycerol-3-phosphate O-acyltransferase activity(GO:0004366) |
| 0.0 | 0.1 | GO:0047782 | coniferin beta-glucosidase activity(GO:0047782) |
| 0.0 | 0.3 | GO:0070696 | transmembrane receptor protein serine/threonine kinase binding(GO:0070696) |
| 0.0 | 0.2 | GO:0060229 | phospholipase activator activity(GO:0016004) lipase activator activity(GO:0060229) |
| 0.0 | 0.4 | GO:0033170 | DNA clamp loader activity(GO:0003689) protein-DNA loading ATPase activity(GO:0033170) |
| 0.0 | 0.4 | GO:0031176 | endo-1,4-beta-xylanase activity(GO:0031176) |
| 0.0 | 0.2 | GO:0015165 | pyrimidine nucleotide-sugar transmembrane transporter activity(GO:0015165) |
| 0.0 | 0.4 | GO:0000822 | inositol hexakisphosphate binding(GO:0000822) |
| 0.0 | 0.2 | GO:0015098 | molybdate ion transmembrane transporter activity(GO:0015098) |
| 0.0 | 0.2 | GO:0004611 | phosphoenolpyruvate carboxykinase activity(GO:0004611) |
| 0.0 | 0.2 | GO:0048027 | mRNA 5'-UTR binding(GO:0048027) |
| 0.0 | 0.1 | GO:0047724 | inosine nucleosidase activity(GO:0047724) |
| 0.0 | 0.1 | GO:0004634 | phosphopyruvate hydratase activity(GO:0004634) |
| 0.0 | 0.3 | GO:0008061 | chitin binding(GO:0008061) |
| 0.0 | 0.7 | GO:0003954 | NADH dehydrogenase activity(GO:0003954) |
| 0.0 | 0.1 | GO:0031956 | medium-chain fatty acid-CoA ligase activity(GO:0031956) |
| 0.0 | 0.8 | GO:0005179 | hormone activity(GO:0005179) |
| 0.0 | 0.3 | GO:1990757 | ubiquitin ligase activator activity(GO:1990757) |
| 0.0 | 0.3 | GO:0008970 | phosphatidylcholine 1-acylhydrolase activity(GO:0008970) |
| 0.0 | 0.1 | GO:0004737 | pyruvate decarboxylase activity(GO:0004737) |
| 0.0 | 0.1 | GO:0050577 | GDP-L-fucose synthase activity(GO:0050577) |
| 0.0 | 0.2 | GO:0071617 | lysophospholipid acyltransferase activity(GO:0071617) |
| 0.0 | 0.6 | GO:0016168 | chlorophyll binding(GO:0016168) |
| 0.0 | 0.3 | GO:0047134 | protein-disulfide reductase activity(GO:0047134) |
| 0.0 | 0.5 | GO:0005345 | purine nucleobase transmembrane transporter activity(GO:0005345) |
| 0.0 | 0.7 | GO:0004724 | magnesium-dependent protein serine/threonine phosphatase activity(GO:0004724) |
| 0.0 | 0.5 | GO:0031386 | protein tag(GO:0031386) |
| 0.0 | 0.9 | GO:0045735 | nutrient reservoir activity(GO:0045735) |
| 0.0 | 0.2 | GO:0052747 | sinapyl alcohol dehydrogenase activity(GO:0052747) |
| 0.0 | 0.2 | GO:0003905 | alkylbase DNA N-glycosylase activity(GO:0003905) DNA-3-methyladenine glycosylase activity(GO:0008725) DNA-3-methylbase glycosylase activity(GO:0043733) |
| 0.0 | 0.3 | GO:0004708 | MAP kinase kinase activity(GO:0004708) |
| 0.0 | 0.1 | GO:0015434 | cadmium-transporting ATPase activity(GO:0015434) zinc-exporting ATPase activity(GO:0016463) |
| 0.0 | 0.2 | GO:0008506 | sucrose:proton symporter activity(GO:0008506) |
| 0.0 | 0.1 | GO:0010179 | IAA-Ala conjugate hydrolase activity(GO:0010179) |
| 0.0 | 0.1 | GO:0019206 | nucleoside kinase activity(GO:0019206) |
| 0.0 | 0.6 | GO:0031624 | ubiquitin conjugating enzyme binding(GO:0031624) |
| 0.0 | 0.1 | GO:0008192 | mRNA guanylyltransferase activity(GO:0004484) polynucleotide 5'-phosphatase activity(GO:0004651) RNA guanylyltransferase activity(GO:0008192) |
| 0.0 | 0.5 | GO:0016837 | carbon-oxygen lyase activity, acting on polysaccharides(GO:0016837) pectate lyase activity(GO:0030570) |
| 0.0 | 0.3 | GO:0008889 | glycerophosphodiester phosphodiesterase activity(GO:0008889) |
| 0.0 | 0.1 | GO:0004822 | isoleucine-tRNA ligase activity(GO:0004822) |
| 0.0 | 0.1 | GO:0052691 | UDP-arabinopyranose mutase activity(GO:0052691) |
| 0.0 | 0.2 | GO:0004351 | glutamate decarboxylase activity(GO:0004351) |
| 0.0 | 0.2 | GO:0000210 | NAD+ diphosphatase activity(GO:0000210) |
| 0.0 | 0.8 | GO:0008171 | O-methyltransferase activity(GO:0008171) |
| 0.0 | 0.1 | GO:0015193 | L-proline transmembrane transporter activity(GO:0015193) |
| 0.0 | 0.1 | GO:0005093 | Rab GDP-dissociation inhibitor activity(GO:0005093) |
| 0.0 | 0.1 | GO:0004000 | adenosine deaminase activity(GO:0004000) tRNA-specific adenosine deaminase activity(GO:0008251) |
| 0.0 | 0.3 | GO:0005375 | copper ion transmembrane transporter activity(GO:0005375) |
| 0.0 | 0.1 | GO:0016744 | transferase activity, transferring aldehyde or ketonic groups(GO:0016744) |
| 0.0 | 0.1 | GO:0050734 | hydroxycinnamoyltransferase activity(GO:0050734) |
| 0.0 | 0.2 | GO:0003860 | 3-hydroxyisobutyryl-CoA hydrolase activity(GO:0003860) |
| 0.0 | 0.2 | GO:0004337 | geranyltranstransferase activity(GO:0004337) |
| 0.0 | 0.5 | GO:0008810 | cellulase activity(GO:0008810) |
| 0.0 | 0.1 | GO:0050378 | UDP-glucuronate 4-epimerase activity(GO:0050378) |
| 0.0 | 0.7 | GO:0016759 | cellulose synthase activity(GO:0016759) |
| 0.0 | 0.1 | GO:0004526 | ribonuclease P activity(GO:0004526) |
| 0.0 | 0.6 | GO:0005262 | calcium channel activity(GO:0005262) |
| 0.0 | 0.1 | GO:0004550 | nucleoside diphosphate kinase activity(GO:0004550) |
| 0.0 | 0.0 | GO:0010297 | heteropolysaccharide binding(GO:0010297) |
| 0.0 | 0.2 | GO:0015145 | monosaccharide transmembrane transporter activity(GO:0015145) |
| 0.0 | 0.5 | GO:0051087 | chaperone binding(GO:0051087) |
| 0.0 | 0.1 | GO:0098599 | palmitoyl hydrolase activity(GO:0098599) |
| 0.0 | 0.1 | GO:0008199 | ferric iron binding(GO:0008199) |
| 0.0 | 0.1 | GO:0003909 | DNA ligase activity(GO:0003909) DNA ligase (ATP) activity(GO:0003910) ligase activity, forming phosphoric ester bonds(GO:0016886) |
| 0.0 | 0.9 | GO:0004197 | cysteine-type endopeptidase activity(GO:0004197) |
| 0.0 | 0.1 | GO:0015172 | acidic amino acid transmembrane transporter activity(GO:0015172) |
| 0.0 | 0.5 | GO:0080030 | methyl indole-3-acetate esterase activity(GO:0080030) |
| 0.0 | 0.4 | GO:0015450 | P-P-bond-hydrolysis-driven protein transmembrane transporter activity(GO:0015450) |
| 0.0 | 0.2 | GO:0004332 | fructose-bisphosphate aldolase activity(GO:0004332) |
| 0.0 | 0.1 | GO:0005086 | ARF guanyl-nucleotide exchange factor activity(GO:0005086) |
| 0.0 | 0.0 | GO:0004348 | glucosylceramidase activity(GO:0004348) |
| 0.0 | 0.0 | GO:0008934 | inositol monophosphate 1-phosphatase activity(GO:0008934) inositol monophosphate phosphatase activity(GO:0052834) |
| 0.0 | 0.2 | GO:0005089 | Rho guanyl-nucleotide exchange factor activity(GO:0005089) |
| 0.0 | 0.2 | GO:0046961 | proton-transporting ATPase activity, rotational mechanism(GO:0046961) |
| 0.0 | 0.1 | GO:0036374 | peptidyltransferase activity(GO:0000048) glutathione hydrolase activity(GO:0036374) |
| 0.0 | 0.0 | GO:0004829 | threonine-tRNA ligase activity(GO:0004829) |
| 0.0 | 0.0 | GO:0080045 | quercetin 3'-O-glucosyltransferase activity(GO:0080045) |
| 0.0 | 0.0 | GO:0080116 | glucuronoxylan glucuronosyltransferase activity(GO:0080116) |
| 0.0 | 0.8 | GO:0015171 | amino acid transmembrane transporter activity(GO:0015171) |
| 0.0 | 0.2 | GO:0015250 | water transmembrane transporter activity(GO:0005372) water channel activity(GO:0015250) |
| 0.0 | 0.1 | GO:0004605 | phosphatidate cytidylyltransferase activity(GO:0004605) |
| 0.0 | 0.1 | GO:0047372 | acylglycerol lipase activity(GO:0047372) |
| 0.0 | 0.7 | GO:0046910 | pectinesterase inhibitor activity(GO:0046910) |
Gene overrepresentation in curated gene sets: canonical pathways category:
| Log-likelihood per target | Total log-likelihood | Term | Description |
|---|---|---|---|
| 0.1 | 0.3 | PID AURORA A PATHWAY | Aurora A signaling |
| 0.1 | 0.2 | PID ARF 3PATHWAY | Arf1 pathway |
| 0.1 | 0.3 | PID HIF1A PATHWAY | Hypoxic and oxygen homeostasis regulation of HIF-1-alpha |
| 0.1 | 0.4 | PID P73PATHWAY | p73 transcription factor network |
| 0.1 | 0.2 | PID AVB3 OPN PATHWAY | Osteopontin-mediated events |
| 0.0 | 0.2 | PID REG GR PATHWAY | Glucocorticoid receptor regulatory network |
| 0.0 | 0.1 | PID IL8 CXCR2 PATHWAY | IL8- and CXCR2-mediated signaling events |
Gene overrepresentation in curated gene sets: REACTOME pathways category:
| Log-likelihood per target | Total log-likelihood | Term | Description |
|---|---|---|---|
| 0.1 | 1.3 | REACTOME CHEMOKINE RECEPTORS BIND CHEMOKINES | Genes involved in Chemokine receptors bind chemokines |
| 0.1 | 0.3 | REACTOME MEIOTIC SYNAPSIS | Genes involved in Meiotic Synapsis |
| 0.1 | 0.3 | REACTOME OXYGEN DEPENDENT PROLINE HYDROXYLATION OF HYPOXIA INDUCIBLE FACTOR ALPHA | Genes involved in Oxygen-dependent Proline Hydroxylation of Hypoxia-inducible Factor Alpha |
| 0.1 | 0.2 | REACTOME COPI MEDIATED TRANSPORT | Genes involved in COPI Mediated Transport |
| 0.1 | 0.2 | REACTOME GLUCONEOGENESIS | Genes involved in Gluconeogenesis |
| 0.0 | 0.2 | REACTOME INTRINSIC PATHWAY FOR APOPTOSIS | Genes involved in Intrinsic Pathway for Apoptosis |
| 0.0 | 0.2 | REACTOME REVERSIBLE HYDRATION OF CARBON DIOXIDE | Genes involved in Reversible Hydration of Carbon Dioxide |
| 0.0 | 0.1 | REACTOME SEMAPHORIN INTERACTIONS | Genes involved in Semaphorin interactions |
| 0.0 | 0.1 | REACTOME PURINE METABOLISM | Genes involved in Purine metabolism |
| 0.0 | 0.2 | REACTOME HOMOLOGOUS RECOMBINATION REPAIR OF REPLICATION INDEPENDENT DOUBLE STRAND BREAKS | Genes involved in Homologous recombination repair of replication-independent double-strand breaks |
| 0.0 | 0.2 | REACTOME SIGNALING BY PDGF | Genes involved in Signaling by PDGF |
| 0.0 | 0.1 | REACTOME GLYCEROPHOSPHOLIPID BIOSYNTHESIS | Genes involved in Glycerophospholipid biosynthesis |
| 0.0 | 0.3 | REACTOME INFLUENZA VIRAL RNA TRANSCRIPTION AND REPLICATION | Genes involved in Influenza Viral RNA Transcription and Replication |