Project
GSE130291:vernalization in Arabidopsis thaliana
Navigation
Downloads
Results for AT4G23810
Z-value: 0.30
Transcription factors associated with AT4G23810
| Gene Symbol | Gene ID | Gene Info |
|---|---|---|
|
AT4G23810
|
AT4G23810 | WRKY family transcription factor |
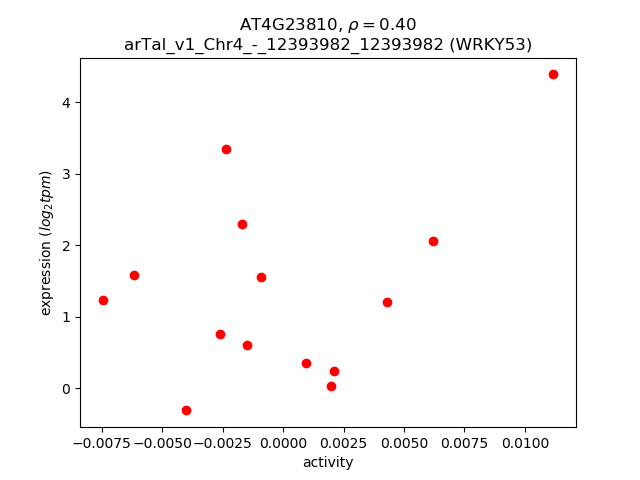
Activity-expression correlation:
| Gene | Promoter | Pearson corr. coef. | P-value | Plot |
|---|---|---|---|---|
| WRKY53 | arTal_v1_Chr4_-_12393982_12393982 | 0.40 | 1.5e-01 | Click! |
Activity profile of AT4G23810 motif
Sorted Z-values of AT4G23810 motif
| Promoter | Log-likelihood | Transcript | Gene | Gene Info |
|---|---|---|---|---|
| arTal_v1_Chr4_-_13016235_13016235 | 0.58 |
AT4G25470.1
|
CBF2
|
C-repeat/DRE binding factor 2 |
| arTal_v1_Chr4_+_10707344_10707378 | 0.30 |
AT4G19690.2
AT4G19690.1 |
IRT1
|
iron-regulated transporter 1 |
| arTal_v1_Chr5_-_17331646_17331646 | 0.28 |
AT5G43170.1
|
ZF3
|
zinc-finger protein 3 |
| arTal_v1_Chr5_+_4828499_4828641 | 0.22 |
AT5G14930.2
AT5G14930.3 AT5G14930.1 |
SAG101
|
senescence-associated gene 101 |
| arTal_v1_Chr4_+_15382777_15382777 | 0.21 |
AT4G31800.1
|
WRKY18
|
WRKY DNA-binding protein 18 |
| arTal_v1_Chr3_+_8309209_8309210 | 0.20 |
AT3G23250.1
AT3G23250.2 |
MYB15
|
myb domain protein 15 |
| arTal_v1_Chr4_+_15383197_15383197 | 0.20 |
AT4G31800.3
|
WRKY18
|
WRKY DNA-binding protein 18 |
| arTal_v1_Chr4_+_15383633_15383633 | 0.19 |
AT4G31800.2
|
WRKY18
|
WRKY DNA-binding protein 18 |
| arTal_v1_Chr1_-_23019494_23019494 | 0.18 |
AT1G62300.1
|
WRKY6
|
WRKY family transcription factor |
| arTal_v1_Chr4_-_524249_524249 | 0.16 |
AT4G01250.1
|
WRKY22
|
WRKY family transcription factor |
| arTal_v1_Chr4_+_12291632_12291632 | 0.14 |
AT4G23550.1
|
WRKY29
|
WRKY family transcription factor |
| arTal_v1_Chr5_+_25236945_25236963 | 0.11 |
AT5G62880.2
AT5G62880.1 |
RAC10
|
RAC-like 10 |
| arTal_v1_Chr3_+_8295617_8295617 | 0.10 |
AT3G23240.1
|
ERF1
|
ethylene response factor 1 |
| arTal_v1_Chr5_+_19179881_19179881 | 0.09 |
AT5G47230.1
|
ERF5
|
ethylene responsive element binding factor 5 |
| arTal_v1_Chr3_-_20042340_20042340 | 0.09 |
AT3G54120.1
|
AT3G54120
|
Reticulon family protein |
| arTal_v1_Chr5_+_5033933_5034005 | 0.08 |
AT5G15510.3
AT5G15510.1 AT5G15510.4 AT5G15510.2 |
AT5G15510
|
TPX2 (targeting protein for Xklp2) protein family |
| arTal_v1_Chr5_+_21865268_21865285 | 0.08 |
AT5G53860.1
AT5G53860.4 AT5G53860.3 AT5G53860.5 |
emb2737
|
embryo defective 2737 |
| arTal_v1_Chr3_+_19648711_19648711 | 0.08 |
AT3G52990.1
|
AT3G52990
|
Pyruvate kinase family protein |
| arTal_v1_Chr4_-_17123855_17123855 | 0.08 |
AT4G36180.1
|
AT4G36180
|
Leucine-rich receptor-like protein kinase family protein |
| arTal_v1_Chr3_+_19648880_19648880 | 0.08 |
AT3G52990.2
|
AT3G52990
|
Pyruvate kinase family protein |
| arTal_v1_Chr5_+_21865069_21865069 | 0.07 |
AT5G53860.2
|
emb2737
|
embryo defective 2737 |
| arTal_v1_Chr2_-_19166949_19166967 | 0.06 |
AT2G46680.2
AT2G46680.1 |
HB-7
|
homeobox 7 |
| arTal_v1_Chr5_-_878549_878549 | 0.06 |
AT5G03500.1
AT5G03500.5 AT5G03500.4 AT5G03500.2 |
AT5G03500
|
Mediator complex, subunit Med7 |
| arTal_v1_Chr4_+_15935373_15935373 | 0.06 |
AT4G33030.1
|
SQD1
|
sulfoquinovosyldiacylglycerol 1 |
| arTal_v1_Chr2_+_19000180_19000191 | 0.06 |
AT2G46270.2
AT2G46270.1 AT2G46270.4 AT2G46270.3 |
GBF3
|
G-box binding factor 3 |
| arTal_v1_Chr5_-_878364_878375 | 0.06 |
AT5G03500.3
AT5G03500.6 |
AT5G03500
|
Mediator complex, subunit Med7 |
| arTal_v1_Chr1_+_16616988_16616988 | 0.06 |
AT1G43850.1
AT1G43850.2 |
SEU
|
SEUSS transcriptional co-regulator |
| arTal_v1_Chr5_-_345457_345457 | 0.05 |
AT5G01890.1
|
AT5G01890
|
Leucine-rich receptor-like protein kinase family protein |
| arTal_v1_Chr3_+_3304225_3304268 | 0.05 |
AT3G10572.1
AT3G10572.2 |
APEM9
|
3-phosphoinositide-dependent protein kinase-1 |
| arTal_v1_Chr4_+_13236448_13236448 | 0.05 |
AT4G26120.1
|
AT4G26120
|
Ankyrin repeat family protein / BTB/POZ domain-containing protein |
| arTal_v1_Chr4_+_13236253_13236253 | 0.05 |
AT4G26120.2
|
AT4G26120
|
Ankyrin repeat family protein / BTB/POZ domain-containing protein |
| arTal_v1_Chr4_-_9335968_9336072 | 0.05 |
AT4G16566.1
AT4G16566.2 AT4G16566.3 |
HINT4
|
histidine triad nucleotide-binding 4 |
| arTal_v1_Chr4_-_18334893_18334893 | 0.04 |
AT4G39410.1
|
WRKY13
|
WRKY DNA-binding protein 13 |
| arTal_v1_Chr5_-_878116_878116 | 0.04 |
AT5G03500.7
|
AT5G03500
|
Mediator complex, subunit Med7 |
| arTal_v1_Chr2_+_85401_85416 | 0.04 |
AT2G01120.1
AT2G01120.2 |
ORC4
|
origin recognition complex subunit 4 |
| arTal_v1_Chr1_-_10801093_10801093 | 0.04 |
AT1G30490.1
|
PHV
|
Homeobox-leucine zipper family protein / lipid-binding START domain-containing protein |
| arTal_v1_Chr2_-_8329944_8329944 | 0.04 |
AT2G19190.1
|
FRK1
|
FLG22-induced receptor-like kinase 1 |
| arTal_v1_Chr3_+_3304965_3304965 | 0.03 |
AT3G10572.3
|
APEM9
|
3-phosphoinositide-dependent protein kinase-1 |
| arTal_v1_Chr2_+_15165213_15165213 | 0.03 |
AT2G36120.1
|
DOT1
|
Glycine-rich protein family |
| arTal_v1_Chr1_+_141870_141870 | 0.03 |
AT1G01360.1
|
RCAR1
|
regulatory component of ABA receptor 1 |
| arTal_v1_Chr5_+_19825078_19825078 | 0.02 |
AT5G48900.1
|
AT5G48900
|
Pectin lyase-like superfamily protein |
| arTal_v1_Chr3_+_25355_25507 | 0.00 |
AT3G01080.2
AT3G01080.3 AT3G01080.1 |
WRKY58
|
WRKY DNA-binding protein 58 |
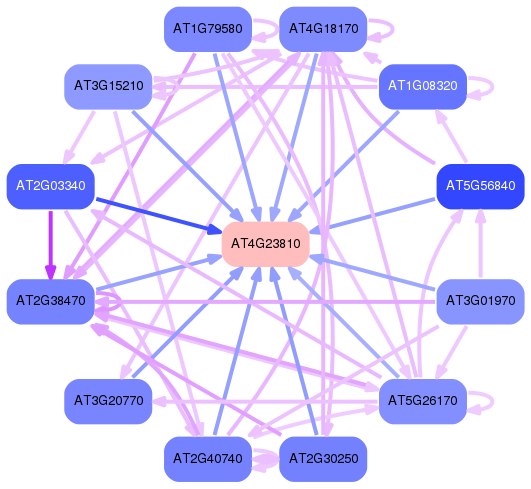
Network of associatons between targets according to the STRING database.

First level regulatory network of AT4G23810
Gene Ontology Analysis
Gene overrepresentation in biological process category:
| Log-likelihood per target | Total log-likelihood | Term | Description |
|---|---|---|---|
| 0.1 | 0.8 | GO:0050691 | regulation of defense response to virus by host(GO:0050691) |
| 0.1 | 0.3 | GO:0015675 | nickel cation transport(GO:0015675) |
| 0.0 | 0.2 | GO:0080029 | cellular response to boron-containing substance levels(GO:0080029) |
| 0.0 | 0.1 | GO:2001009 | regulation of plant-type cell wall cellulose biosynthetic process(GO:2001009) |
| 0.0 | 0.1 | GO:0046506 | sulfolipid metabolic process(GO:0046505) sulfolipid biosynthetic process(GO:0046506) |
| 0.0 | 0.1 | GO:0046898 | response to cycloheximide(GO:0046898) cellular response to external biotic stimulus(GO:0071217) |
| 0.0 | 0.1 | GO:0015919 | peroxisomal membrane transport(GO:0015919) |
Gene overrepresentation in molecular function category:
| Log-likelihood per target | Total log-likelihood | Term | Description |
|---|---|---|---|
| 0.0 | 0.3 | GO:0015086 | manganese ion transmembrane transporter activity(GO:0005384) cadmium ion transmembrane transporter activity(GO:0015086) |
| 0.0 | 0.2 | GO:0031420 | pyruvate kinase activity(GO:0004743) potassium ion binding(GO:0030955) alkali metal ion binding(GO:0031420) |