Project
GSE130291:vernalization in Arabidopsis thaliana
Navigation
Downloads
Results for AT4G15090
Z-value: 1.63
Transcription factors associated with AT4G15090
| Gene Symbol | Gene ID | Gene Info |
|---|---|---|
|
AT4G15090
|
AT4G15090 | FRS (FAR1 Related Sequences) transcription factor family |
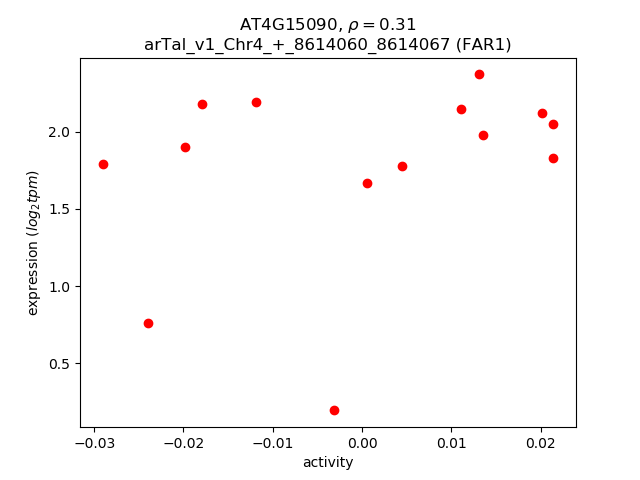
Activity-expression correlation:
| Gene | Promoter | Pearson corr. coef. | P-value | Plot |
|---|---|---|---|---|
| FAR1 | arTal_v1_Chr4_+_8614060_8614067 | 0.31 | 2.8e-01 | Click! |
Activity profile of AT4G15090 motif
Sorted Z-values of AT4G15090 motif
| Promoter | Log-likelihood | Transcript | Gene | Gene Info |
|---|---|---|---|---|
| arTal_v1_Chr3_+_3923515_3923515 | 2.60 |
AT3G12320.1
|
AT3G12320
|
hypothetical protein |
| arTal_v1_Chr3_+_3923969_3923969 | 2.57 |
AT3G12320.3
|
AT3G12320
|
hypothetical protein |
| arTal_v1_Chr3_+_3923735_3923735 | 2.57 |
AT3G12320.2
|
AT3G12320
|
hypothetical protein |
| arTal_v1_Chr1_+_3093644_3093644 | 2.34 |
AT1G09560.1
|
GLP5
|
germin-like protein 5 |
| arTal_v1_Chr2_+_10244745_10244745 | 2.19 |
AT2G24100.1
|
ASG1
|
ATP-dependent DNA helicase |
| arTal_v1_Chr2_-_6493512_6493512 | 1.76 |
AT2G15020.1
|
AT2G15020
|
hypothetical protein |
| arTal_v1_Chr1_+_18305445_18305445 | 1.70 |
AT1G49450.1
|
AT1G49450
|
Transducin/WD40 repeat-like superfamily protein |
| arTal_v1_Chr5_-_8358546_8358546 | 1.66 |
AT5G24470.1
|
PRR5
|
two-component response regulator-like protein |
| arTal_v1_Chr2_+_17165191_17165191 | 1.60 |
AT2G41180.1
|
SIB2
|
VQ motif-containing protein |
| arTal_v1_Chr1_-_11595982_11596056 | 1.54 |
AT1G32190.2
AT1G32190.1 |
AT1G32190
|
alpha/beta-Hydrolases superfamily protein |
| arTal_v1_Chr2_-_15955752_15955752 | 1.49 |
AT2G38110.1
|
GPAT6
|
glycerol-3-phosphate acyltransferase 6 |
| arTal_v1_Chr4_-_13752103_13752103 | 1.45 |
AT4G27520.1
|
ENODL2
|
early nodulin-like protein 2 |
| arTal_v1_Chr3_+_6393747_6393747 | 1.44 |
AT3G18560.1
|
AT3G18560
|
hypothetical protein |
| arTal_v1_Chr1_+_29759030_29759158 | 1.44 |
AT1G79110.2
AT1G79110.3 AT1G79110.1 |
BRG2
|
zinc ion binding protein |
| arTal_v1_Chr5_-_26933286_26933352 | 1.39 |
AT5G67480.1
AT5G67480.3 |
BT4
|
BTB and TAZ domain protein 4 |
| arTal_v1_Chr5_-_26932825_26932825 | 1.34 |
AT5G67480.2
|
BT4
|
BTB and TAZ domain protein 4 |
| arTal_v1_Chr4_+_17055226_17055281 | 1.22 |
AT4G36060.1
AT4G36060.3 AT4G36060.2 AT4G36060.4 |
bHLH11
|
basic helix-loop-helix (bHLH) DNA-binding superfamily protein |
| arTal_v1_Chr5_-_4697078_4697078 | 1.20 |
AT5G14570.1
|
NRT2.7
|
high affinity nitrate transporter 2.7 |
| arTal_v1_Chr2_-_7496292_7496292 | 1.16 |
AT2G17230.1
|
EXL5
|
EXORDIUM like 5 |
| arTal_v1_Chr5_-_24185629_24185629 | 1.15 |
AT5G60050.1
|
AT5G60050
|
BTB/POZ domain-containing protein |
| arTal_v1_Chr3_+_20788610_20788610 | 1.15 |
AT3G56010.1
|
AT3G56010
|
transmembrane protein |
| arTal_v1_Chr5_-_24953232_24953362 | 1.13 |
AT5G62130.2
AT5G62130.3 AT5G62130.1 AT5G62130.4 |
AT5G62130
|
Per1-like family protein |
| arTal_v1_Chr3_+_22514415_22514415 | 1.12 |
AT3G60930.1
|
AT3G60930
|
|
| arTal_v1_Chr2_-_17379059_17379059 | 1.07 |
AT2G41680.1
|
NTRC
|
NADPH-dependent thioredoxin reductase C |
| arTal_v1_Chr3_+_22514027_22514027 | 1.04 |
AT3G60930.2
|
AT3G60930
|
|
| arTal_v1_Chr1_-_6555610_6555610 | 1.03 |
AT1G18970.1
|
GLP4
|
germin-like protein 4 |
| arTal_v1_Chr1_-_598657_598657 | 1.00 |
AT1G02730.1
|
CSLD5
|
cellulose synthase-like D5 |
| arTal_v1_Chr5_+_17864376_17864376 | 1.00 |
AT5G44350.1
|
AT5G44350
|
ethylene-responsive nuclear protein-like protein |
| arTal_v1_Chr5_-_3286347_3286347 | 1.00 |
AT5G10450.3
AT5G10450.2 AT5G10450.4 |
GRF6
|
G-box regulating factor 6 |
| arTal_v1_Chr3_-_4358826_4358826 | 0.99 |
AT3G13403.1
|
AT3G13403
|
Defensin-like (DEFL) family protein |
| arTal_v1_Chr2_+_18682081_18682081 | 0.98 |
AT2G45310.1
|
GAE4
|
UDP-D-glucuronate 4-epimerase 4 |
| arTal_v1_Chr4_-_9844290_9844334 | 0.98 |
AT4G17680.3
AT4G17680.2 AT4G17680.1 |
AT4G17680
|
SBP (S-ribonuclease binding protein) family protein |
| arTal_v1_Chr5_-_3286537_3286537 | 0.97 |
AT5G10450.1
|
GRF6
|
G-box regulating factor 6 |
| arTal_v1_Chr4_+_18126057_18126057 | 0.97 |
AT4G38850.1
|
SAUR15
|
SAUR-like auxin-responsive protein family |
| arTal_v1_Chr3_+_20344785_20344785 | 0.97 |
AT3G54920.1
|
PMR6
|
Pectin lyase-like superfamily protein |
| arTal_v1_Chr2_-_15151575_15151634 | 0.96 |
AT2G36080.3
AT2G36080.2 AT2G36080.4 AT2G36080.1 |
ABS2
|
AP2/B3-like transcriptional factor family protein |
| arTal_v1_Chr3_+_9676982_9677020 | 0.96 |
AT3G26440.3
AT3G26440.6 |
AT3G26440
|
transmembrane protein, putative (DUF707) |
| arTal_v1_Chr4_-_304508_304612 | 0.95 |
AT4G00730.2
AT4G00730.1 |
ANL2
|
Homeobox-leucine zipper family protein / lipid-binding START domain-containing protein |
| arTal_v1_Chr2_+_17367492_17367492 | 0.95 |
AT2G41660.1
|
MIZ1
|
MIZU-KUSSEI-like protein (Protein of unknown function, DUF617) |
| arTal_v1_Chr1_+_19031909_19032013 | 0.95 |
AT1G51340.5
AT1G51340.1 |
AT1G51340
|
MATE efflux family protein |
| arTal_v1_Chr1_-_4229211_4229211 | 0.94 |
AT1G12420.1
|
ACR8
|
ACT domain repeat 8 |
| arTal_v1_Chr5_+_23355337_23355337 | 0.93 |
AT5G57660.1
|
COL5
|
CONSTANS-like 5 |
| arTal_v1_Chr5_+_17676795_17676823 | 0.92 |
AT5G43930.1
AT5G43930.3 AT5G43930.4 AT5G43930.2 |
AT5G43930
|
Transducin family protein / WD-40 repeat family protein |
| arTal_v1_Chr1_+_19031674_19031754 | 0.92 |
AT1G51340.3
AT1G51340.4 |
AT1G51340
|
MATE efflux family protein |
| arTal_v1_Chr2_-_15783480_15783480 | 0.90 |
AT2G37630.1
|
AS1
|
myb-like HTH transcriptional regulator family protein |
| arTal_v1_Chr3_+_1230746_1230746 | 0.90 |
AT3G04570.1
|
AHL19
|
AT-hook motif nuclear-localized protein 19 |
| arTal_v1_Chr5_+_1767630_1767630 | 0.89 |
AT5G05870.1
|
UGT76C1
|
UDP-glucosyl transferase 76C1 |
| arTal_v1_Chr5_+_8037798_8037798 | 0.89 |
AT5G23850.1
|
AT5G23850
|
O-glucosyltransferase rumi-like protein (DUF821) |
| arTal_v1_Chr1_+_1240294_1240375 | 0.88 |
AT1G04550.2
AT1G04550.1 |
IAA12
|
AUX/IAA transcriptional regulator family protein |
| arTal_v1_Chr5_+_1765390_1765390 | 0.88 |
AT5G05860.1
|
UGT76C2
|
UDP-glucosyl transferase 76C2 |
| arTal_v1_Chr5_-_21763462_21763462 | 0.88 |
AT5G53570.1
AT5G53570.2 |
AT5G53570
|
Ypt/Rab-GAP domain of gyp1p superfamily protein |
| arTal_v1_Chr3_+_23345754_23345754 | 0.87 |
AT3G63200.1
|
PLP9
|
PATATIN-like protein 9 |
| arTal_v1_Chr1_-_4228471_4228471 | 0.87 |
AT1G12420.2
|
ACR8
|
ACT domain repeat 8 |
| arTal_v1_Chr1_-_22096620_22096620 | 0.86 |
AT1G60010.1
|
AT1G60010
|
D-ribose-binding periplasmic protein |
| arTal_v1_Chr5_+_19309227_19309227 | 0.85 |
AT5G47640.1
|
NF-YB2
|
nuclear factor Y, subunit B2 |
| arTal_v1_Chr1_+_29387672_29387672 | 0.84 |
AT1G78100.1
|
AUF1
|
F-box family protein |
| arTal_v1_Chr1_-_4217412_4217412 | 0.84 |
AT1G12380.1
|
AT1G12380
|
hypothetical protein |
| arTal_v1_Chr4_+_2660156_2660156 | 0.84 |
AT4G05150.1
|
AT4G05150
|
Octicosapeptide/Phox/Bem1p family protein |
| arTal_v1_Chr3_+_15567067_15567067 | 0.84 |
AT3G43670.1
|
AT3G43670
|
Copper amine oxidase family protein |
| arTal_v1_Chr4_-_17123855_17123855 | 0.84 |
AT4G36180.1
|
AT4G36180
|
Leucine-rich receptor-like protein kinase family protein |
| arTal_v1_Chr5_+_1944754_1944754 | 0.83 |
AT5G06360.1
|
AT5G06360
|
Ribosomal protein S8e family protein |
| arTal_v1_Chr1_+_25319804_25319804 | 0.83 |
AT1G67560.1
|
LOX6
|
PLAT/LH2 domain-containing lipoxygenase family protein |
| arTal_v1_Chr4_+_15885520_15885520 | 0.83 |
AT4G32915.1
|
AT4G32915
|
glutamyl-tRNA(Gln) amidotransferase subunit C |
| arTal_v1_Chr1_+_26621899_26621959 | 0.83 |
AT1G70610.1
AT1G70610.2 |
ABCB26
|
transporter associated with antigen processing protein 1 |
| arTal_v1_Chr3_-_4493737_4493831 | 0.83 |
AT3G13700.2
AT3G13700.1 AT3G13710.1 |
AT3G13700
PRA1.F4
|
RNA-binding (RRM/RBD/RNP motifs) family protein prenylated RAB acceptor 1.F4 |
| arTal_v1_Chr1_+_28932868_28932868 | 0.83 |
AT1G76990.3
AT1G76990.2 |
ACR3
|
ACT domain repeat 3 |
| arTal_v1_Chr2_-_17040127_17040204 | 0.82 |
AT2G40820.2
AT2G40820.1 AT2G40820.3 AT2G40820.5 |
AT2G40820
|
stomatal closure actin-binding-like protein |
| arTal_v1_Chr5_+_18537239_18537239 | 0.82 |
AT5G45700.1
|
AT5G45700
|
Haloacid dehalogenase-like hydrolase (HAD) superfamily protein |
| arTal_v1_Chr1_+_5047782_5047782 | 0.81 |
AT1G14687.1
|
HB32
|
homeobox protein 32 |
| arTal_v1_Chr3_+_18672906_18672906 | 0.81 |
AT3G50350.1
|
AT3G50350
|
membrane insertase, putative (DUF1685) |
| arTal_v1_Chr1_+_29741728_29741728 | 0.81 |
AT1G79060.1
|
AT1G79060
|
TPRXL |
| arTal_v1_Chr4_-_11732674_11732674 | 0.80 |
AT4G22150.1
|
PUX3
|
UBA/UBX domain protein |
| arTal_v1_Chr3_-_6704312_6704312 | 0.80 |
AT3G19340.1
|
AT3G19340
|
aminopeptidase (DUF3754) |
| arTal_v1_Chr1_-_4590501_4590501 | 0.80 |
AT1G13380.1
|
AT1G13380
|
sodium/hydrogen exchanger (DUF1218) |
| arTal_v1_Chr5_+_17224270_17224270 | 0.79 |
AT5G42950.1
|
AT5G42950
|
GYF domain-containing protein |
| arTal_v1_Chr1_+_19871116_19871116 | 0.77 |
AT1G53290.1
|
AT1G53290
|
Galactosyltransferase family protein |
| arTal_v1_Chr4_+_12086898_12086898 | 0.77 |
AT4G23060.1
|
IQD22
|
IQ-domain 22 |
| arTal_v1_Chr3_+_18249663_18249727 | 0.77 |
AT3G49220.2
AT3G49220.3 AT3G49220.1 |
AT3G49220
|
Plant invertase/pectin methylesterase inhibitor superfamily |
| arTal_v1_Chr3_-_4496800_4496800 | 0.77 |
AT3G13720.1
|
PRA8
|
PRA1 (Prenylated rab acceptor) family protein |
| arTal_v1_Chr5_-_8869651_8869862 | 0.77 |
AT5G25475.3
AT5G25475.1 AT5G25475.4 AT5G25475.2 |
AT5G25475
|
AP2/B3-like transcriptional factor family protein |
| arTal_v1_Chr5_+_4427783_4427783 | 0.76 |
AT5G13720.1
|
AT5G13720
|
Uncharacterized protein family (UPF0114) |
| arTal_v1_Chr1_+_28932119_28932162 | 0.76 |
AT1G76990.1
AT1G76990.4 |
ACR3
|
ACT domain repeat 3 |
| arTal_v1_Chr1_+_27784928_27784928 | 0.76 |
AT1G73880.1
|
UGT89B1
|
UDP-glucosyl transferase 89B1 |
| arTal_v1_Chr1_+_28932359_28932359 | 0.76 |
AT1G76990.5
|
ACR3
|
ACT domain repeat 3 |
| arTal_v1_Chr1_+_24748105_24748105 | 0.76 |
AT1G66350.1
|
RGL1
|
RGA-like 1 |
| arTal_v1_Chr4_-_233652_233652 | 0.76 |
AT4G00530.1
|
AT4G00530
|
UvrABC system protein A |
| arTal_v1_Chr3_-_22412663_22412663 | 0.76 |
AT3G60630.1
|
HAM2
|
GRAS family transcription factor |
| arTal_v1_Chr3_-_5038114_5038114 | 0.74 |
AT3G14960.1
|
AT3G14960
|
Galactosyltransferase family protein |
| arTal_v1_Chr3_-_21448842_21448842 | 0.74 |
AT3G57930.2
AT3G57930.1 |
AT3G57930
|
rho GTPase-activating gacO-like protein |
| arTal_v1_Chr4_-_2481590_2481590 | 0.74 |
AT4G04890.2
|
PDF2
|
protodermal factor 2 |
| arTal_v1_Chr2_-_292624_292688 | 0.74 |
AT2G01660.2
AT2G01660.3 AT2G01660.1 |
PDLP6
|
plasmodesmata-located protein 6 |
| arTal_v1_Chr4_-_12254275_12254275 | 0.73 |
AT4G23490.1
|
AT4G23490
|
fringe-like protein (DUF604) |
| arTal_v1_Chr2_+_17285731_17285837 | 0.72 |
AT2G41460.2
AT2G41460.4 |
ARP
|
apurinic endonuclease-redox protein |
| arTal_v1_Chr5_+_24003888_24003888 | 0.71 |
AT5G59570.1
AT5G59570.2 |
BOA
|
Homeodomain-like superfamily protein |
| arTal_v1_Chr3_+_18672102_18672102 | 0.71 |
AT3G50350.2
|
AT3G50350
|
membrane insertase, putative (DUF1685) |
| arTal_v1_Chr2_+_13977881_13977888 | 0.71 |
AT2G32950.1
AT2G32950.2 |
COP1
|
Transducin/WD40 repeat-like superfamily protein |
| arTal_v1_Chr1_-_10249704_10249704 | 0.71 |
AT1G29300.1
|
UNE1
|
intracellular protein transporter, putative (DUF641) |
| arTal_v1_Chr1_+_18770937_18770937 | 0.71 |
AT1G50660.1
|
AT1G50660
|
actin cytoskeleton-regulatory complex pan-like protein |
| arTal_v1_Chr4_+_2029855_2029855 | 0.71 |
AT4G04210.1
|
PUX4
|
plant UBX domain containing protein 4 |
| arTal_v1_Chr1_-_25649254_25649254 | 0.71 |
AT1G68400.1
|
AT1G68400
|
leucine-rich repeat transmembrane protein kinase family protein |
| arTal_v1_Chr5_+_4156501_4156501 | 0.71 |
AT5G13100.1
|
AT5G13100
|
Gap junction beta-4 protein |
| arTal_v1_Chr3_-_7709933_7709933 | 0.71 |
AT3G21890.1
|
BBX31
|
B-box type zinc finger family protein |
| arTal_v1_Chr3_-_16876083_16876083 | 0.71 |
AT3G45900.1
|
AT3G45900
|
Ribonuclease P protein subunit P38-like protein |
| arTal_v1_Chr2_-_16734953_16734953 | 0.69 |
AT2G40080.1
|
ELF4
|
EARLY FLOWERING-like protein (DUF1313) |
| arTal_v1_Chr3_+_18522466_18522466 | 0.69 |
AT3G49950.1
|
AT3G49950
|
GRAS family transcription factor |
| arTal_v1_Chr1_+_9621398_9621398 | 0.69 |
AT1G27660.1
|
AT1G27660
|
basic helix-loop-helix (bHLH) DNA-binding superfamily protein |
| arTal_v1_Chr4_-_2482447_2482447 | 0.67 |
AT4G04890.1
|
PDF2
|
protodermal factor 2 |
| arTal_v1_Chr3_-_19595834_19595834 | 0.67 |
AT3G52870.1
|
AT3G52870
|
IQ calmodulin-binding motif family protein |
| arTal_v1_Chr3_+_519211_519314 | 0.66 |
AT3G02500.2
AT3G02500.1 AT3G02500.3 |
AT3G02500
|
mental retardation GTPase activating protein |
| arTal_v1_Chr3_-_18494285_18494285 | 0.66 |
AT3G49870.2
AT3G49870.1 |
ARLA1C
|
ADP-ribosylation factor-like A1C |
| arTal_v1_Chr5_-_17272298_17272298 | 0.66 |
AT5G43060.1
|
RD21B
|
Granulin repeat cysteine protease family protein |
| arTal_v1_Chr3_+_2476306_2476394 | 0.65 |
AT3G07760.3
AT3G07760.1 AT3G07760.4 AT3G07760.2 AT3G07760.5 AT3G07760.6 AT3G07760.9 AT3G07760.7 AT3G07760.8 |
AT3G07760
|
Sterile alpha motif (SAM) domain-containing protein |
| arTal_v1_Chr2_+_17285470_17285470 | 0.65 |
AT2G41460.3
AT2G41460.1 |
ARP
|
apurinic endonuclease-redox protein |
| arTal_v1_Chr4_+_6901456_6901503 | 0.64 |
AT4G11350.2
AT4G11350.1 |
AT4G11350
|
transferring glycosyl group transferase (DUF604) |
| arTal_v1_Chr5_-_18717031_18717031 | 0.64 |
AT5G46170.1
|
AT5G46170
|
F-box family protein |
| arTal_v1_Chr5_-_4026849_4026849 | 0.63 |
AT5G12420.1
AT5G12420.2 |
AT5G12420
|
O-acyltransferase (WSD1-like) family protein |
| arTal_v1_Chr1_-_5241538_5241541 | 0.63 |
AT1G15220.1
AT1G15220.2 |
CCMH
|
cytochrome c biogenesis protein family |
| arTal_v1_Chr5_-_230051_230051 | 0.63 |
AT5G01600.1
|
FER1
|
ferretin 1 |
| arTal_v1_Chr2_-_13185973_13185973 | 0.63 |
AT2G30980.1
|
SKdZeta
|
SHAGGY-related protein kinase dZeta |
| arTal_v1_Chr3_-_19281345_19281393 | 0.63 |
AT3G51950.3
AT3G51950.1 AT3G51950.2 |
AT3G51950
|
Zinc finger (CCCH-type) family protein / RNA recognition motif (RRM)-containing protein |
| arTal_v1_Chr5_+_25233881_25233881 | 0.63 |
AT5G62865.1
|
AT5G62865
|
hypothetical protein |
| arTal_v1_Chr2_+_18834011_18834149 | 0.62 |
AT2G45720.3
AT2G45720.2 AT2G45720.4 AT2G45720.5 |
AT2G45720
|
ARM repeat superfamily protein |
| arTal_v1_Chr2_-_10080323_10080323 | 0.61 |
AT2G23700.1
|
AT2G23700
|
Itga6 (Protein of unknown function, DUF547) |
| arTal_v1_Chr5_-_19772738_19772789 | 0.61 |
AT5G48760.2
AT5G48760.1 |
AT5G48760
|
Ribosomal protein L13 family protein |
| arTal_v1_Chr5_+_3831500_3831500 | 0.61 |
AT5G11890.1
|
EMB3135
|
harpin-induced protein |
| arTal_v1_Chr5_-_2876576_2876609 | 0.61 |
AT5G09250.2
AT5G09250.5 AT5G09250.1 AT5G09250.3 AT5G09250.4 |
KIWI
|
ssDNA-binding transcriptional regulator |
| arTal_v1_Chr5_+_5367971_5368013 | 0.61 |
AT5G16420.2
AT5G16420.3 AT5G16420.1 AT5G16420.4 |
AT5G16420
|
Pentatricopeptide repeat (PPR-like) superfamily protein |
| arTal_v1_Chr1_+_5168464_5168464 | 0.61 |
AT1G15000.1
|
scpl50
|
serine carboxypeptidase-like 50 |
| arTal_v1_Chr5_+_880148_880148 | 0.61 |
AT5G03510.1
|
AT5G03510
|
C2H2-type zinc finger family protein |
| arTal_v1_Chr3_-_19280823_19280823 | 0.60 |
AT3G51950.4
|
AT3G51950
|
Zinc finger (CCCH-type) family protein / RNA recognition motif (RRM)-containing protein |
| arTal_v1_Chr5_+_26854022_26854022 | 0.60 |
AT5G67300.1
|
MYBR1
|
myb domain protein r1 |
| arTal_v1_Chr1_-_23286797_23286797 | 0.60 |
AT1G62870.1
|
AT1G62870
|
hypothetical protein |
| arTal_v1_Chr2_-_16612554_16612554 | 0.60 |
AT2G39805.1
AT2G39805.2 |
AT2G39805
|
Integral membrane Yip1 family protein |
| arTal_v1_Chr1_+_23522449_23522497 | 0.60 |
AT1G63430.1
AT1G63430.3 AT1G63430.2 |
AT1G63430
|
Leucine-rich repeat protein kinase family protein |
| arTal_v1_Chr5_+_26012775_26012833 | 0.60 |
AT5G65120.1
AT5G65120.2 |
AT5G65120
|
DNA-directed RNA polymerase subunit beta |
| arTal_v1_Chr5_-_3879657_3879657 | 0.60 |
AT5G12010.1
|
AT5G12010
|
nuclease |
| arTal_v1_Chr2_-_19595001_19595001 | 0.59 |
AT2G47840.1
|
Tic20-II
|
Uncharacterized conserved protein ycf60 |
| arTal_v1_Chr5_+_19652980_19652980 | 0.58 |
AT5G48500.1
|
AT5G48500
|
pathogenic type III effector avirulence factor Avr AvrRpt-cleavage: cleavage site protein |
| arTal_v1_Chr5_+_21128085_21128129 | 0.58 |
AT5G52030.1
AT5G52030.2 |
AT5G52030
|
TraB family protein |
| arTal_v1_Chr4_+_14847583_14847583 | 0.58 |
AT4G30350.1
|
AT4G30350
|
Double Clp-N motif-containing P-loop nucleoside triphosphate hydrolases superfamily protein |
| arTal_v1_Chr5_+_16779643_16779643 | 0.58 |
AT5G41920.1
|
AT5G41920
|
GRAS family transcription factor |
| arTal_v1_Chr5_-_22764576_22764587 | 0.58 |
AT5G56240.1
AT5G56240.3 AT5G56240.2 |
AT5G56240
|
hapless protein |
| arTal_v1_Chr3_-_18241341_18241341 | 0.57 |
AT3G49210.2
|
AT3G49210
|
O-acyltransferase (WSD1-like) family protein |
| arTal_v1_Chr3_+_22791898_22791934 | 0.57 |
AT3G61590.3
AT3G61590.2 AT3G61590.1 |
HWS
|
Galactose oxidase/kelch repeat superfamily protein |
| arTal_v1_Chr3_+_2958676_2958676 | 0.56 |
AT3G09650.1
|
HCF152
|
Tetratricopeptide repeat (TPR)-like superfamily protein |
| arTal_v1_Chr2_+_8945243_8945243 | 0.56 |
AT2G20770.1
|
GCL2
|
GCR2-like 2 |
| arTal_v1_Chr3_-_18241524_18241524 | 0.55 |
AT3G49210.1
|
AT3G49210
|
O-acyltransferase (WSD1-like) family protein |
| arTal_v1_Chr3_+_17567126_17567126 | 0.55 |
AT3G47640.2
AT3G47640.3 |
PYE
|
basic helix-loop-helix (bHLH) DNA-binding superfamily protein |
| arTal_v1_Chr1_+_26651840_26651840 | 0.55 |
AT1G70690.1
|
HWI1
|
Receptor-like protein kinase-related family protein |
| arTal_v1_Chr1_-_28598420_28598420 | 0.55 |
AT1G76220.1
|
AT1G76220
|
hypothetical protein (DUF241) |
| arTal_v1_Chr5_-_7377667_7377776 | 0.54 |
AT5G22290.2
AT5G22290.1 |
NAC089
|
NAC domain containing protein 89 |
| arTal_v1_Chr1_-_5858446_5858550 | 0.52 |
AT1G17140.1
AT1G17140.2 |
ICR1
|
interactor of constitutive active rops 1 |
| arTal_v1_Chr1_+_116784_116784 | 0.52 |
AT1G01300.1
|
AT1G01300
|
Eukaryotic aspartyl protease family protein |
| arTal_v1_Chr5_-_7405883_7405883 | 0.52 |
AT5G22360.1
|
VAMP714
|
vesicle-associated membrane protein 714 |
| arTal_v1_Chr1_-_16800307_16800321 | 0.52 |
AT1G44170.2
AT1G44170.1 |
ALDH3H1
|
aldehyde dehydrogenase 3H1 |
| arTal_v1_Chr1_+_19030998_19030998 | 0.51 |
AT1G51340.2
|
AT1G51340
|
MATE efflux family protein |
| arTal_v1_Chr1_+_7734661_7734661 | 0.51 |
AT1G21980.1
|
PIP5K1
|
phosphatidylinositol-4-phosphate 5-kinase 1 |
| arTal_v1_Chr1_-_16798675_16798675 | 0.50 |
AT1G44170.3
|
ALDH3H1
|
aldehyde dehydrogenase 3H1 |
| arTal_v1_Chr3_+_7912905_7912905 | 0.50 |
AT3G22380.2
AT3G22380.3 AT3G22380.1 |
TIC
|
time for coffee |
| arTal_v1_Chr5_-_5766246_5766246 | 0.50 |
AT5G17490.1
|
RGL3
|
RGA-like protein 3 |
| arTal_v1_Chr5_+_1592013_1592130 | 0.50 |
AT5G05380.2
AT5G05380.3 AT5G05380.4 AT5G05380.1 |
PRA1.B3
|
prenylated RAB acceptor 1.B3 |
| arTal_v1_Chr2_-_18873972_18873972 | 0.50 |
AT2G45850.3
AT2G45850.1 |
AT2G45850
|
AT hook motif DNA-binding family protein |
| arTal_v1_Chr1_+_4989562_4989563 | 0.49 |
AT1G14580.3
AT1G14580.2 AT1G14580.1 |
AT1G14580
|
C2H2-like zinc finger protein |
| arTal_v1_Chr3_+_723878_723878 | 0.49 |
AT3G03140.1
|
AT3G03140
|
Tudor/PWWP/MBT superfamily protein |
| arTal_v1_Chr2_-_12929799_12929863 | 0.49 |
AT2G30330.2
AT2G30330.1 |
BLOS1
|
GCN5L1 family protein |
| arTal_v1_Chr2_-_18321696_18321696 | 0.49 |
AT2G44360.1
|
AT2G44360
|
ecotropic viral integration site protein |
| arTal_v1_Chr5_+_4441858_4441858 | 0.48 |
AT5G13760.1
|
AT5G13760
|
Plasma-membrane choline transporter family protein |
| arTal_v1_Chr3_+_390720_390720 | 0.48 |
AT3G02150.1
AT3G02150.2 |
PTF1
|
plastid transcription factor 1 |
| arTal_v1_Chr2_+_15104716_15104740 | 0.47 |
AT2G35950.2
AT2G35950.1 |
EDA12
|
embryo sac development arrest 12 |
| arTal_v1_Chr1_+_25521100_25521109 | 0.47 |
AT1G68100.1
AT1G68100.2 |
IAR1
|
ZIP metal ion transporter family |
| arTal_v1_Chr1_+_25230239_25230239 | 0.47 |
AT1G67340.1
|
AT1G67340
|
HCP-like superfamily protein with MYND-type zinc finger |
| arTal_v1_Chr1_+_22572609_22572609 | 0.47 |
AT1G61215.1
|
BRD4
|
bromodomain 4 |
| arTal_v1_Chr5_-_22763923_22763923 | 0.46 |
AT5G56240.4
|
AT5G56240
|
hapless protein |
| arTal_v1_Chr3_+_3758452_3758452 | 0.46 |
AT3G11900.1
AT3G11900.2 |
ANT1
|
aromatic and neutral transporter 1 |
| arTal_v1_Chr1_+_29345851_29345851 | 0.46 |
AT1G78040.2
|
AT1G78040
|
Pollen Ole e 1 allergen and extensin family protein |
| arTal_v1_Chr3_-_23429231_23429356 | 0.46 |
AT3G63450.4
AT3G63450.7 AT3G63450.1 AT3G63450.6 AT3G63450.3 |
AT3G63450
|
RNA-binding (RRM/RBD/RNP motifs) family protein |
| arTal_v1_Chr2_+_12776208_12776208 | 0.46 |
AT2G29970.1
|
AT2G29970
|
Double Clp-N motif-containing P-loop nucleoside triphosphate hydrolases superfamily protein |
| arTal_v1_Chr5_-_23723137_23723175 | 0.45 |
AT5G58720.3
AT5G58720.2 AT5G58720.1 |
AT5G58720
|
smr (Small MutS Related) domain-containing protein |
| arTal_v1_Chr1_+_3945584_3945584 | 0.45 |
AT1G11700.1
|
AT1G11700
|
senescence regulator (Protein of unknown function, DUF584) |
| arTal_v1_Chr3_+_2020164_2020164 | 0.45 |
AT3G06520.2
|
AT3G06520
|
agenet domain-containing protein |
| arTal_v1_Chr5_+_26058031_26058112 | 0.45 |
AT5G65210.4
AT5G65210.2 |
TGA1
|
bZIP transcription factor family protein |
| arTal_v1_Chr2_-_17040358_17040358 | 0.45 |
AT2G40820.4
|
AT2G40820
|
stomatal closure actin-binding-like protein |
| arTal_v1_Chr1_+_29345662_29345662 | 0.45 |
AT1G78040.3
|
AT1G78040
|
Pollen Ole e 1 allergen and extensin family protein |
| arTal_v1_Chr3_+_2019849_2019849 | 0.45 |
AT3G06520.1
|
AT3G06520
|
agenet domain-containing protein |
| arTal_v1_Chr1_+_29344539_29344539 | 0.45 |
AT1G78040.1
|
AT1G78040
|
Pollen Ole e 1 allergen and extensin family protein |
| arTal_v1_Chr1_+_17835032_17835032 | 0.44 |
AT1G48280.1
|
AT1G48280
|
hydroxyproline-rich glycoprotein family protein |
| arTal_v1_Chr1_-_5055299_5055299 | 0.44 |
AT1G14690.2
AT1G14690.1 |
MAP65-7
|
microtubule-associated protein 65-7 |
| arTal_v1_Chr1_-_7692459_7692459 | 0.44 |
AT1G21900.1
|
p24delta5
|
emp24/gp25L/p24 family/GOLD family protein |
| arTal_v1_Chr5_+_26261136_26261136 | 0.44 |
AT5G65683.1
|
WAVH2
|
Zinc finger (C3HC4-type RING finger) family protein |
| arTal_v1_Chr3_+_17567476_17567476 | 0.44 |
AT3G47640.1
|
PYE
|
basic helix-loop-helix (bHLH) DNA-binding superfamily protein |
| arTal_v1_Chr3_+_6120029_6120029 | 0.44 |
AT3G17860.3
AT3G17860.2 |
JAZ3
|
jasmonate-zim-domain protein 3 |
| arTal_v1_Chr5_+_26057814_26057818 | 0.44 |
AT5G65210.5
AT5G65210.3 |
TGA1
|
bZIP transcription factor family protein |
| arTal_v1_Chr1_+_6450585_6450585 | 0.44 |
AT1G18710.1
|
MYB47
|
myb domain protein 47 |
| arTal_v1_Chr5_+_26057533_26057623 | 0.43 |
AT5G65210.1
AT5G65210.6 |
TGA1
|
bZIP transcription factor family protein |
| arTal_v1_Chr1_-_23539242_23539242 | 0.43 |
AT1G63470.1
|
AT1G63470
|
AT hook motif DNA-binding family protein |
| arTal_v1_Chr5_+_13934108_13934108 | 0.43 |
AT5G35760.1
|
AT5G35760
|
Beta-galactosidase related protein |
| arTal_v1_Chr3_+_5081780_5081908 | 0.43 |
AT3G15095.2
AT3G15095.1 AT3G15095.3 |
HCF243
|
Serine/Threonine-kinase pakA-like protein |
| arTal_v1_Chr4_+_15487914_15487914 | 0.43 |
AT4G32020.1
|
AT4G32020
|
serine/arginine repetitive matrix-like protein |
| arTal_v1_Chr5_-_5006882_5006882 | 0.42 |
AT5G15410.1
AT5G15410.2 |
DND1
|
Cyclic nucleotide-regulated ion channel family protein |
| arTal_v1_Chr5_+_19763110_19763110 | 0.42 |
AT5G48730.1
|
AT5G48730
|
Pentatricopeptide repeat (PPR) superfamily protein |
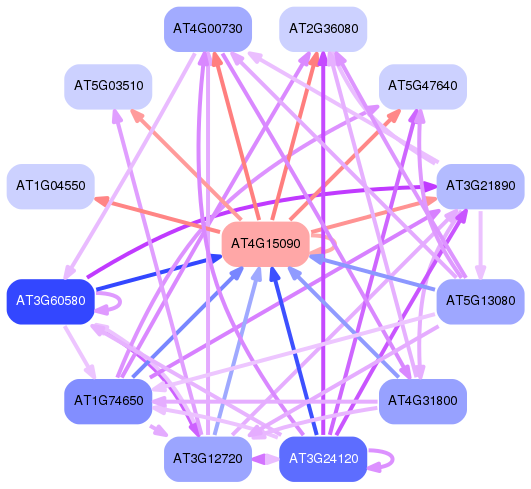
Network of associatons between targets according to the STRING database.

First level regulatory network of AT4G15090
Gene Ontology Analysis
Gene overrepresentation in biological process category:
| Log-likelihood per target | Total log-likelihood | Term | Description |
|---|---|---|---|
| 0.4 | 1.5 | GO:0031468 | nuclear envelope reassembly(GO:0031468) |
| 0.3 | 0.8 | GO:0010541 | acropetal auxin transport(GO:0010541) |
| 0.2 | 0.9 | GO:0016139 | glycoside catabolic process(GO:0016139) |
| 0.2 | 0.9 | GO:0043478 | pigment accumulation in response to UV light(GO:0043478) pigment accumulation in tissues in response to UV light(GO:0043479) pigment accumulation in tissues(GO:0043480) anthocyanin accumulation in tissues in response to UV light(GO:0043481) |
| 0.2 | 1.1 | GO:0010581 | regulation of starch biosynthetic process(GO:0010581) |
| 0.2 | 1.0 | GO:0042547 | cell wall modification involved in multidimensional cell growth(GO:0042547) |
| 0.2 | 0.6 | GO:0048464 | sepal development(GO:0048442) flower calyx development(GO:0048464) |
| 0.2 | 0.9 | GO:0010338 | leaf formation(GO:0010338) |
| 0.1 | 0.7 | GO:0051091 | positive regulation of sequence-specific DNA binding transcription factor activity(GO:0051091) |
| 0.1 | 0.7 | GO:0009647 | skotomorphogenesis(GO:0009647) |
| 0.1 | 1.4 | GO:0033683 | nucleotide-excision repair, DNA incision(GO:0033683) |
| 0.1 | 3.0 | GO:2000033 | regulation of seed dormancy process(GO:2000033) |
| 0.1 | 1.1 | GO:0071249 | cellular response to nitrate(GO:0071249) |
| 0.1 | 0.4 | GO:0070509 | calcium ion import(GO:0070509) |
| 0.1 | 0.7 | GO:0010018 | far-red light signaling pathway(GO:0010018) |
| 0.1 | 1.0 | GO:0010106 | cellular response to iron ion starvation(GO:0010106) |
| 0.1 | 0.3 | GO:1902464 | histone H3-K27 trimethylation(GO:0098532) regulation of histone H3-K27 trimethylation(GO:1902464) |
| 0.1 | 0.8 | GO:0006450 | regulation of translational fidelity(GO:0006450) |
| 0.1 | 0.2 | GO:1901522 | positive regulation of transcription from RNA polymerase II promoter involved in unfolded protein response(GO:0006990) positive regulation of transcription from RNA polymerase II promoter involved in cellular response to chemical stimulus(GO:1901522) |
| 0.1 | 0.5 | GO:0010929 | positive regulation of auxin mediated signaling pathway(GO:0010929) |
| 0.1 | 0.7 | GO:0045962 | positive regulation of development, heterochronic(GO:0045962) |
| 0.1 | 2.4 | GO:0050826 | response to freezing(GO:0050826) |
| 0.1 | 0.9 | GO:0045824 | negative regulation of innate immune response(GO:0045824) |
| 0.1 | 0.5 | GO:0035067 | histone H3-K9 demethylation(GO:0033169) negative regulation of histone acetylation(GO:0035067) negative regulation of protein acetylation(GO:1901984) negative regulation of peptidyl-lysine acetylation(GO:2000757) |
| 0.1 | 0.6 | GO:0097577 | intracellular sequestering of iron ion(GO:0006880) sequestering of iron ion(GO:0097577) |
| 0.1 | 0.3 | GO:2001295 | malonyl-CoA biosynthetic process(GO:2001295) |
| 0.1 | 0.6 | GO:0042753 | positive regulation of circadian rhythm(GO:0042753) |
| 0.1 | 0.2 | GO:0043470 | regulation of glycolytic process(GO:0006110) regulation of nucleotide catabolic process(GO:0030811) regulation of carbohydrate catabolic process(GO:0043470) regulation of cellular carbohydrate catabolic process(GO:0043471) |
| 0.1 | 0.2 | GO:1902315 | cell cycle DNA replication initiation(GO:1902292) nuclear cell cycle DNA replication initiation(GO:1902315) mitotic DNA replication initiation(GO:1902975) |
| 0.1 | 0.4 | GO:0048830 | adventitious root development(GO:0048830) |
| 0.1 | 0.3 | GO:0048863 | stem cell differentiation(GO:0048863) |
| 0.1 | 0.5 | GO:0006882 | cellular zinc ion homeostasis(GO:0006882) |
| 0.1 | 0.7 | GO:0010274 | hydrotropism(GO:0010274) |
| 0.1 | 0.6 | GO:2000144 | regulation of transcription initiation from RNA polymerase II promoter(GO:0060260) positive regulation of transcription initiation from RNA polymerase II promoter(GO:0060261) positive regulation of DNA-templated transcription, initiation(GO:2000144) |
| 0.0 | 0.8 | GO:0048829 | root cap development(GO:0048829) |
| 0.0 | 1.5 | GO:0010143 | cutin biosynthetic process(GO:0010143) |
| 0.0 | 0.8 | GO:0031408 | oxylipin biosynthetic process(GO:0031408) |
| 0.0 | 2.7 | GO:0042542 | response to hydrogen peroxide(GO:0042542) |
| 0.0 | 0.4 | GO:0006670 | sphingosine metabolic process(GO:0006670) diol metabolic process(GO:0034311) diol biosynthetic process(GO:0034312) sphingosine biosynthetic process(GO:0046512) |
| 0.0 | 0.4 | GO:0006655 | phosphatidylglycerol biosynthetic process(GO:0006655) |
| 0.0 | 0.2 | GO:0010481 | epidermal cell division(GO:0010481) regulation of epidermal cell division(GO:0010482) |
| 0.0 | 1.7 | GO:0051170 | nuclear import(GO:0051170) |
| 0.0 | 1.1 | GO:0006506 | GPI anchor metabolic process(GO:0006505) GPI anchor biosynthetic process(GO:0006506) |
| 0.0 | 1.0 | GO:0009269 | response to desiccation(GO:0009269) |
| 0.0 | 0.9 | GO:0009880 | embryonic pattern specification(GO:0009880) |
| 0.0 | 0.6 | GO:0000919 | cell plate assembly(GO:0000919) |
| 0.0 | 0.2 | GO:0007349 | cellularization(GO:0007349) |
| 0.0 | 0.8 | GO:0000460 | maturation of 5.8S rRNA(GO:0000460) |
| 0.0 | 0.3 | GO:0009652 | thigmotropism(GO:0009652) |
| 0.0 | 0.2 | GO:0009650 | photoreactive repair(GO:0000719) UV protection(GO:0009650) |
| 0.0 | 1.4 | GO:0018394 | internal protein amino acid acetylation(GO:0006475) histone acetylation(GO:0016573) internal peptidyl-lysine acetylation(GO:0018393) peptidyl-lysine acetylation(GO:0018394) |
| 0.0 | 0.6 | GO:0006949 | syncytium formation(GO:0006949) |
| 0.0 | 0.2 | GO:0032922 | circadian regulation of gene expression(GO:0032922) |
| 0.0 | 0.7 | GO:0009959 | negative gravitropism(GO:0009959) |
| 0.0 | 0.3 | GO:0016559 | peroxisome fission(GO:0016559) |
| 0.0 | 0.4 | GO:0010497 | plasmodesmata-mediated intercellular transport(GO:0010497) |
| 0.0 | 0.8 | GO:0048574 | long-day photoperiodism, flowering(GO:0048574) |
| 0.0 | 0.3 | GO:0060321 | acceptance of pollen(GO:0060321) |
| 0.0 | 0.5 | GO:2000012 | regulation of auxin polar transport(GO:2000012) |
| 0.0 | 0.3 | GO:0032544 | plastid translation(GO:0032544) |
| 0.0 | 0.5 | GO:0003333 | amino acid transmembrane transport(GO:0003333) |
| 0.0 | 0.9 | GO:2000022 | regulation of jasmonic acid mediated signaling pathway(GO:2000022) |
| 0.0 | 0.2 | GO:0009608 | response to symbiont(GO:0009608) response to symbiotic fungus(GO:0009610) |
| 0.0 | 0.2 | GO:0033619 | membrane protein proteolysis(GO:0033619) |
| 0.0 | 0.1 | GO:0006072 | glycerol-3-phosphate metabolic process(GO:0006072) |
| 0.0 | 0.4 | GO:0010030 | positive regulation of seed germination(GO:0010030) |
| 0.0 | 0.1 | GO:0006013 | mannose metabolic process(GO:0006013) |
| 0.0 | 0.3 | GO:0080036 | regulation of cytokinin-activated signaling pathway(GO:0080036) |
| 0.0 | 0.4 | GO:0007030 | Golgi organization(GO:0007030) |
| 0.0 | 0.1 | GO:0010065 | primary meristem tissue development(GO:0010065) |
| 0.0 | 0.7 | GO:0035195 | gene silencing by miRNA(GO:0035195) |
| 0.0 | 0.1 | GO:0006564 | L-serine biosynthetic process(GO:0006564) |
| 0.0 | 2.9 | GO:0009909 | regulation of flower development(GO:0009909) |
| 0.0 | 0.4 | GO:0046470 | phosphatidylcholine metabolic process(GO:0046470) |
| 0.0 | 0.6 | GO:0032880 | regulation of protein localization(GO:0032880) |
| 0.0 | 0.3 | GO:0009695 | jasmonic acid biosynthetic process(GO:0009695) |
| 0.0 | 0.5 | GO:0045324 | late endosome to vacuole transport(GO:0045324) |
| 0.0 | 0.1 | GO:0031937 | positive regulation of chromatin silencing(GO:0031937) regulation of methylation-dependent chromatin silencing(GO:0090308) positive regulation of methylation-dependent chromatin silencing(GO:0090309) |
| 0.0 | 0.6 | GO:0010286 | heat acclimation(GO:0010286) |
| 0.0 | 0.1 | GO:0007142 | male meiosis II(GO:0007142) |
| 0.0 | 0.8 | GO:0009630 | gravitropism(GO:0009630) |
| 0.0 | 0.1 | GO:0072583 | protein depolymerization(GO:0051261) clathrin-mediated endocytosis(GO:0072583) |
| 0.0 | 1.6 | GO:0006486 | protein glycosylation(GO:0006486) macromolecule glycosylation(GO:0043413) |
| 0.0 | 0.2 | GO:0050829 | defense response to Gram-negative bacterium(GO:0050829) |
| 0.0 | 1.3 | GO:0007015 | actin filament organization(GO:0007015) |
| 0.0 | 0.1 | GO:0009643 | photosynthetic acclimation(GO:0009643) |
Gene overrepresentation in cellular component category:
| Log-likelihood per target | Total log-likelihood | Term | Description |
|---|---|---|---|
| 0.3 | 1.2 | GO:0070505 | pollen coat(GO:0070505) |
| 0.1 | 1.4 | GO:0016272 | prefoldin complex(GO:0016272) |
| 0.1 | 0.9 | GO:0032541 | cortical endoplasmic reticulum(GO:0032541) |
| 0.1 | 0.5 | GO:0031082 | BLOC complex(GO:0031082) BLOC-1 complex(GO:0031083) |
| 0.1 | 0.3 | GO:0009317 | acetyl-CoA carboxylase complex(GO:0009317) |
| 0.1 | 0.6 | GO:0043189 | NuA4 histone acetyltransferase complex(GO:0035267) H4/H2A histone acetyltransferase complex(GO:0043189) H4 histone acetyltransferase complex(GO:1902562) |
| 0.1 | 0.8 | GO:0030687 | preribosome, large subunit precursor(GO:0030687) |
| 0.0 | 0.3 | GO:0000312 | plastid small ribosomal subunit(GO:0000312) |
| 0.0 | 0.3 | GO:0070062 | extracellular organelle(GO:0043230) extracellular exosome(GO:0070062) extracellular vesicle(GO:1903561) |
| 0.0 | 0.4 | GO:0005793 | endoplasmic reticulum-Golgi intermediate compartment(GO:0005793) |
| 0.0 | 1.2 | GO:0042644 | chloroplast nucleoid(GO:0042644) |
| 0.0 | 0.5 | GO:0035838 | growing cell tip(GO:0035838) cell tip(GO:0051286) pollen tube tip(GO:0090404) |
| 0.0 | 0.5 | GO:0035097 | histone methyltransferase complex(GO:0035097) |
| 0.0 | 1.4 | GO:0009706 | chloroplast inner membrane(GO:0009706) |
| 0.0 | 0.2 | GO:0042555 | MCM complex(GO:0042555) |
| 0.0 | 0.2 | GO:0098576 | integral component of lumenal side of endoplasmic reticulum membrane(GO:0071556) lumenal side of endoplasmic reticulum membrane(GO:0098553) lumenal side of membrane(GO:0098576) |
| 0.0 | 0.3 | GO:0005682 | U5 snRNP(GO:0005682) |
| 0.0 | 0.7 | GO:0000152 | nuclear ubiquitin ligase complex(GO:0000152) |
| 0.0 | 0.3 | GO:0048471 | perinuclear region of cytoplasm(GO:0048471) |
| 0.0 | 0.2 | GO:0031428 | box C/D snoRNP complex(GO:0031428) |
| 0.0 | 0.6 | GO:0005764 | lysosome(GO:0005764) |
| 0.0 | 0.2 | GO:0030140 | trans-Golgi network transport vesicle(GO:0030140) |
| 0.0 | 0.4 | GO:0009654 | photosystem II oxygen evolving complex(GO:0009654) |
| 0.0 | 1.4 | GO:0009705 | plant-type vacuole membrane(GO:0009705) |
| 0.0 | 0.3 | GO:0000159 | protein phosphatase type 2A complex(GO:0000159) |
| 0.0 | 1.8 | GO:0046658 | anchored component of plasma membrane(GO:0046658) |
Gene overrepresentation in molecular function category:
| Log-likelihood per target | Total log-likelihood | Term | Description |
|---|---|---|---|
| 0.5 | 1.4 | GO:0008311 | phosphodiesterase I activity(GO:0004528) double-stranded DNA 3'-5' exodeoxyribonuclease activity(GO:0008311) |
| 0.3 | 0.8 | GO:0050567 | glutaminyl-tRNA synthase (glutamine-hydrolyzing) activity(GO:0050567) |
| 0.2 | 0.8 | GO:0016165 | linoleate 13S-lipoxygenase activity(GO:0016165) |
| 0.2 | 1.0 | GO:0004028 | 3-chloroallyl aldehyde dehydrogenase activity(GO:0004028) |
| 0.2 | 1.5 | GO:0090447 | glycerol-3-phosphate 2-O-acyltransferase activity(GO:0090447) |
| 0.2 | 0.9 | GO:0003680 | AT DNA binding(GO:0003680) |
| 0.2 | 1.0 | GO:0050378 | UDP-glucuronate 4-epimerase activity(GO:0050378) |
| 0.2 | 0.5 | GO:0015173 | aromatic amino acid transmembrane transporter activity(GO:0015173) |
| 0.2 | 1.1 | GO:0004791 | thioredoxin-disulfide reductase activity(GO:0004791) |
| 0.1 | 0.8 | GO:0033836 | flavonol 7-O-beta-glucosyltransferase activity(GO:0033836) |
| 0.1 | 0.4 | GO:0008481 | sphinganine kinase activity(GO:0008481) |
| 0.1 | 0.6 | GO:0016724 | ferroxidase activity(GO:0004322) oxidoreductase activity, oxidizing metal ions, oxygen as acceptor(GO:0016724) |
| 0.1 | 4.2 | GO:0016597 | amino acid binding(GO:0016597) |
| 0.1 | 2.4 | GO:0051219 | protein phosphorylated amino acid binding(GO:0045309) phosphoprotein binding(GO:0051219) |
| 0.1 | 0.5 | GO:0003785 | actin monomer binding(GO:0003785) |
| 0.1 | 0.8 | GO:0010328 | auxin influx transmembrane transporter activity(GO:0010328) |
| 0.1 | 1.1 | GO:0015112 | nitrate transmembrane transporter activity(GO:0015112) |
| 0.1 | 0.4 | GO:0031956 | medium-chain fatty acid-CoA ligase activity(GO:0031956) |
| 0.1 | 0.4 | GO:0004142 | diacylglycerol cholinephosphotransferase activity(GO:0004142) |
| 0.1 | 0.3 | GO:1990841 | promoter-specific chromatin binding(GO:1990841) |
| 0.1 | 0.4 | GO:0050062 | long-chain-fatty-acyl-CoA reductase activity(GO:0050062) |
| 0.1 | 0.3 | GO:0010313 | phytochrome binding(GO:0010313) |
| 0.1 | 0.3 | GO:0046423 | allene-oxide cyclase activity(GO:0046423) |
| 0.1 | 0.6 | GO:0035198 | miRNA binding(GO:0035198) |
| 0.1 | 0.4 | GO:0043855 | intracellular cyclic nucleotide activated cation channel activity(GO:0005221) cyclic nucleotide-gated ion channel activity(GO:0043855) |
| 0.1 | 0.4 | GO:0004605 | phosphatidate cytidylyltransferase activity(GO:0004605) |
| 0.1 | 0.7 | GO:0030674 | protein binding, bridging(GO:0030674) |
| 0.1 | 0.2 | GO:0080042 | ADP-glucose pyrophosphohydrolase activity(GO:0080042) |
| 0.0 | 0.7 | GO:0051117 | ATPase binding(GO:0051117) |
| 0.0 | 0.5 | GO:0034647 | histone demethylase activity (H3-K4 specific)(GO:0032453) histone demethylase activity (H3-trimethyl-K4 specific)(GO:0034647) |
| 0.0 | 1.9 | GO:0000156 | phosphorelay response regulator activity(GO:0000156) |
| 0.0 | 1.4 | GO:0044183 | protein binding involved in protein folding(GO:0044183) |
| 0.0 | 0.3 | GO:0003989 | acetyl-CoA carboxylase activity(GO:0003989) |
| 0.0 | 0.2 | GO:0003913 | DNA photolyase activity(GO:0003913) |
| 0.0 | 1.4 | GO:0080044 | quercetin 7-O-glucosyltransferase activity(GO:0080044) |
| 0.0 | 0.2 | GO:0052622 | ATP dimethylallyltransferase activity(GO:0052622) ADP dimethylallyltransferase activity(GO:0052623) |
| 0.0 | 1.0 | GO:0016760 | cellulose synthase (UDP-forming) activity(GO:0016760) |
| 0.0 | 0.2 | GO:0016703 | oxidoreductase activity, acting on single donors with incorporation of molecular oxygen, incorporation of one atom of oxygen (internal monooxygenases or internal mixed function oxidases)(GO:0016703) |
| 0.0 | 1.1 | GO:0045735 | nutrient reservoir activity(GO:0045735) |
| 0.0 | 0.4 | GO:0008420 | CTD phosphatase activity(GO:0008420) |
| 0.0 | 0.8 | GO:0061733 | histone acetyltransferase activity(GO:0004402) peptide-lysine-N-acetyltransferase activity(GO:0061733) |
| 0.0 | 0.1 | GO:0004617 | phosphoglycerate dehydrogenase activity(GO:0004617) |
| 0.0 | 0.2 | GO:0042500 | aspartic endopeptidase activity, intramembrane cleaving(GO:0042500) |
| 0.0 | 0.3 | GO:0061608 | nuclear import signal receptor activity(GO:0061608) |
| 0.0 | 0.8 | GO:0003713 | transcription coactivator activity(GO:0003713) |
| 0.0 | 0.5 | GO:0030570 | carbon-oxygen lyase activity, acting on polysaccharides(GO:0016837) pectate lyase activity(GO:0030570) |
| 0.0 | 0.1 | GO:0005366 | myo-inositol:proton symporter activity(GO:0005366) |
| 0.0 | 0.2 | GO:0016161 | beta-amylase activity(GO:0016161) |
| 0.0 | 0.7 | GO:0004190 | aspartic-type endopeptidase activity(GO:0004190) |
| 0.0 | 0.7 | GO:0036442 | hydrogen-exporting ATPase activity(GO:0036442) |
| 0.0 | 0.2 | GO:0003746 | translation elongation factor activity(GO:0003746) |
| 0.0 | 0.1 | GO:0004751 | ribose-5-phosphate isomerase activity(GO:0004751) |
| 0.0 | 0.5 | GO:0005385 | zinc ion transmembrane transporter activity(GO:0005385) |
| 0.0 | 0.1 | GO:0004559 | alpha-mannosidase activity(GO:0004559) |
| 0.0 | 0.4 | GO:0008378 | galactosyltransferase activity(GO:0008378) |
| 0.0 | 0.8 | GO:0001228 | transcriptional activator activity, RNA polymerase II transcription regulatory region sequence-specific binding(GO:0001228) |
| 0.0 | 0.1 | GO:0004602 | glutathione peroxidase activity(GO:0004602) |
| 0.0 | 0.4 | GO:0047262 | polygalacturonate 4-alpha-galacturonosyltransferase activity(GO:0047262) |
| 0.0 | 0.2 | GO:0003730 | mRNA 3'-UTR binding(GO:0003730) |
| 0.0 | 0.8 | GO:0043130 | ubiquitin binding(GO:0043130) |
| 0.0 | 0.6 | GO:0102483 | scopolin beta-glucosidase activity(GO:0102483) |
| 0.0 | 0.2 | GO:0003688 | DNA replication origin binding(GO:0003688) |
| 0.0 | 0.6 | GO:0004185 | serine-type carboxypeptidase activity(GO:0004185) |
| 0.0 | 1.2 | GO:0016298 | lipase activity(GO:0016298) |
| 0.0 | 1.0 | GO:0000989 | transcription factor activity, transcription factor binding(GO:0000989) transcription cofactor activity(GO:0003712) |
Gene overrepresentation in curated gene sets: canonical pathways category:
| Log-likelihood per target | Total log-likelihood | Term | Description |
|---|---|---|---|
| 0.2 | 1.6 | PID MTOR 4PATHWAY | mTOR signaling pathway |
| 0.1 | 0.4 | PID S1P S1P1 PATHWAY | S1P1 pathway |
| 0.1 | 0.6 | SIG INSULIN RECEPTOR PATHWAY IN CARDIAC MYOCYTES | Genes related to the insulin receptor pathway |
| 0.0 | 0.1 | PID AMB2 NEUTROPHILS PATHWAY | amb2 Integrin signaling |
| 0.0 | 0.2 | PID E2F PATHWAY | E2F transcription factor network |
Gene overrepresentation in curated gene sets: REACTOME pathways category:
| Log-likelihood per target | Total log-likelihood | Term | Description |
|---|---|---|---|
| 0.1 | 0.4 | REACTOME SPHINGOLIPID DE NOVO BIOSYNTHESIS | Genes involved in Sphingolipid de novo biosynthesis |
| 0.1 | 0.4 | REACTOME PEROXISOMAL LIPID METABOLISM | Genes involved in Peroxisomal lipid metabolism |
| 0.0 | 0.2 | REACTOME UNWINDING OF DNA | Genes involved in Unwinding of DNA |
| 0.0 | 0.3 | REACTOME FORMATION OF THE TERNARY COMPLEX AND SUBSEQUENTLY THE 43S COMPLEX | Genes involved in Formation of the ternary complex, and subsequently, the 43S complex |