Project
GSE130291:vernalization in Arabidopsis thaliana
Navigation
Downloads
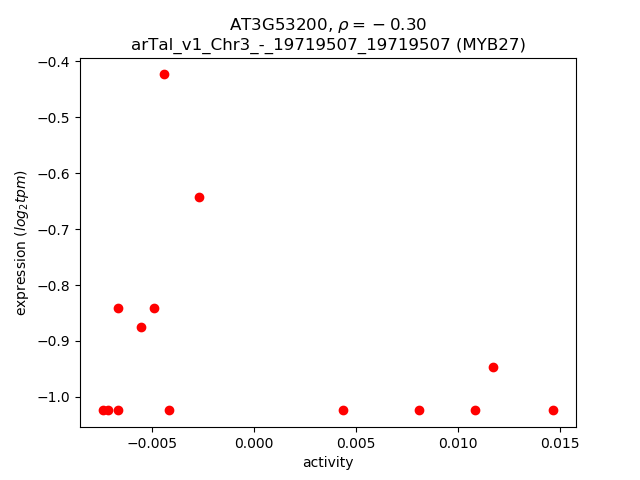
Results for AT3G53200
Z-value: 0.93
Transcription factors associated with AT3G53200
| Gene Symbol | Gene ID | Gene Info |
|---|---|---|
|
AT3G53200
|
AT3G53200 | myb domain protein 27 |
Activity-expression correlation:
| Gene | Promoter | Pearson corr. coef. | P-value | Plot |
|---|---|---|---|---|
| MYB27 | arTal_v1_Chr3_-_19719507_19719507 | -0.30 | 3.0e-01 | Click! |
Activity profile of AT3G53200 motif
Sorted Z-values of AT3G53200 motif
| Promoter | Log-likelihood | Transcript | Gene | Gene Info |
|---|---|---|---|---|
| arTal_v1_Chr5_-_15135169_15135169 | 1.59 |
AT5G37990.1
|
AT5G37990
|
S-adenosyl-L-methionine-dependent methyltransferase superfamily protein |
| arTal_v1_Chr1_-_7553975_7553975 | 1.54 |
AT1G21550.1
|
AT1G21550
|
Calcium-binding EF-hand family protein |
| arTal_v1_Chr5_-_8175431_8175525 | 1.47 |
AT5G24150.2
AT5G24150.1 |
SQP1
|
FAD/NAD(P)-binding oxidoreductase family protein |
| arTal_v1_Chr5_+_19183523_19183571 | 1.47 |
AT5G47240.2
AT5G47240.1 |
NUDT8
|
nudix hydrolase homolog 8 |
| arTal_v1_Chr2_-_15421866_15421866 | 1.40 |
AT2G36790.1
|
UGT73C6
|
UDP-glucosyl transferase 73C6 |
| arTal_v1_Chr1_+_9829261_9829261 | 1.38 |
AT1G28135.1
|
AT1G28135
|
hypothetical protein |
| arTal_v1_Chr1_+_8544248_8544308 | 1.37 |
AT1G24148.1
AT1G24148.2 |
AT1G24148
|
hypothetical protein |
| arTal_v1_Chr1_-_24558322_24558322 | 1.26 |
AT1G65970.1
|
TPX2
|
thioredoxin-dependent peroxidase 2 |
| arTal_v1_Chr4_+_11150049_11150049 | 1.22 |
AT4G20820.1
|
AT4G20820
|
FAD-binding Berberine family protein |
| arTal_v1_Chr2_+_12585856_12585856 | 1.20 |
AT2G29290.1
AT2G29290.2 |
AT2G29290
|
NAD(P)-binding Rossmann-fold superfamily protein |
| arTal_v1_Chr5_+_6566271_6566303 | 1.11 |
AT5G19470.1
AT5G19470.2 |
NUDT24
|
nudix hydrolase homolog 24 |
| arTal_v1_Chr1_+_27670626_27670626 | 1.10 |
AT1G73600.1
|
AT1G73600
|
S-adenosyl-L-methionine-dependent methyltransferases superfamily protein |
| arTal_v1_Chr1_-_2747936_2747967 | 1.05 |
AT1G08630.6
AT1G08630.7 AT1G08630.5 AT1G08630.2 |
THA1
|
threonine aldolase 1 |
| arTal_v1_Chr2_+_3618058_3618058 | 1.04 |
AT2G08986.1
|
AT2G08986
|
hypothetical protein |
| arTal_v1_Chr5_-_19807853_19807853 | 1.03 |
AT5G48850.1
|
ATSDI1
|
Tetratricopeptide repeat (TPR)-like superfamily protein |
| arTal_v1_Chr5_+_19428888_19428888 | 1.02 |
AT5G47980.1
|
AT5G47980
|
HXXXD-type acyl-transferase family protein |
| arTal_v1_Chr2_+_17409370_17409370 | 1.01 |
AT2G41730.1
|
AT2G41730
|
calcium-binding site protein |
| arTal_v1_Chr1_+_27669152_27669152 | 1.00 |
AT1G73600.2
|
AT1G73600
|
S-adenosyl-L-methionine-dependent methyltransferases superfamily protein |
| arTal_v1_Chr3_-_18373147_18373147 | 1.00 |
AT3G49570.1
|
LSU3
|
response to low sulfur 3 |
| arTal_v1_Chr1_+_24824356_24824496 | 1.00 |
AT1G66540.1
AT1G66540.2 |
AT1G66540
|
Cytochrome P450 superfamily protein |
| arTal_v1_Chr5_-_25661007_25661007 | 0.99 |
AT5G64120.1
|
AT5G64120
|
Peroxidase superfamily protein |
| arTal_v1_Chr5_-_7828724_7828724 | 0.94 |
AT5G23240.1
|
AT5G23240
|
DNAJ heat shock N-terminal domain-containing protein |
| arTal_v1_Chr1_+_20525654_20525654 | 0.94 |
AT1G55020.1
|
LOX1
|
lipoxygenase 1 |
| arTal_v1_Chr3_+_6465748_6465748 | 0.93 |
AT3G18773.1
|
AT3G18773
|
RING/U-box superfamily protein |
| arTal_v1_Chr2_+_13658888_13659004 | 0.92 |
AT2G32150.1
AT2G32150.2 AT2G32150.3 |
AT2G32150
|
Haloacid dehalogenase-like hydrolase (HAD) superfamily protein |
| arTal_v1_Chr5_-_19249622_19249622 | 0.91 |
AT5G47450.1
|
TIP2%3B3
|
tonoplast intrinsic protein 2;3 |
| arTal_v1_Chr1_-_19052582_19052582 | 0.88 |
AT1G51400.1
|
AT1G51400
|
Photosystem II 5 kD protein |
| arTal_v1_Chr3_+_5337475_5337475 | 0.88 |
AT3G15760.1
|
AT3G15760
|
cytochrome P450 family protein |
| arTal_v1_Chr3_+_5588459_5588486 | 0.85 |
AT3G16450.3
AT3G16450.1 |
JAL33
|
Mannose-binding lectin superfamily protein |
| arTal_v1_Chr5_+_6282881_6282881 | 0.84 |
AT5G18840.1
|
AT5G18840
|
Major facilitator superfamily protein |
| arTal_v1_Chr1_-_27265806_27265806 | 0.83 |
AT1G72430.1
|
AT1G72430
|
SAUR-like auxin-responsive protein family |
| arTal_v1_Chr3_+_5588292_5588292 | 0.83 |
AT3G16450.2
|
JAL33
|
Mannose-binding lectin superfamily protein |
| arTal_v1_Chr4_+_2324878_2324878 | 0.83 |
AT4G04610.1
|
APR1
|
APS reductase 1 |
| arTal_v1_Chr4_+_15676240_15676240 | 0.80 |
AT4G32480.1
|
AT4G32480
|
sugar phosphate exchanger, putative (DUF506) |
| arTal_v1_Chr2_+_12326808_12326808 | 0.79 |
AT2G28720.1
|
AT2G28720
|
Histone superfamily protein |
| arTal_v1_Chr1_+_11931149_11931149 | 0.78 |
AT1G32928.1
|
AT1G32928
|
Avr9/Cf-9 rapidly elicited protein |
| arTal_v1_Chr3_-_826585_826585 | 0.77 |
AT3G03470.1
|
CYP89A9
|
cytochrome P450, family 87, subfamily A, polypeptide 9 |
| arTal_v1_Chr5_+_5237970_5238178 | 0.77 |
AT5G16030.1
AT5G16030.4 AT5G16030.2 AT5G16030.3 |
AT5G16030
|
mental retardation GTPase activating protein |
| arTal_v1_Chr5_-_18954692_18954692 | 0.74 |
AT5G46710.1
AT5G46710.2 AT5G46710.3 |
AT5G46710
|
PLATZ transcription factor family protein |
| arTal_v1_Chr5_+_9656949_9657000 | 0.73 |
AT5G27360.3
AT5G27360.2 AT5G27360.1 AT5G27360.4 |
SFP2
|
Major facilitator superfamily protein |
| arTal_v1_Chr2_-_9741463_9741463 | 0.73 |
AT2G22880.1
|
AT2G22880
|
VQ motif-containing protein |
| arTal_v1_Chr3_-_16479559_16479559 | 0.73 |
AT3G45060.1
|
NRT2.6
|
high affinity nitrate transporter 2.6 |
| arTal_v1_Chr1_+_25041833_25041844 | 0.72 |
AT1G67070.1
AT1G67070.2 |
DIN9
|
Mannose-6-phosphate isomerase, type I |
| arTal_v1_Chr5_+_25939562_25939562 | 0.72 |
AT5G64905.1
|
PROPEP3
|
elicitor peptide 3 precursor |
| arTal_v1_Chr5_+_7168106_7168106 | 0.72 |
AT5G21100.1
|
AT5G21100
|
Plant L-ascorbate oxidase |
| arTal_v1_Chr1_-_8310916_8310916 | 0.71 |
AT1G23390.1
|
AT1G23390
|
Kelch repeat-containing F-box family protein |
| arTal_v1_Chr4_-_15931332_15931422 | 0.70 |
AT4G33010.2
AT4G33010.1 |
GLDP1
|
glycine decarboxylase P-protein 1 |
| arTal_v1_Chr1_-_16838562_16838562 | 0.69 |
AT1G44350.1
|
ILL6
|
IAA-amino acid hydrolase ILR1-like 6 |
| arTal_v1_Chr5_+_21389766_21389766 | 0.69 |
AT5G52770.1
|
AT5G52770
|
Copper transport protein family |
| arTal_v1_Chr5_-_26906517_26906524 | 0.67 |
AT5G67420.1
AT5G67420.2 |
LBD37
|
LOB domain-containing protein 37 |
| arTal_v1_Chr5_-_17458800_17458800 | 0.67 |
AT5G43450.2
|
AT5G43450
|
2-oxoglutarate (2OG) and Fe(II)-dependent oxygenase superfamily protein |
| arTal_v1_Chr5_-_17458980_17458980 | 0.67 |
AT5G43450.1
|
AT5G43450
|
2-oxoglutarate (2OG) and Fe(II)-dependent oxygenase superfamily protein |
| arTal_v1_Chr5_+_5238502_5238502 | 0.66 |
AT5G16030.5
|
AT5G16030
|
mental retardation GTPase activating protein |
| arTal_v1_Chr3_-_19197334_19197356 | 0.66 |
AT3G51750.1
AT3G51750.2 AT3G51750.3 |
AT3G51750
|
hypothetical protein |
| arTal_v1_Chr1_-_11801407_11801407 | 0.66 |
AT1G32640.1
|
MYC2
|
Basic helix-loop-helix (bHLH) DNA-binding family protein |
| arTal_v1_Chr3_-_1462917_1462963 | 0.65 |
AT3G05165.4
AT3G05165.1 AT3G05165.6 AT3G05165.3 AT3G05165.5 AT3G05165.2 |
AT3G05165
|
Major facilitator superfamily protein |
| arTal_v1_Chr3_+_20354351_20354351 | 0.64 |
AT3G54940.3
AT3G54940.2 |
AT3G54940
|
Papain family cysteine protease |
| arTal_v1_Chr1_+_24637196_24637196 | 0.64 |
AT1G66160.2
AT1G66160.1 |
CMPG1
|
CYS, MET, PRO, and GLY protein 1 |
| arTal_v1_Chr2_-_13631929_13631929 | 0.63 |
AT2G32020.1
|
AT2G32020
|
Acyl-CoA N-acyltransferases (NAT) superfamily protein |
| arTal_v1_Chr3_+_20776220_20776265 | 0.63 |
AT3G55980.2
AT3G55980.1 |
SZF1
|
salt-inducible zinc finger 1 |
| arTal_v1_Chr5_-_16195751_16195888 | 0.63 |
AT5G40450.2
AT5G40450.1 |
AT5G40450
|
A-kinase anchor-like protein |
| arTal_v1_Chr5_-_17025361_17025361 | 0.62 |
AT5G42580.1
|
CYP705A12
|
cytochrome P450, family 705, subfamily A, polypeptide 12 |
| arTal_v1_Chr5_-_3993767_3993767 | 0.62 |
AT5G12340.2
|
AT5G12340
|
DUF4228 domain protein |
| arTal_v1_Chr5_-_20016857_20016857 | 0.61 |
AT5G49360.1
|
BXL1
|
beta-xylosidase 1 |
| arTal_v1_Chr2_-_16950705_16950705 | 0.61 |
AT2G40610.1
|
EXPA8
|
expansin A8 |
| arTal_v1_Chr3_+_17867131_17867131 | 0.59 |
AT3G48240.1
|
AT3G48240
|
Octicosapeptide/Phox/Bem1p family protein |
| arTal_v1_Chr4_-_7736745_7736745 | 0.58 |
AT4G13280.1
AT4G13280.2 |
TPS12
|
terpenoid synthase 12 |
| arTal_v1_Chr4_+_17752079_17752079 | 0.58 |
AT4G37770.1
|
ACS8
|
1-amino-cyclopropane-1-carboxylate synthase 8 |
| arTal_v1_Chr4_-_7893727_7893761 | 0.58 |
AT4G13575.1
AT4G13575.2 |
AT4G13575
|
hypothetical protein |
| arTal_v1_Chr4_-_18459257_18459257 | 0.58 |
AT4G39780.1
|
AT4G39780
|
Integrase-type DNA-binding superfamily protein |
| arTal_v1_Chr4_-_17550257_17550257 | 0.57 |
AT4G37290.1
|
AT4G37290
|
transmembrane protein |
| arTal_v1_Chr3_-_9723904_9723904 | 0.57 |
AT3G26520.1
|
TIP2
|
tonoplast intrinsic protein 2 |
| arTal_v1_Chr4_+_17388649_17388649 | 0.57 |
AT4G36900.1
|
RAP2.10
|
related to AP2 10 |
| arTal_v1_Chr4_-_3950602_3950602 | 0.57 |
AT4G06700.1
|
AT4G06700
|
|
| arTal_v1_Chr2_-_13946790_13946790 | 0.57 |
AT2G32870.1
AT2G32870.2 |
AT2G32870
|
TRAF-like family protein |
| arTal_v1_Chr2_+_18253610_18253610 | 0.57 |
AT2G44130.1
|
AT2G44130
|
Galactose oxidase/kelch repeat superfamily protein |
| arTal_v1_Chr1_+_22628264_22628409 | 0.56 |
AT1G61340.1
AT1G61340.2 |
FBS1
|
F-box family protein |
| arTal_v1_Chr1_-_6283348_6283348 | 0.55 |
AT1G18265.1
|
AT1G18265
|
zein-binding protein (Protein of unknown function, DUF593) |
| arTal_v1_Chr2_+_12597018_12597117 | 0.54 |
AT2G29340.2
AT2G29340.1 AT2G29340.3 AT2G29340.4 |
AT2G29340
|
NAD-dependent epimerase/dehydratase family protein |
| arTal_v1_Chr1_+_28253890_28253890 | 0.54 |
AT1G75290.1
|
AT1G75290
|
NAD(P)-binding Rossmann-fold superfamily protein |
| arTal_v1_Chr4_-_17777445_17777445 | 0.54 |
AT4G37800.1
|
XTH7
|
xyloglucan endotransglucosylase/hydrolase 7 |
| arTal_v1_Chr1_-_2747243_2747243 | 0.54 |
AT1G08630.1
|
THA1
|
threonine aldolase 1 |
| arTal_v1_Chr5_-_26126560_26126560 | 0.53 |
AT5G65380.1
|
AT5G65380
|
MATE efflux family protein |
| arTal_v1_Chr5_+_24707445_24707445 | 0.53 |
AT5G61440.2
AT5G61440.1 |
ACHT5
|
atypical CYS HIS rich thioredoxin 5 |
| arTal_v1_Chr1_-_18617155_18617155 | 0.53 |
AT1G50250.1
|
FTSH1
|
FTSH protease 1 |
| arTal_v1_Chr2_+_18333370_18333370 | 0.53 |
AT2G44430.1
|
AT2G44430
|
DNA-binding bromodomain-containing protein |
| arTal_v1_Chr2_-_14322082_14322082 | 0.53 |
AT2G33850.1
|
AT2G33850
|
E6-like protein |
| arTal_v1_Chr5_+_9648508_9648508 | 0.52 |
AT5G27350.1
|
SFP1
|
Major facilitator superfamily protein |
| arTal_v1_Chr1_+_28253722_28253722 | 0.52 |
AT1G75290.2
|
AT1G75290
|
NAD(P)-binding Rossmann-fold superfamily protein |
| arTal_v1_Chr1_-_26474786_26474833 | 0.52 |
AT1G70290.2
AT1G70290.1 |
TPS8
|
trehalose-6-phosphatase synthase S8 |
| arTal_v1_Chr4_+_7480556_7480641 | 0.51 |
AT4G12690.2
AT4G12690.1 |
AT4G12690
|
DUF868 family protein (DUF868) |
| arTal_v1_Chr3_+_604785_604785 | 0.51 |
AT3G02790.1
|
AT3G02790
|
zinc finger (C2H2 type) family protein |
| arTal_v1_Chr4_-_2234689_2234689 | 0.51 |
AT4G04490.1
|
CRK36
|
cysteine-rich RLK (RECEPTOR-like protein kinase) 36 |
| arTal_v1_Chr5_-_3993610_3993610 | 0.51 |
AT5G12340.1
|
AT5G12340
|
DUF4228 domain protein |
| arTal_v1_Chr1_+_5596633_5596633 | 0.51 |
AT1G16370.1
|
OCT6
|
organic cation/carnitine transporter 6 |
| arTal_v1_Chr3_+_8657736_8657736 | 0.51 |
AT3G23960.1
|
AT3G23960
|
F-box and associated interaction domains-containing protein |
| arTal_v1_Chr1_+_25042135_25042135 | 0.51 |
AT1G67070.3
|
DIN9
|
Mannose-6-phosphate isomerase, type I |
| arTal_v1_Chr3_+_3694956_3694956 | 0.51 |
AT3G11690.1
|
AT3G11690
|
hypothetical protein |
| arTal_v1_Chr5_-_19817831_19817955 | 0.51 |
AT5G48880.3
AT5G48880.4 AT5G48880.1 AT5G48880.2 |
KAT5
|
peroxisomal 3-keto-acyl-CoA thiolase 2 |
| arTal_v1_Chr2_+_15514923_15514923 | 0.51 |
AT2G36950.1
|
AT2G36950
|
Heavy metal transport/detoxification superfamily protein |
| arTal_v1_Chr3_+_4810888_4810888 | 0.51 |
AT3G14395.1
|
AT3G14395
|
hypothetical protein |
| arTal_v1_Chr3_-_2807055_2807055 | 0.51 |
AT3G09160.1
|
AT3G09160
|
RNA-binding (RRM/RBD/RNP motifs) family protein |
| arTal_v1_Chr1_-_26770175_26770177 | 0.51 |
AT1G71000.1
AT1G71000.2 |
AT1G71000
|
Chaperone DnaJ-domain superfamily protein |
| arTal_v1_Chr1_+_19619724_19619745 | 0.50 |
AT1G52690.2
AT1G52690.1 |
LEA7
|
Late embryogenesis abundant protein (LEA) family protein |
| arTal_v1_Chr1_+_4515464_4515699 | 0.50 |
AT1G13220.3
AT1G13220.1 AT1G13220.2 |
LINC2
|
nuclear matrix constituent protein-like protein |
| arTal_v1_Chr3_-_17337733_17337733 | 0.50 |
AT3G47070.1
|
AT3G47070
|
thylakoid soluble phosphoprotein |
| arTal_v1_Chr5_+_4218786_4218828 | 0.50 |
AT5G13220.5
AT5G13220.1 AT5G13220.3 AT5G13220.2 AT5G13220.6 AT5G13220.7 AT5G13220.4 |
JAZ10
|
jasmonate-zim-domain protein 10 |
| arTal_v1_Chr1_+_786832_786832 | 0.50 |
AT1G03220.1
|
AT1G03220
|
Eukaryotic aspartyl protease family protein |
| arTal_v1_Chr1_-_2282828_2282828 | 0.49 |
AT1G07430.1
|
HAI2
|
highly ABA-induced PP2C protein 2 |
| arTal_v1_Chr1_+_2867203_2867271 | 0.49 |
AT1G08920.1
AT1G08920.2 AT1G08920.3 |
ESL1
|
ERD (early response to dehydration) six-like 1 |
| arTal_v1_Chr1_+_3999157_3999202 | 0.49 |
AT1G11850.2
AT1G11850.4 AT1G11850.3 AT1G11850.1 |
AT1G11850
|
transmembrane protein |
| arTal_v1_Chr2_+_15445294_15445294 | 0.49 |
AT2G36830.1
|
GAMMA-TIP
|
gamma tonoplast intrinsic protein |
| arTal_v1_Chr1_-_2746740_2746740 | 0.49 |
AT1G08630.3
|
THA1
|
threonine aldolase 1 |
| arTal_v1_Chr1_-_21474602_21474602 | 0.49 |
AT1G58037.1
AT1G58037.2 |
AT1G58037
|
Cysteine/Histidine-rich C1 domain family protein |
| arTal_v1_Chr1_+_17203685_17203685 | 0.49 |
AT1G46120.1
|
AT1G46120
|
|
| arTal_v1_Chr1_-_2746526_2746526 | 0.49 |
AT1G08630.4
|
THA1
|
threonine aldolase 1 |
| arTal_v1_Chr5_+_5161724_5161724 | 0.49 |
AT5G15820.1
|
AT5G15820
|
RING/U-box superfamily protein |
| arTal_v1_Chr1_-_6677680_6677680 | 0.48 |
AT1G19310.1
|
AT1G19310
|
RING/U-box superfamily protein |
| arTal_v1_Chr3_+_16123426_16123426 | 0.48 |
AT3G44540.1
AT3G44540.3 |
FAR4
|
fatty acid reductase 4 |
| arTal_v1_Chr5_-_4626782_4626782 | 0.47 |
AT5G14345.1
|
ENODL21
|
early nodulin-like protein 21 |
| arTal_v1_Chr5_+_9658422_9658422 | 0.47 |
AT5G27360.5
|
SFP2
|
Major facilitator superfamily protein |
| arTal_v1_Chr2_-_16198577_16198577 | 0.47 |
AT2G38750.1
|
ANNAT4
|
annexin 4 |
| arTal_v1_Chr1_-_436922_436922 | 0.47 |
AT1G02230.1
|
NAC004
|
NAC domain containing protein 4 |
| arTal_v1_Chr4_+_9928587_9928587 | 0.47 |
AT4G17870.1
|
PYR1
|
Polyketide cyclase/dehydrase and lipid transport superfamily protein |
| arTal_v1_Chr5_-_3517035_3517035 | 0.47 |
AT5G11070.1
|
AT5G11070
|
hypothetical protein |
| arTal_v1_Chr4_-_17355891_17356037 | 0.46 |
AT4G36850.3
AT4G36850.4 AT4G36850.2 AT4G36850.1 |
AT4G36850
|
PQ-loop repeat family protein / transmembrane family protein |
| arTal_v1_Chr5_-_671687_671687 | 0.46 |
AT5G02890.1
|
AT5G02890
|
HXXXD-type acyl-transferase family protein |
| arTal_v1_Chr2_-_16198832_16198832 | 0.46 |
AT2G38750.2
|
ANNAT4
|
annexin 4 |
| arTal_v1_Chr1_-_20967162_20967180 | 0.46 |
AT1G56060.2
AT1G56060.1 |
AT1G56060
|
cysteine-rich/transmembrane domain protein B |
| arTal_v1_Chr5_+_22175461_22175461 | 0.46 |
AT5G54585.1
|
AT5G54585
|
hypothetical protein |
| arTal_v1_Chr1_-_24171502_24171635 | 0.45 |
AT1G65060.2
AT1G65060.1 |
4CL3
|
4-coumarate:CoA ligase 3 |
| arTal_v1_Chr5_+_22196287_22196287 | 0.45 |
AT5G54640.1
|
RAT5
|
Histone superfamily protein |
| arTal_v1_Chr5_+_23420184_23420184 | 0.45 |
AT5G57800.1
|
CER3
|
Fatty acid hydroxylase superfamily |
| arTal_v1_Chr1_-_28284036_28284168 | 0.45 |
AT1G75380.3
AT1G75380.1 AT1G75380.2 AT1G75380.4 |
BBD1
|
bifunctional nuclease in basal defense response 1 |
| arTal_v1_Chr1_-_5003637_5003637 | 0.45 |
AT1G14600.1
|
AT1G14600
|
Homeodomain-like superfamily protein |
| arTal_v1_Chr5_+_20722069_20722069 | 0.45 |
AT5G50930.1
|
AT5G50930
|
Histone superfamily protein |
| arTal_v1_Chr5_-_22030060_22030099 | 0.44 |
AT5G54250.2
AT5G54250.1 AT5G54250.4 AT5G54250.3 |
CNGC4
|
cyclic nucleotide-gated cation channel 4 |
| arTal_v1_Chr4_-_7301646_7301646 | 0.44 |
AT4G12275.1
|
AT4G12275
|
|
| arTal_v1_Chr5_+_5497524_5497524 | 0.44 |
AT5G16730.1
|
AT5G16730
|
weak chloroplast movement under blue light protein (DUF827) |
| arTal_v1_Chr2_+_1071453_1071509 | 0.44 |
AT2G03530.3
AT2G03530.1 AT2G03530.5 AT2G03530.4 |
UPS2
|
ureide permease 2 |
| arTal_v1_Chr5_-_9247540_9247540 | 0.44 |
AT5G26340.1
|
MSS1
|
Major facilitator superfamily protein |
| arTal_v1_Chr4_-_14009287_14009287 | 0.44 |
AT4G28270.1
|
RMA2
|
RING membrane-anchor 2 |
| arTal_v1_Chr4_+_5448049_5448049 | 0.44 |
AT4G08555.1
|
AT4G08555
|
hypothetical protein |
| arTal_v1_Chr5_-_16135347_16135393 | 0.44 |
AT5G40340.2
AT5G40340.1 |
AT5G40340
|
Tudor/PWWP/MBT superfamily protein |
| arTal_v1_Chr1_+_8006064_8006064 | 0.44 |
AT1G22640.1
AT1G22640.2 |
MYB3
|
myb domain protein 3 |
| arTal_v1_Chr1_-_11116195_11116195 | 0.44 |
AT1G31130.1
|
AT1G31130
|
polyadenylate-binding protein 1-B-binding protein |
| arTal_v1_Chr3_-_5297851_5297851 | 0.44 |
AT3G15630.1
|
AT3G15630
|
plant/protein |
| arTal_v1_Chr1_+_2032338_2032338 | 0.44 |
AT1G06640.3
AT1G06640.2 |
AT1G06640
|
2-oxoglutarate (2OG) and Fe(II)-dependent oxygenase superfamily protein |
| arTal_v1_Chr1_+_23577329_23577329 | 0.43 |
AT1G63580.1
|
AT1G63580
|
Receptor-like protein kinase-related family protein |
| arTal_v1_Chr5_-_17962276_17962276 | 0.43 |
AT5G44568.1
|
AT5G44568
|
transmembrane protein |
| arTal_v1_Chr3_+_8743113_8743113 | 0.43 |
AT3G24190.1
|
AT3G24190
|
Protein kinase superfamily protein |
| arTal_v1_Chr4_+_11907355_11907355 | 0.43 |
AT4G22620.1
|
AT4G22620
|
SAUR-like auxin-responsive protein family |
| arTal_v1_Chr4_+_16521861_16521861 | 0.43 |
AT4G34590.1
|
GBF6
|
G-box binding factor 6 |
| arTal_v1_Chr4_+_10021786_10021786 | 0.43 |
AT4G18050.2
|
ABCB9
|
P-glycoprotein 9 |
| arTal_v1_Chr1_-_2007212_2007212 | 0.43 |
AT1G06550.1
|
AT1G06550
|
ATP-dependent caseinolytic (Clp) protease/crotonase family protein |
| arTal_v1_Chr5_+_7470328_7470443 | 0.42 |
AT5G22500.1
AT5G22500.2 |
FAR1
|
fatty acid reductase 1 |
| arTal_v1_Chr1_-_9935264_9935440 | 0.42 |
AT1G28330.3
AT1G28330.2 AT1G28330.4 AT1G28330.1 AT1G28330.6 AT1G28330.5 |
DYL1
|
dormancy-associated protein-like 1 |
| arTal_v1_Chr1_-_3328448_3328448 | 0.42 |
AT1G10155.1
|
PP2-A10
|
phloem protein 2-A10 |
| arTal_v1_Chr1_-_4026733_4026733 | 0.42 |
AT1G11925.1
|
AT1G11925
|
Stigma-specific Stig1 family protein |
| arTal_v1_Chr5_-_8011611_8011709 | 0.42 |
AT5G23750.2
AT5G23750.3 AT5G23750.1 |
AT5G23750
|
Remorin family protein |
| arTal_v1_Chr1_+_11738118_11738118 | 0.42 |
AT1G32460.1
|
AT1G32460
|
hypothetical protein |
| arTal_v1_Chr1_-_19789029_19789150 | 0.42 |
AT1G53100.2
AT1G53100.1 |
AT1G53100
|
Core-2/I-branching beta-1,6-N-acetylglucosaminyltransferase family protein |
| arTal_v1_Chr1_+_2031626_2031626 | 0.42 |
AT1G06640.1
|
AT1G06640
|
2-oxoglutarate (2OG) and Fe(II)-dependent oxygenase superfamily protein |
| arTal_v1_Chr1_+_8006423_8006423 | 0.42 |
AT1G22640.3
|
MYB3
|
myb domain protein 3 |
| arTal_v1_Chr4_-_13435723_13435770 | 0.42 |
AT4G26630.2
AT4G26630.1 |
AT4G26630
|
DEK domain-containing chromatin associated protein |
| arTal_v1_Chr5_-_18591474_18591506 | 0.42 |
AT5G45830.3
AT5G45830.2 AT5G45830.6 AT5G45830.4 AT5G45830.1 AT5G45830.5 |
DOG1
|
delay of germination 1 |
| arTal_v1_Chr5_-_573634_573634 | 0.41 |
AT5G02550.1
|
AT5G02550
|
hypothetical protein |
| arTal_v1_Chr5_-_23085246_23085246 | 0.41 |
AT5G57040.1
|
AT5G57040
|
Lactoylglutathione lyase / glyoxalase I family protein |
| arTal_v1_Chr5_-_7250770_7250770 | 0.41 |
AT5G21940.1
|
AT5G21940
|
hybrid signal transduction histidine kinase M-like protein |
| arTal_v1_Chr1_+_2169977_2169977 | 0.41 |
AT1G07080.1
|
AT1G07080
|
Thioredoxin superfamily protein |
| arTal_v1_Chr2_-_6710856_6710856 | 0.41 |
AT2G15390.1
|
FUT4
|
fucosyltransferase 4 |
| arTal_v1_Chr5_+_16151772_16151772 | 0.41 |
AT5G40380.3
AT5G40380.2 |
CRK42
|
cysteine-rich RLK (RECEPTOR-like protein kinase) 42 |
| arTal_v1_Chr1_-_20219452_20219452 | 0.41 |
AT1G54160.1
|
NF-YA5
|
nuclear factor Y, subunit A5 |
| arTal_v1_Chr4_+_10022205_10022205 | 0.41 |
AT4G18050.1
|
ABCB9
|
P-glycoprotein 9 |
| arTal_v1_Chr4_-_5162774_5162867 | 0.41 |
AT4G08160.2
AT4G08160.1 |
AT4G08160
|
glycosyl hydrolase family 10 protein / carbohydrate-binding domain-containing protein |
| arTal_v1_Chr3_+_20896332_20896332 | 0.41 |
AT3G56360.1
|
AT3G56360
|
hypothetical protein |
| arTal_v1_Chr1_+_3777236_3777236 | 0.40 |
AT1G11260.1
|
STP1
|
sugar transporter 1 |
| arTal_v1_Chr3_+_15993259_15993259 | 0.40 |
AT3G44320.1
|
NIT3
|
nitrilase 3 |
| arTal_v1_Chr3_-_8290164_8290164 | 0.40 |
AT3G23230.1
|
TDR1
|
Integrase-type DNA-binding superfamily protein |
| arTal_v1_Chr2_-_10487749_10487773 | 0.39 |
AT2G24650.1
AT2G24650.7 AT2G24650.2 AT2G24650.5 AT2G24650.4 AT2G24650.3 |
AT2G24650
|
B3 domain-containing protein REM13 |
| arTal_v1_Chr5_+_13419080_13419166 | 0.39 |
AT5G35170.1
AT5G35170.2 |
AT5G35170
|
adenylate kinase family protein |
| arTal_v1_Chr1_+_23200591_23200591 | 0.39 |
AT1G62660.4
|
AT1G62660
|
Glycosyl hydrolases family 32 protein |
| arTal_v1_Chr3_+_5571903_5571903 | 0.39 |
AT3G16410.1
|
NSP4
|
nitrile specifier protein 4 |
| arTal_v1_Chr5_-_22024658_22024658 | 0.39 |
AT5G54240.1
|
AT5G54240
|
membrane lipoprotein lipid attachment site-like protein, putative (DUF1223) |
| arTal_v1_Chr5_+_21386727_21386727 | 0.39 |
AT5G52760.1
AT5G52760.2 |
AT5G52760
|
Copper transport protein family |
| arTal_v1_Chr1_+_23199612_23199695 | 0.39 |
AT1G62660.2
AT1G62660.1 AT1G62660.3 |
AT1G62660
|
Glycosyl hydrolases family 32 protein |
| arTal_v1_Chr3_-_1257017_1257017 | 0.39 |
AT3G04620.1
|
DAN1
|
Alba DNA/RNA-binding protein |
| arTal_v1_Chr1_-_7940625_7940625 | 0.39 |
AT1G22490.2
|
AT1G22490
|
basic helix-loop-helix (bHLH) DNA-binding superfamily protein |
| arTal_v1_Chr5_-_8122784_8122914 | 0.38 |
AT5G24030.2
AT5G24030.1 |
SLAH3
|
SLAC1 homologue 3 |
| arTal_v1_Chr5_+_2237474_2237507 | 0.38 |
AT5G07190.1
AT5G07190.2 |
ATS3
|
embryo-specific protein 3 |
| arTal_v1_Chr3_+_18933751_18933751 | 0.38 |
AT3G50940.1
|
AT3G50940
|
P-loop containing nucleoside triphosphate hydrolases superfamily protein |
| arTal_v1_Chr2_-_12993269_12993416 | 0.38 |
AT2G30480.13
AT2G30480.2 AT2G30480.5 AT2G30480.10 AT2G30480.9 AT2G30480.3 AT2G30480.7 AT2G30480.8 |
AT2G30480
|
hypothetical protein |
| arTal_v1_Chr4_+_16295334_16295552 | 0.38 |
AT4G34000.2
AT4G34000.4 AT4G34000.3 AT4G34000.1 |
ABF3
|
abscisic acid responsive elements-binding factor 3 |
| arTal_v1_Chr1_-_25156389_25156389 | 0.38 |
AT1G67230.1
|
LINC1
|
little nuclei1 |
| arTal_v1_Chr4_+_18185437_18185437 | 0.38 |
AT4G39030.1
|
EDS5
|
MATE efflux family protein |
| arTal_v1_Chr3_+_16124021_16124021 | 0.38 |
AT3G44540.2
|
FAR4
|
fatty acid reductase 4 |
| arTal_v1_Chr3_-_21303230_21303230 | 0.38 |
AT3G57540.1
|
AT3G57540
|
Remorin family protein |
| arTal_v1_Chr2_+_12081023_12081113 | 0.38 |
AT2G28305.1
AT2G28305.3 AT2G28305.2 |
LOG1
|
Putative lysine decarboxylase family protein |
| arTal_v1_Chr2_-_265948_265948 | 0.38 |
AT2G01580.1
|
AT2G01580
|
transmembrane protein |
| arTal_v1_Chr2_+_3514668_3514774 | 0.37 |
AT2G07680.2
AT2G07680.3 AT2G07680.4 AT2G07680.1 AT2G07680.5 |
ABCC13
|
multidrug resistance-associated protein 11 |
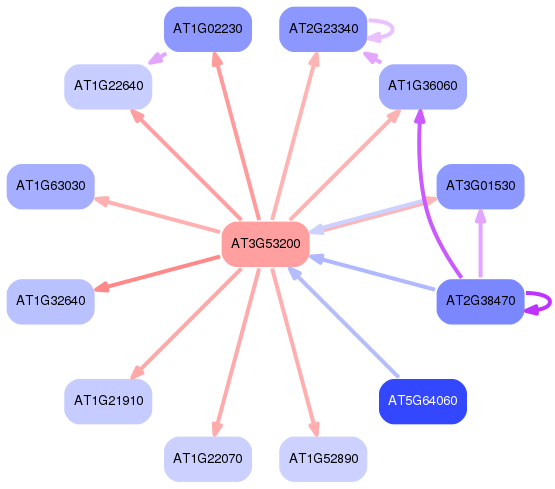
Network of associatons between targets according to the STRING database.

First level regulatory network of AT3G53200
Gene Ontology Analysis
Gene overrepresentation in biological process category:
| Log-likelihood per target | Total log-likelihood | Term | Description |
|---|---|---|---|
| 0.4 | 2.6 | GO:0006567 | threonine catabolic process(GO:0006567) |
| 0.4 | 1.3 | GO:0090224 | regulation of mitotic spindle organization(GO:0060236) regulation of spindle organization(GO:0090224) |
| 0.4 | 1.2 | GO:0006056 | cell wall mannoprotein biosynthetic process(GO:0000032) mannoprotein metabolic process(GO:0006056) mannoprotein biosynthetic process(GO:0006057) cell wall glycoprotein biosynthetic process(GO:0031506) |
| 0.3 | 1.1 | GO:0080170 | hydrogen peroxide transmembrane transport(GO:0080170) |
| 0.2 | 1.0 | GO:0007063 | regulation of sister chromatid cohesion(GO:0007063) |
| 0.2 | 0.7 | GO:0050687 | negative regulation of immune effector process(GO:0002698) negative regulation of defense response to virus(GO:0050687) |
| 0.2 | 1.2 | GO:0000301 | retrograde transport, vesicle recycling within Golgi(GO:0000301) |
| 0.2 | 0.7 | GO:0060776 | simple leaf morphogenesis(GO:0060776) |
| 0.2 | 0.9 | GO:0097298 | regulation of nucleus size(GO:0097298) |
| 0.2 | 1.0 | GO:0019419 | sulfate reduction(GO:0019419) |
| 0.2 | 1.3 | GO:0010438 | cellular response to sulfur starvation(GO:0010438) |
| 0.2 | 0.7 | GO:0015720 | allantoin transport(GO:0015720) |
| 0.2 | 0.5 | GO:0010124 | phenylacetate catabolic process(GO:0010124) |
| 0.2 | 0.7 | GO:2000692 | negative regulation of seed maturation(GO:2000692) |
| 0.2 | 0.7 | GO:0043618 | regulation of transcription from RNA polymerase II promoter in response to stress(GO:0043618) |
| 0.1 | 0.5 | GO:0099636 | cytoplasmic streaming(GO:0099636) |
| 0.1 | 1.0 | GO:0009061 | anaerobic respiration(GO:0009061) |
| 0.1 | 0.4 | GO:0010198 | synergid death(GO:0010198) |
| 0.1 | 0.4 | GO:0045905 | positive regulation of translational elongation(GO:0045901) positive regulation of translational termination(GO:0045905) |
| 0.1 | 0.5 | GO:0042759 | long-chain fatty acid biosynthetic process(GO:0042759) |
| 0.1 | 1.3 | GO:0015749 | monosaccharide transport(GO:0015749) |
| 0.1 | 0.2 | GO:0080182 | histone H3-K4 trimethylation(GO:0080182) |
| 0.1 | 0.4 | GO:0016120 | carotene biosynthetic process(GO:0016120) |
| 0.1 | 0.7 | GO:0019464 | glycine decarboxylation via glycine cleavage system(GO:0019464) |
| 0.1 | 0.7 | GO:0016103 | diterpenoid catabolic process(GO:0016103) gibberellin catabolic process(GO:0045487) |
| 0.1 | 0.6 | GO:0043447 | alkane biosynthetic process(GO:0043447) |
| 0.1 | 0.8 | GO:0090506 | axillary shoot meristem initiation(GO:0090506) |
| 0.1 | 0.3 | GO:0010432 | bract development(GO:0010432) |
| 0.1 | 1.5 | GO:0051553 | flavone biosynthetic process(GO:0051553) flavonol biosynthetic process(GO:0051555) |
| 0.1 | 0.7 | GO:0071249 | cellular response to nitrate(GO:0071249) |
| 0.1 | 0.2 | GO:0046166 | glyceraldehyde-3-phosphate biosynthetic process(GO:0046166) |
| 0.1 | 0.6 | GO:0080028 | nitrile metabolic process(GO:0050898) nitrile biosynthetic process(GO:0080028) |
| 0.1 | 0.6 | GO:0031930 | mitochondria-nucleus signaling pathway(GO:0031930) |
| 0.1 | 0.9 | GO:0071712 | ER-associated misfolded protein catabolic process(GO:0071712) |
| 0.1 | 0.6 | GO:0031222 | arabinan catabolic process(GO:0031222) |
| 0.1 | 0.7 | GO:0051410 | detoxification of nitrogen compound(GO:0051410) |
| 0.1 | 0.4 | GO:2001295 | malonyl-CoA biosynthetic process(GO:2001295) |
| 0.1 | 0.2 | GO:0010069 | zygote asymmetric cytokinesis in embryo sac(GO:0010069) |
| 0.1 | 0.4 | GO:1900367 | positive regulation of defense response to insect(GO:1900367) |
| 0.1 | 0.3 | GO:0007043 | cell-cell junction assembly(GO:0007043) |
| 0.1 | 1.4 | GO:0031408 | oxylipin biosynthetic process(GO:0031408) |
| 0.1 | 0.2 | GO:0034625 | fatty acid elongation, saturated fatty acid(GO:0019367) fatty acid elongation, unsaturated fatty acid(GO:0019368) fatty acid elongation, monounsaturated fatty acid(GO:0034625) fatty acid elongation, polyunsaturated fatty acid(GO:0034626) |
| 0.1 | 1.0 | GO:0045493 | xylan catabolic process(GO:0045493) |
| 0.1 | 0.2 | GO:0002215 | defense response to nematode(GO:0002215) |
| 0.1 | 0.4 | GO:0015846 | polyamine transport(GO:0015846) |
| 0.1 | 0.3 | GO:0000084 | mitotic G1 phase(GO:0000080) mitotic S phase(GO:0000084) mitotic G2 phase(GO:0000085) G1 phase(GO:0051318) G2 phase(GO:0051319) S phase(GO:0051320) interphase(GO:0051325) mitotic interphase(GO:0051329) |
| 0.1 | 0.2 | GO:0002100 | tRNA wobble adenosine to inosine editing(GO:0002100) |
| 0.1 | 0.6 | GO:0016123 | xanthophyll biosynthetic process(GO:0016123) |
| 0.1 | 0.2 | GO:0051973 | positive regulation of telomerase activity(GO:0051973) |
| 0.1 | 0.4 | GO:0010018 | far-red light signaling pathway(GO:0010018) |
| 0.1 | 0.2 | GO:0010351 | lithium ion transport(GO:0010351) |
| 0.1 | 0.2 | GO:1902457 | negative regulation of stomatal opening(GO:1902457) |
| 0.1 | 0.2 | GO:0048833 | specification of organ number(GO:0048832) specification of floral organ number(GO:0048833) |
| 0.1 | 0.5 | GO:0010304 | PSII associated light-harvesting complex II catabolic process(GO:0010304) |
| 0.1 | 1.3 | GO:0009862 | systemic acquired resistance, salicylic acid mediated signaling pathway(GO:0009862) |
| 0.1 | 0.2 | GO:0090322 | regulation of superoxide metabolic process(GO:0090322) |
| 0.1 | 0.2 | GO:0006419 | alanyl-tRNA aminoacylation(GO:0006419) |
| 0.1 | 0.2 | GO:0009915 | phloem sucrose loading(GO:0009915) |
| 0.1 | 0.3 | GO:0043692 | monoterpene metabolic process(GO:0043692) |
| 0.1 | 0.2 | GO:0010213 | non-photoreactive DNA repair(GO:0010213) |
| 0.0 | 0.2 | GO:0006097 | glyoxylate cycle(GO:0006097) |
| 0.0 | 0.5 | GO:1902584 | positive regulation of response to water deprivation(GO:1902584) |
| 0.0 | 0.1 | GO:0044277 | cell wall modification involved in abscission(GO:0009830) cell wall disassembly(GO:0044277) |
| 0.0 | 0.2 | GO:0010500 | transmitting tissue development(GO:0010500) |
| 0.0 | 0.6 | GO:2000122 | negative regulation of stomatal complex development(GO:2000122) |
| 0.0 | 0.2 | GO:0016255 | attachment of GPI anchor to protein(GO:0016255) |
| 0.0 | 0.5 | GO:0010077 | maintenance of inflorescence meristem identity(GO:0010077) |
| 0.0 | 1.6 | GO:0016126 | sterol biosynthetic process(GO:0016126) |
| 0.0 | 0.6 | GO:0045338 | farnesyl diphosphate metabolic process(GO:0045338) |
| 0.0 | 0.2 | GO:0006552 | leucine catabolic process(GO:0006552) |
| 0.0 | 0.2 | GO:0009303 | rRNA transcription(GO:0009303) |
| 0.0 | 0.2 | GO:0010482 | epidermal cell division(GO:0010481) regulation of epidermal cell division(GO:0010482) |
| 0.0 | 0.8 | GO:0009969 | xyloglucan biosynthetic process(GO:0009969) |
| 0.0 | 0.2 | GO:0080175 | phragmoplast microtubule organization(GO:0080175) |
| 0.0 | 0.2 | GO:0048629 | trichome patterning(GO:0048629) |
| 0.0 | 0.1 | GO:0033477 | S-methylmethionine metabolic process(GO:0033477) S-methylmethionine cycle(GO:0033528) |
| 0.0 | 0.2 | GO:0000256 | allantoin catabolic process(GO:0000256) |
| 0.0 | 0.6 | GO:1900057 | positive regulation of leaf senescence(GO:1900057) |
| 0.0 | 0.2 | GO:2000114 | regulation of establishment of cell polarity(GO:2000114) |
| 0.0 | 0.1 | GO:1902289 | negative regulation of defense response to oomycetes(GO:1902289) |
| 0.0 | 0.3 | GO:0016233 | telomere capping(GO:0016233) |
| 0.0 | 0.2 | GO:0010929 | positive regulation of auxin mediated signaling pathway(GO:0010929) |
| 0.0 | 0.2 | GO:0009268 | response to pH(GO:0009268) |
| 0.0 | 0.3 | GO:0010337 | regulation of salicylic acid metabolic process(GO:0010337) |
| 0.0 | 0.3 | GO:0034471 | rRNA 5'-end processing(GO:0000967) ncRNA 5'-end processing(GO:0034471) |
| 0.0 | 0.3 | GO:0080113 | regulation of seed growth(GO:0080113) |
| 0.0 | 0.8 | GO:0098869 | cellular oxidant detoxification(GO:0098869) |
| 0.0 | 1.3 | GO:0043622 | cortical microtubule organization(GO:0043622) |
| 0.0 | 0.4 | GO:0010262 | somatic embryogenesis(GO:0010262) |
| 0.0 | 1.1 | GO:0010584 | pollen exine formation(GO:0010584) |
| 0.0 | 0.5 | GO:0006574 | valine catabolic process(GO:0006574) |
| 0.0 | 0.3 | GO:0010371 | regulation of gibberellin biosynthetic process(GO:0010371) |
| 0.0 | 0.1 | GO:0043953 | protein transport by the Tat complex(GO:0043953) |
| 0.0 | 0.3 | GO:0010190 | cytochrome b6f complex assembly(GO:0010190) |
| 0.0 | 0.5 | GO:0070413 | trehalose metabolism in response to stress(GO:0070413) |
| 0.0 | 0.4 | GO:0009750 | response to fructose(GO:0009750) |
| 0.0 | 0.2 | GO:0042447 | cytokinin catabolic process(GO:0009823) hormone catabolic process(GO:0042447) |
| 0.0 | 0.5 | GO:2000032 | regulation of morphogenesis of a branching structure(GO:0060688) regulation of secondary shoot formation(GO:2000032) |
| 0.0 | 0.6 | GO:0010112 | regulation of systemic acquired resistance(GO:0010112) |
| 0.0 | 0.9 | GO:0010193 | response to ozone(GO:0010193) |
| 0.0 | 0.2 | GO:0043617 | cellular response to sucrose starvation(GO:0043617) |
| 0.0 | 0.1 | GO:0006369 | termination of RNA polymerase II transcription(GO:0006369) |
| 0.0 | 0.3 | GO:0045723 | positive regulation of fatty acid biosynthetic process(GO:0045723) |
| 0.0 | 0.4 | GO:0009697 | salicylic acid biosynthetic process(GO:0009697) |
| 0.0 | 0.2 | GO:0071168 | establishment of mitotic sister chromatid cohesion(GO:0034087) establishment of protein localization to chromosome(GO:0070199) rDNA condensation(GO:0070550) protein localization to chromatin(GO:0071168) establishment of protein localization to chromatin(GO:0071169) transcriptional activation by promoter-enhancer looping(GO:0071733) gene looping(GO:0090202) dsDNA loop formation(GO:0090579) |
| 0.0 | 0.1 | GO:0018871 | 1-aminocyclopropane-1-carboxylate metabolic process(GO:0018871) 1-aminocyclopropane-1-carboxylate biosynthetic process(GO:0042218) |
| 0.0 | 0.3 | GO:2000142 | negative regulation of protein complex assembly(GO:0031333) regulation of DNA-templated transcription, initiation(GO:2000142) |
| 0.0 | 0.2 | GO:0046717 | acid secretion(GO:0046717) |
| 0.0 | 0.3 | GO:0009423 | chorismate biosynthetic process(GO:0009423) |
| 0.0 | 0.1 | GO:0048451 | petal formation(GO:0048451) |
| 0.0 | 0.5 | GO:0006949 | syncytium formation(GO:0006949) |
| 0.0 | 0.1 | GO:0006103 | 2-oxoglutarate metabolic process(GO:0006103) |
| 0.0 | 0.2 | GO:0010189 | vitamin E biosynthetic process(GO:0010189) vitamin E metabolic process(GO:0042360) |
| 0.0 | 0.2 | GO:0010440 | stomatal lineage progression(GO:0010440) |
| 0.0 | 0.6 | GO:0071472 | cellular response to salt stress(GO:0071472) |
| 0.0 | 0.1 | GO:0042891 | tetracycline transport(GO:0015904) antibiotic transport(GO:0042891) toxin transport(GO:1901998) |
| 0.0 | 1.1 | GO:0010043 | response to zinc ion(GO:0010043) |
| 0.0 | 0.1 | GO:0009806 | lignan metabolic process(GO:0009806) lignan biosynthetic process(GO:0009807) |
| 0.0 | 0.3 | GO:0030307 | positive regulation of cell growth(GO:0030307) |
| 0.0 | 0.7 | GO:0050826 | response to freezing(GO:0050826) |
| 0.0 | 0.4 | GO:0001678 | cellular glucose homeostasis(GO:0001678) |
| 0.0 | 0.3 | GO:0046654 | tetrahydrofolate biosynthetic process(GO:0046654) |
| 0.0 | 0.2 | GO:0080027 | response to herbivore(GO:0080027) |
| 0.0 | 0.2 | GO:0051596 | lactate metabolic process(GO:0006089) methylglyoxal metabolic process(GO:0009438) methylglyoxal catabolic process to D-lactate via S-lactoyl-glutathione(GO:0019243) ketone catabolic process(GO:0042182) methylglyoxal catabolic process(GO:0051596) methylglyoxal catabolic process to lactate(GO:0061727) |
| 0.0 | 0.4 | GO:0031048 | chromatin silencing by small RNA(GO:0031048) |
| 0.0 | 0.1 | GO:0090059 | protoxylem development(GO:0090059) |
| 0.0 | 0.2 | GO:0006821 | chloride transport(GO:0006821) |
| 0.0 | 0.3 | GO:0030388 | fructose 1,6-bisphosphate metabolic process(GO:0030388) |
| 0.0 | 0.4 | GO:0006636 | unsaturated fatty acid biosynthetic process(GO:0006636) unsaturated fatty acid metabolic process(GO:0033559) |
| 0.0 | 0.4 | GO:2000033 | regulation of seed dormancy process(GO:2000033) |
| 0.0 | 0.3 | GO:0015833 | oligopeptide transport(GO:0006857) peptide transport(GO:0015833) |
| 0.0 | 0.1 | GO:0032957 | inositol trisphosphate metabolic process(GO:0032957) |
| 0.0 | 0.1 | GO:0000187 | activation of MAPK activity(GO:0000187) positive regulation of MAP kinase activity(GO:0043406) |
| 0.0 | 0.1 | GO:0071277 | cellular response to calcium ion(GO:0071277) |
| 0.0 | 0.1 | GO:1990428 | miRNA transport(GO:1990428) |
| 0.0 | 0.2 | GO:0009089 | lysine biosynthetic process via diaminopimelate(GO:0009089) diaminopimelate metabolic process(GO:0046451) |
| 0.0 | 0.3 | GO:0046653 | tetrahydrofolate metabolic process(GO:0046653) |
| 0.0 | 0.1 | GO:0055069 | zinc ion homeostasis(GO:0055069) |
| 0.0 | 0.3 | GO:0009685 | gibberellin metabolic process(GO:0009685) gibberellin biosynthetic process(GO:0009686) |
| 0.0 | 0.2 | GO:0080086 | stamen filament development(GO:0080086) |
| 0.0 | 2.1 | GO:0010200 | response to chitin(GO:0010200) |
| 0.0 | 0.4 | GO:0009612 | response to mechanical stimulus(GO:0009612) |
| 0.0 | 0.2 | GO:0006513 | protein monoubiquitination(GO:0006513) |
| 0.0 | 0.1 | GO:1902290 | positive regulation of defense response to oomycetes(GO:1902290) |
| 0.0 | 0.6 | GO:0010411 | xyloglucan metabolic process(GO:0010411) |
| 0.0 | 0.4 | GO:0006284 | base-excision repair(GO:0006284) |
| 0.0 | 1.0 | GO:0007018 | microtubule-based movement(GO:0007018) |
| 0.0 | 0.2 | GO:0010158 | abaxial cell fate specification(GO:0010158) |
| 0.0 | 0.2 | GO:1905177 | tracheary element differentiation(GO:1905177) |
| 0.0 | 0.1 | GO:0042219 | glutathione catabolic process(GO:0006751) cellular modified amino acid catabolic process(GO:0042219) |
| 0.0 | 0.6 | GO:0009911 | positive regulation of flower development(GO:0009911) |
| 0.0 | 0.2 | GO:2000377 | regulation of reactive oxygen species metabolic process(GO:2000377) |
| 0.0 | 0.2 | GO:0006465 | signal peptide processing(GO:0006465) |
| 0.0 | 0.3 | GO:0042044 | water transport(GO:0006833) fluid transport(GO:0042044) |
| 0.0 | 0.1 | GO:0072659 | protein localization to plasma membrane(GO:0072659) protein localization to cell periphery(GO:1990778) |
| 0.0 | 0.2 | GO:0015918 | sterol transport(GO:0015918) |
| 0.0 | 0.1 | GO:0015850 | organic hydroxy compound transport(GO:0015850) |
| 0.0 | 0.3 | GO:1900150 | regulation of defense response to fungus(GO:1900150) |
| 0.0 | 0.2 | GO:0050779 | RNA destabilization(GO:0050779) mRNA destabilization(GO:0061157) |
| 0.0 | 0.3 | GO:0045492 | xylan biosynthetic process(GO:0045492) |
| 0.0 | 0.0 | GO:0046865 | isoprenoid transport(GO:0046864) terpenoid transport(GO:0046865) |
| 0.0 | 0.4 | GO:0042147 | retrograde transport, endosome to Golgi(GO:0042147) |
| 0.0 | 0.2 | GO:0019915 | lipid storage(GO:0019915) |
| 0.0 | 0.1 | GO:0010023 | proanthocyanidin biosynthetic process(GO:0010023) |
| 0.0 | 0.1 | GO:0008295 | spermidine biosynthetic process(GO:0008295) |
| 0.0 | 0.3 | GO:0006383 | transcription from RNA polymerase III promoter(GO:0006383) |
| 0.0 | 0.0 | GO:1900369 | negative regulation of gene silencing by RNA(GO:0060967) negative regulation of RNA interference(GO:1900369) |
| 0.0 | 0.2 | GO:0034314 | Arp2/3 complex-mediated actin nucleation(GO:0034314) |
| 0.0 | 0.1 | GO:0015937 | coenzyme A biosynthetic process(GO:0015937) |
| 0.0 | 0.1 | GO:0071423 | malate transmembrane transport(GO:0071423) |
| 0.0 | 0.1 | GO:0043967 | histone H4 acetylation(GO:0043967) |
| 0.0 | 0.1 | GO:0018202 | peptidyl-diphthamide metabolic process(GO:0017182) peptidyl-diphthamide biosynthetic process from peptidyl-histidine(GO:0017183) peptidyl-histidine modification(GO:0018202) |
| 0.0 | 0.1 | GO:0036297 | interstrand cross-link repair(GO:0036297) |
Gene overrepresentation in cellular component category:
| Log-likelihood per target | Total log-likelihood | Term | Description |
|---|---|---|---|
| 0.2 | 0.6 | GO:0043673 | pollen wall(GO:0043667) exine(GO:0043668) sexine(GO:0043673) columella(GO:0043674) |
| 0.1 | 0.7 | GO:0005960 | glycine cleavage complex(GO:0005960) |
| 0.1 | 0.4 | GO:0005652 | nuclear lamina(GO:0005652) |
| 0.1 | 0.5 | GO:0000153 | cytoplasmic ubiquitin ligase complex(GO:0000153) |
| 0.1 | 0.4 | GO:0000938 | GARP complex(GO:0000938) |
| 0.1 | 0.2 | GO:0009514 | glyoxysome(GO:0009514) |
| 0.1 | 0.8 | GO:0010005 | cortical microtubule, transverse to long axis(GO:0010005) |
| 0.1 | 1.1 | GO:0072686 | mitotic spindle(GO:0072686) |
| 0.1 | 0.7 | GO:1902562 | NuA4 histone acetyltransferase complex(GO:0035267) H4/H2A histone acetyltransferase complex(GO:0043189) H4 histone acetyltransferase complex(GO:1902562) |
| 0.1 | 1.1 | GO:0016602 | CCAAT-binding factor complex(GO:0016602) |
| 0.1 | 0.2 | GO:0010316 | pyrophosphate-dependent phosphofructokinase complex(GO:0010316) |
| 0.1 | 0.2 | GO:0000110 | nucleotide-excision repair factor 1 complex(GO:0000110) |
| 0.0 | 0.5 | GO:0000127 | transcription factor TFIIIC complex(GO:0000127) |
| 0.0 | 0.5 | GO:0000322 | storage vacuole(GO:0000322) protein storage vacuole(GO:0000326) |
| 0.0 | 0.2 | GO:0042765 | GPI-anchor transamidase complex(GO:0042765) |
| 0.0 | 0.3 | GO:0009538 | photosystem I reaction center(GO:0009538) |
| 0.0 | 0.8 | GO:0005871 | kinesin complex(GO:0005871) |
| 0.0 | 0.1 | GO:0032044 | DSIF complex(GO:0032044) |
| 0.0 | 0.3 | GO:0048226 | Casparian strip(GO:0048226) |
| 0.0 | 0.1 | GO:0033281 | TAT protein transport complex(GO:0033281) |
| 0.0 | 0.5 | GO:0034399 | nuclear periphery(GO:0034399) |
| 0.0 | 0.2 | GO:0030062 | mitochondrial alpha-ketoglutarate dehydrogenase complex(GO:0005947) mitochondrial tricarboxylic acid cycle enzyme complex(GO:0030062) |
| 0.0 | 0.2 | GO:0005776 | autophagosome(GO:0005776) |
| 0.0 | 0.1 | GO:0044545 | NSL complex(GO:0044545) |
| 0.0 | 0.0 | GO:0034457 | Mpp10 complex(GO:0034457) |
| 0.0 | 0.2 | GO:0009503 | thylakoid light-harvesting complex(GO:0009503) PSII associated light-harvesting complex II(GO:0009517) light-harvesting complex(GO:0030076) |
| 0.0 | 0.3 | GO:0019897 | extrinsic component of plasma membrane(GO:0019897) |
| 0.0 | 0.4 | GO:0009986 | cell surface(GO:0009986) |
| 0.0 | 2.1 | GO:0009705 | plant-type vacuole membrane(GO:0009705) |
| 0.0 | 0.2 | GO:0005885 | Arp2/3 protein complex(GO:0005885) |
| 0.0 | 0.2 | GO:0048471 | perinuclear region of cytoplasm(GO:0048471) |
| 0.0 | 0.2 | GO:0005788 | endoplasmic reticulum lumen(GO:0005788) |
| 0.0 | 0.1 | GO:0031205 | endoplasmic reticulum Sec complex(GO:0031205) |
| 0.0 | 0.1 | GO:0030127 | COPII vesicle coat(GO:0030127) |
Gene overrepresentation in molecular function category:
| Log-likelihood per target | Total log-likelihood | Term | Description |
|---|---|---|---|
| 0.5 | 2.6 | GO:0008732 | threonine aldolase activity(GO:0004793) L-allo-threonine aldolase activity(GO:0008732) |
| 0.4 | 1.2 | GO:0004476 | mannose-6-phosphate isomerase activity(GO:0004476) |
| 0.2 | 0.7 | GO:0016642 | glycine dehydrogenase (decarboxylating) activity(GO:0004375) oxidoreductase activity, acting on the CH-NH2 group of donors, disulfide as acceptor(GO:0016642) |
| 0.2 | 0.8 | GO:0009973 | adenylyl-sulfate reductase activity(GO:0009973) adenylyl-sulfate reductase (glutathione) activity(GO:0033741) |
| 0.2 | 0.9 | GO:0005544 | calcium-dependent phospholipid binding(GO:0005544) |
| 0.2 | 1.5 | GO:0004506 | squalene monooxygenase activity(GO:0004506) |
| 0.2 | 1.4 | GO:0080046 | quercetin 4'-O-glucosyltransferase activity(GO:0080046) |
| 0.2 | 0.5 | GO:0015204 | urea transmembrane transporter activity(GO:0015204) |
| 0.2 | 0.5 | GO:0071771 | octadecanal decarbonylase activity(GO:0009924) aldehyde decarbonylase activity(GO:0071771) aldehyde oxygenase (deformylating) activity(GO:1990465) |
| 0.1 | 0.7 | GO:0005355 | glucose transmembrane transporter activity(GO:0005355) |
| 0.1 | 1.3 | GO:0008379 | thioredoxin peroxidase activity(GO:0008379) peroxiredoxin activity(GO:0051920) |
| 0.1 | 0.9 | GO:0017110 | nucleoside-diphosphatase activity(GO:0017110) |
| 0.1 | 0.7 | GO:0005274 | allantoin uptake transmembrane transporter activity(GO:0005274) uracil:cation symporter activity(GO:0015505) uptake transmembrane transporter activity(GO:0015563) |
| 0.1 | 1.5 | GO:0047631 | ADP-ribose diphosphatase activity(GO:0047631) |
| 0.1 | 0.7 | GO:0080109 | indole-3-acetonitrile nitrile hydratase activity(GO:0080109) |
| 0.1 | 0.9 | GO:0004383 | guanylate cyclase activity(GO:0004383) |
| 0.1 | 0.3 | GO:0050736 | O-malonyltransferase activity(GO:0050736) |
| 0.1 | 1.3 | GO:0009815 | 1-aminocyclopropane-1-carboxylate oxidase activity(GO:0009815) |
| 0.1 | 0.3 | GO:0003849 | 3-deoxy-7-phosphoheptulonate synthase activity(GO:0003849) |
| 0.1 | 0.7 | GO:0010178 | IAA-amino acid conjugate hydrolase activity(GO:0010178) |
| 0.1 | 0.4 | GO:0010285 | L,L-diaminopimelate aminotransferase activity(GO:0010285) |
| 0.1 | 0.4 | GO:0004075 | biotin carboxylase activity(GO:0004075) |
| 0.1 | 1.1 | GO:0031176 | endo-1,4-beta-xylanase activity(GO:0031176) |
| 0.1 | 0.7 | GO:0052634 | gibberellin 2-beta-dioxygenase activity(GO:0045543) C-19 gibberellin 2-beta-dioxygenase activity(GO:0052634) |
| 0.1 | 0.3 | GO:0004150 | dihydroneopterin aldolase activity(GO:0004150) |
| 0.1 | 0.2 | GO:0019788 | NEDD8 transferase activity(GO:0019788) |
| 0.1 | 0.2 | GO:0010354 | homogentisate prenyltransferase activity(GO:0010354) |
| 0.1 | 0.2 | GO:0004807 | triose-phosphate isomerase activity(GO:0004807) |
| 0.1 | 0.2 | GO:0045430 | chalcone isomerase activity(GO:0045430) |
| 0.1 | 0.6 | GO:0004566 | beta-glucuronidase activity(GO:0004566) |
| 0.1 | 0.4 | GO:0004127 | cytidylate kinase activity(GO:0004127) |
| 0.1 | 0.2 | GO:0003995 | acyl-CoA dehydrogenase activity(GO:0003995) |
| 0.1 | 0.9 | GO:0015145 | monosaccharide transmembrane transporter activity(GO:0015145) |
| 0.1 | 0.8 | GO:0031127 | galactoside 2-alpha-L-fucosyltransferase activity(GO:0008107) alpha-(1,2)-fucosyltransferase activity(GO:0031127) |
| 0.1 | 0.7 | GO:0015112 | nitrate transmembrane transporter activity(GO:0015112) |
| 0.1 | 0.2 | GO:0052743 | inositol-polyphosphate 5-phosphatase activity(GO:0004445) inositol-1,3,4,5-tetrakisphosphate 5-phosphatase activity(GO:0052659) inositol tetrakisphosphate phosphatase activity(GO:0052743) |
| 0.1 | 0.3 | GO:0045544 | gibberellin 20-oxidase activity(GO:0045544) |
| 0.1 | 0.2 | GO:0052578 | alpha-farnesene synthase activity(GO:0052578) |
| 0.1 | 0.5 | GO:0003988 | acetyl-CoA C-acyltransferase activity(GO:0003988) |
| 0.1 | 0.2 | GO:0004813 | alanine-tRNA ligase activity(GO:0004813) |
| 0.1 | 0.3 | GO:0008430 | selenium binding(GO:0008430) |
| 0.1 | 0.3 | GO:0015203 | polyamine transmembrane transporter activity(GO:0015203) |
| 0.1 | 1.3 | GO:0010427 | abscisic acid binding(GO:0010427) |
| 0.1 | 0.2 | GO:0047334 | diphosphate-fructose-6-phosphate 1-phosphotransferase activity(GO:0047334) |
| 0.1 | 0.5 | GO:0003860 | 3-hydroxyisobutyryl-CoA hydrolase activity(GO:0003860) |
| 0.1 | 0.2 | GO:0071614 | linoleic acid epoxygenase activity(GO:0071614) |
| 0.0 | 0.7 | GO:0004332 | fructose-bisphosphate aldolase activity(GO:0004332) |
| 0.0 | 0.3 | GO:0045431 | flavonol synthase activity(GO:0045431) |
| 0.0 | 0.8 | GO:0015250 | water transmembrane transporter activity(GO:0005372) water channel activity(GO:0015250) |
| 0.0 | 0.4 | GO:0016647 | oxidoreductase activity, acting on the CH-NH group of donors, oxygen as acceptor(GO:0016647) |
| 0.0 | 0.4 | GO:0005536 | glucose binding(GO:0005536) mannokinase activity(GO:0019158) |
| 0.0 | 0.6 | GO:0016207 | 4-coumarate-CoA ligase activity(GO:0016207) |
| 0.0 | 0.8 | GO:0015174 | basic amino acid transmembrane transporter activity(GO:0015174) |
| 0.0 | 0.4 | GO:0051747 | cytosine C-5 DNA demethylase activity(GO:0051747) |
| 0.0 | 0.2 | GO:0015369 | calcium:proton antiporter activity(GO:0015369) |
| 0.0 | 0.3 | GO:0031177 | phosphopantetheine binding(GO:0031177) |
| 0.0 | 0.5 | GO:0046556 | xylan 1,4-beta-xylosidase activity(GO:0009044) alpha-L-arabinofuranosidase activity(GO:0046556) |
| 0.0 | 0.1 | GO:0047150 | S-adenosylmethionine-homocysteine S-methyltransferase activity(GO:0008898) betaine-homocysteine S-methyltransferase activity(GO:0047150) |
| 0.0 | 0.2 | GO:0004000 | adenosine deaminase activity(GO:0004000) tRNA-specific adenosine deaminase activity(GO:0008251) |
| 0.0 | 0.1 | GO:0010334 | sesquiterpene synthase activity(GO:0010334) |
| 0.0 | 0.2 | GO:0016629 | 12-oxophytodienoate reductase activity(GO:0016629) |
| 0.0 | 0.4 | GO:0004602 | glutathione peroxidase activity(GO:0004602) |
| 0.0 | 0.5 | GO:0016833 | oxo-acid-lyase activity(GO:0016833) |
| 0.0 | 0.2 | GO:0003863 | 3-methyl-2-oxobutanoate dehydrogenase (2-methylpropanoyl-transferring) activity(GO:0003863) |
| 0.0 | 0.1 | GO:0002151 | G-quadruplex RNA binding(GO:0002151) |
| 0.0 | 0.6 | GO:0010333 | terpene synthase activity(GO:0010333) |
| 0.0 | 0.3 | GO:0016872 | intramolecular lyase activity(GO:0016872) |
| 0.0 | 0.5 | GO:0003825 | alpha,alpha-trehalose-phosphate synthase (UDP-forming) activity(GO:0003825) |
| 0.0 | 0.2 | GO:0050105 | L-gulonolactone oxidase activity(GO:0050105) |
| 0.0 | 0.1 | GO:0015434 | cadmium-transporting ATPase activity(GO:0015434) zinc-exporting ATPase activity(GO:0016463) |
| 0.0 | 0.3 | GO:0098847 | single-stranded telomeric DNA binding(GO:0043047) sequence-specific single stranded DNA binding(GO:0098847) |
| 0.0 | 0.1 | GO:0016985 | mannan endo-1,4-beta-mannosidase activity(GO:0016985) |
| 0.0 | 0.1 | GO:0004594 | pantothenate kinase activity(GO:0004594) |
| 0.0 | 0.2 | GO:0004416 | hydroxyacylglutathione hydrolase activity(GO:0004416) |
| 0.0 | 0.1 | GO:0008297 | single-stranded DNA exodeoxyribonuclease activity(GO:0008297) |
| 0.0 | 0.2 | GO:0019139 | cytokinin dehydrogenase activity(GO:0019139) |
| 0.0 | 0.3 | GO:0016161 | beta-amylase activity(GO:0016161) |
| 0.0 | 0.1 | GO:0000062 | fatty-acyl-CoA binding(GO:0000062) |
| 0.0 | 0.3 | GO:0016847 | 1-aminocyclopropane-1-carboxylate synthase activity(GO:0016847) |
| 0.0 | 0.3 | GO:0033613 | activating transcription factor binding(GO:0033613) |
| 0.0 | 0.6 | GO:0004176 | ATP-dependent peptidase activity(GO:0004176) |
| 0.0 | 0.3 | GO:0042389 | omega-3 fatty acid desaturase activity(GO:0042389) |
| 0.0 | 0.2 | GO:0004031 | aldehyde oxidase activity(GO:0004031) |
| 0.0 | 0.7 | GO:0004089 | carbonate dehydratase activity(GO:0004089) |
| 0.0 | 0.7 | GO:0016682 | oxidoreductase activity, acting on diphenols and related substances as donors, oxygen as acceptor(GO:0016682) |
| 0.0 | 0.2 | GO:0047617 | acyl-CoA hydrolase activity(GO:0047617) |
| 0.0 | 0.4 | GO:0003746 | translation elongation factor activity(GO:0003746) |
| 0.0 | 0.2 | GO:0003886 | DNA (cytosine-5-)-methyltransferase activity(GO:0003886) |
| 0.0 | 0.4 | GO:0102338 | 3-oxo-arachidoyl-CoA synthase activity(GO:0102336) 3-oxo-cerotoyl-CoA synthase activity(GO:0102337) 3-oxo-lignoceronyl-CoA synthase activity(GO:0102338) |
| 0.0 | 0.1 | GO:0010279 | indole-3-acetic acid amido synthetase activity(GO:0010279) |
| 0.0 | 0.2 | GO:0032440 | 2-alkenal reductase [NAD(P)] activity(GO:0032440) |
| 0.0 | 0.2 | GO:0047216 | inositol 3-alpha-galactosyltransferase activity(GO:0047216) |
| 0.0 | 0.6 | GO:0016762 | xyloglucan:xyloglucosyl transferase activity(GO:0016762) |
| 0.0 | 0.1 | GO:0010280 | UDP-L-rhamnose synthase activity(GO:0010280) UDP-glucose 4,6-dehydratase activity(GO:0050377) |
| 0.0 | 0.1 | GO:0005365 | myo-inositol transmembrane transporter activity(GO:0005365) polyol transmembrane transporter activity(GO:0015166) |
| 0.0 | 0.4 | GO:0016702 | oxidoreductase activity, acting on single donors with incorporation of molecular oxygen, incorporation of two atoms of oxygen(GO:0016702) |
| 0.0 | 0.1 | GO:0017108 | 5'-flap endonuclease activity(GO:0017108) |
| 0.0 | 0.1 | GO:0008493 | tetracycline transporter activity(GO:0008493) toxin transporter activity(GO:0019534) antibiotic transporter activity(GO:0042895) |
| 0.0 | 2.1 | GO:0046982 | protein heterodimerization activity(GO:0046982) |
| 0.0 | 0.2 | GO:0016783 | sulfurtransferase activity(GO:0016783) |
| 0.0 | 0.5 | GO:0016597 | amino acid binding(GO:0016597) |
| 0.0 | 0.1 | GO:0000254 | C-4 methylsterol oxidase activity(GO:0000254) |
| 0.0 | 0.2 | GO:0008574 | ATP-dependent microtubule motor activity, plus-end-directed(GO:0008574) |
| 0.0 | 0.2 | GO:0004312 | fatty acid synthase activity(GO:0004312) |
| 0.0 | 0.2 | GO:0005504 | fatty acid binding(GO:0005504) |
| 0.0 | 0.1 | GO:0004069 | L-aspartate:2-oxoglutarate aminotransferase activity(GO:0004069) |
| 0.0 | 0.1 | GO:0004715 | non-membrane spanning protein tyrosine kinase activity(GO:0004715) |
| 0.0 | 0.1 | GO:0004614 | phosphoglucomutase activity(GO:0004614) |
| 0.0 | 0.3 | GO:0042973 | glucan endo-1,3-beta-D-glucosidase activity(GO:0042973) |
| 0.0 | 0.5 | GO:0044390 | ubiquitin-like protein conjugating enzyme binding(GO:0044390) |
| 0.0 | 0.4 | GO:0005179 | hormone activity(GO:0005179) |
| 0.0 | 0.9 | GO:0004197 | cysteine-type endopeptidase activity(GO:0004197) |
| 0.0 | 0.3 | GO:0017069 | snRNA binding(GO:0017069) |
| 0.0 | 0.2 | GO:0016813 | hydrolase activity, acting on carbon-nitrogen (but not peptide) bonds, in linear amidines(GO:0016813) |
| 0.0 | 0.1 | GO:0016635 | oxidoreductase activity, acting on the CH-CH group of donors, quinone or related compound as acceptor(GO:0016635) |
| 0.0 | 0.0 | GO:0047498 | calcium-dependent phospholipase A2 activity(GO:0047498) |
| 0.0 | 0.3 | GO:0032934 | sterol binding(GO:0032934) |
| 0.0 | 0.3 | GO:0030570 | carbon-oxygen lyase activity, acting on polysaccharides(GO:0016837) pectate lyase activity(GO:0030570) |
| 0.0 | 0.2 | GO:0080019 | fatty-acyl-CoA reductase (alcohol-forming) activity(GO:0080019) |
| 0.0 | 0.1 | GO:0016812 | hydrolase activity, acting on carbon-nitrogen (but not peptide) bonds, in cyclic amides(GO:0016812) |
| 0.0 | 0.4 | GO:0008266 | poly(U) RNA binding(GO:0008266) |
| 0.0 | 0.5 | GO:0008171 | O-methyltransferase activity(GO:0008171) |
| 0.0 | 0.7 | GO:0003777 | microtubule motor activity(GO:0003777) |
| 0.0 | 0.1 | GO:0070042 | rRNA (uridine) methyltransferase activity(GO:0016436) rRNA (uridine-N3-)-methyltransferase activity(GO:0070042) |
| 0.0 | 0.1 | GO:0046923 | ER retention sequence binding(GO:0046923) |
| 0.0 | 0.1 | GO:0017169 | CDP-alcohol phosphatidyltransferase activity(GO:0017169) |
| 0.0 | 0.1 | GO:0016308 | 1-phosphatidylinositol-4-phosphate 5-kinase activity(GO:0016308) |
| 0.0 | 0.1 | GO:0004708 | MAP kinase kinase activity(GO:0004708) |
| 0.0 | 0.6 | GO:0051213 | dioxygenase activity(GO:0051213) |
Gene overrepresentation in curated gene sets: canonical pathways category:
| Log-likelihood per target | Total log-likelihood | Term | Description |
|---|---|---|---|
| 0.4 | 1.3 | PID AURORA A PATHWAY | Aurora A signaling |
| 0.1 | 0.5 | PID ATF2 PATHWAY | ATF-2 transcription factor network |
| 0.1 | 0.3 | PID MYC REPRESS PATHWAY | Validated targets of C-MYC transcriptional repression |
| 0.1 | 0.2 | PID HIV NEF PATHWAY | HIV-1 Nef: Negative effector of Fas and TNF-alpha |
| 0.1 | 0.3 | PID BARD1 PATHWAY | BARD1 signaling events |
| 0.0 | 0.2 | NABA ECM GLYCOPROTEINS | Genes encoding structural ECM glycoproteins |
Gene overrepresentation in curated gene sets: REACTOME pathways category:
| Log-likelihood per target | Total log-likelihood | Term | Description |
|---|---|---|---|
| 0.1 | 0.3 | REACTOME TRANSCRIPTIONAL ACTIVITY OF SMAD2 SMAD3 SMAD4 HETEROTRIMER | Genes involved in Transcriptional activity of SMAD2/SMAD3:SMAD4 heterotrimer |
| 0.1 | 0.4 | REACTOME PEROXISOMAL LIPID METABOLISM | Genes involved in Peroxisomal lipid metabolism |
| 0.1 | 0.3 | REACTOME MITOTIC PROMETAPHASE | Genes involved in Mitotic Prometaphase |
| 0.1 | 0.2 | REACTOME NOD1 2 SIGNALING PATHWAY | Genes involved in NOD1/2 Signaling Pathway |
| 0.0 | 0.3 | REACTOME HOMOLOGOUS RECOMBINATION REPAIR OF REPLICATION INDEPENDENT DOUBLE STRAND BREAKS | Genes involved in Homologous recombination repair of replication-independent double-strand breaks |
| 0.0 | 0.2 | REACTOME FORMATION OF INCISION COMPLEX IN GG NER | Genes involved in Formation of incision complex in GG-NER |
| 0.0 | 0.2 | REACTOME GLUCOSE METABOLISM | Genes involved in Glucose metabolism |
| 0.0 | 0.1 | REACTOME BIOLOGICAL OXIDATIONS | Genes involved in Biological oxidations |
| 0.0 | 0.1 | REACTOME BIOSYNTHESIS OF THE N GLYCAN PRECURSOR DOLICHOL LIPID LINKED OLIGOSACCHARIDE LLO AND TRANSFER TO A NASCENT PROTEIN | Genes involved in Biosynthesis of the N-glycan precursor (dolichol lipid-linked oligosaccharide, LLO) and transfer to a nascent protein |
| 0.0 | 0.1 | REACTOME METABOLISM OF VITAMINS AND COFACTORS | Genes involved in Metabolism of vitamins and cofactors |
| 0.0 | 0.1 | REACTOME G1 PHASE | Genes involved in G1 Phase |