Project
GSE130291:vernalization in Arabidopsis thaliana
Navigation
Downloads
Results for AT3G46090
Z-value: 0.05
Transcription factors associated with AT3G46090
| Gene Symbol | Gene ID | Gene Info |
|---|---|---|
|
AT3G46090
|
AT3G46090 | C2H2 and C2HC zinc fingers superfamily protein |
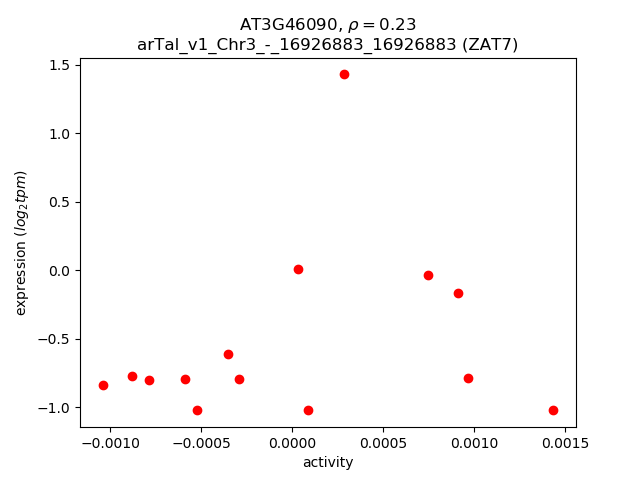
Activity-expression correlation:
| Gene | Promoter | Pearson corr. coef. | P-value | Plot |
|---|---|---|---|---|
| ZAT7 | arTal_v1_Chr3_-_16926883_16926883 | 0.23 | 4.2e-01 | Click! |
Activity profile of AT3G46090 motif
Sorted Z-values of AT3G46090 motif
| Promoter | Log-likelihood | Transcript | Gene | Gene Info |
|---|---|---|---|---|
| arTal_v1_Chr5_-_5741500_5741500 | 0.06 |
AT5G17420.1
|
IRX3
|
Cellulose synthase family protein |
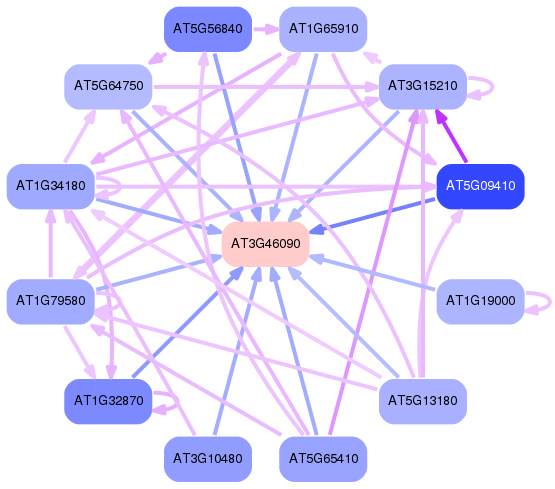
Network of associatons between targets according to the STRING database.

First level regulatory network of AT3G46090
Gene Ontology Analysis
Gene overrepresentation in biological process category:
| Log-likelihood per target | Total log-likelihood | Term | Description |
|---|---|---|---|
| 0.0 | 0.1 | GO:0010395 | rhamnogalacturonan I metabolic process(GO:0010395) |
Gene overrepresentation in cellular component category:
| Log-likelihood per target | Total log-likelihood | Term | Description |
|---|---|---|---|
| 0.0 | 0.1 | GO:0010330 | cellulose synthase complex(GO:0010330) |