Project
GSE130291:vernalization in Arabidopsis thaliana
Navigation
Downloads
Results for AT3G20310
Z-value: 1.48
Transcription factors associated with AT3G20310
| Gene Symbol | Gene ID | Gene Info |
|---|---|---|
|
AT3G20310
|
AT3G20310 | ethylene response factor 7 |
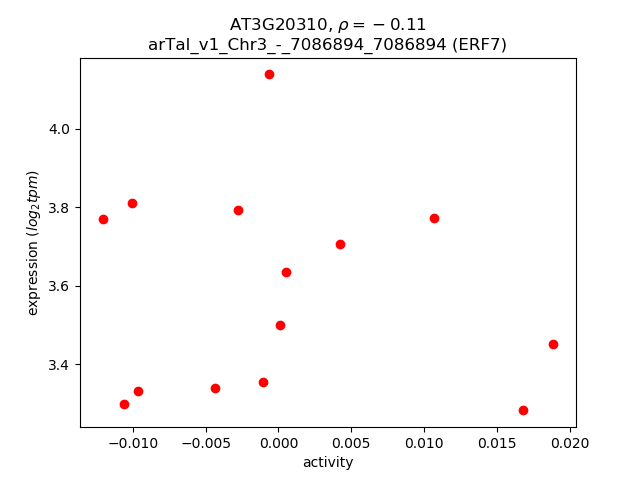
Activity-expression correlation:
| Gene | Promoter | Pearson corr. coef. | P-value | Plot |
|---|---|---|---|---|
| ERF7 | arTal_v1_Chr3_-_7086894_7086894 | -0.11 | 7.0e-01 | Click! |
Activity profile of AT3G20310 motif
Sorted Z-values of AT3G20310 motif
| Promoter | Log-likelihood | Transcript | Gene | Gene Info |
|---|---|---|---|---|
| arTal_v1_Chr4_+_9698940_9698940 | 2.33 |
AT4G17340.1
|
TIP2%3B2
|
tonoplast intrinsic protein 2;2 |
| arTal_v1_Chr5_+_6833564_6833659 | 2.30 |
AT5G20250.2
AT5G20250.1 AT5G20250.4 AT5G20250.3 |
DIN10
|
Raffinose synthase family protein |
| arTal_v1_Chr1_+_9829261_9829261 | 2.27 |
AT1G28135.1
|
AT1G28135
|
hypothetical protein |
| arTal_v1_Chr5_+_19434758_19434758 | 2.08 |
AT5G47990.1
|
CYP705A5
|
cytochrome P450, family 705, subfamily A, polypeptide 5 |
| arTal_v1_Chr4_-_12337599_12337599 | 1.99 |
AT4G23680.1
|
AT4G23680
|
Polyketide cyclase/dehydrase and lipid transport superfamily protein |
| arTal_v1_Chr5_-_19036938_19036938 | 1.78 |
AT5G46890.1
|
AT5G46890
|
Bifunctional inhibitor/lipid-transfer protein/seed storage 2S albumin superfamily protein |
| arTal_v1_Chr5_+_7664871_7664871 | 1.76 |
AT5G22920.2
AT5G22920.1 |
AT5G22920
|
CHY-type/CTCHY-type/RING-type Zinc finger protein |
| arTal_v1_Chr3_-_11194897_11194993 | 1.70 |
AT3G29250.2
AT3G29250.1 |
SDR4
|
NAD(P)-binding Rossmann-fold superfamily protein |
| arTal_v1_Chr5_+_19428888_19428888 | 1.59 |
AT5G47980.1
|
AT5G47980
|
HXXXD-type acyl-transferase family protein |
| arTal_v1_Chr1_+_29130375_29130375 | 1.55 |
AT1G77520.1
|
AT1G77520
|
O-methyltransferase family protein |
| arTal_v1_Chr1_-_5160179_5160179 | 1.51 |
AT1G14960.1
|
AT1G14960
|
Polyketide cyclase/dehydrase and lipid transport superfamily protein |
| arTal_v1_Chr5_+_8033665_8033738 | 1.49 |
AT5G23830.1
AT5G23830.2 |
AT5G23830
|
MD-2-related lipid recognition domain-containing protein |
| arTal_v1_Chr5_+_20891163_20891163 | 1.43 |
AT5G51440.1
|
AT5G51440
|
HSP20-like chaperones superfamily protein |
| arTal_v1_Chr3_-_12451556_12451556 | 1.41 |
AT3G30775.2
AT3G30775.1 |
ERD5
|
Methylenetetrahydrofolate reductase family protein |
| arTal_v1_Chr3_+_16770888_16770888 | 1.41 |
AT3G45680.1
|
AT3G45680
|
Major facilitator superfamily protein |
| arTal_v1_Chr2_-_14541617_14541617 | 1.36 |
AT2G34500.1
|
CYP710A1
|
cytochrome P450, family 710, subfamily A, polypeptide 1 |
| arTal_v1_Chr3_-_11195171_11195171 | 1.33 |
AT3G29250.3
|
SDR4
|
NAD(P)-binding Rossmann-fold superfamily protein |
| arTal_v1_Chr1_+_29135904_29135904 | 1.32 |
AT1G77530.1
AT1G77530.2 |
AT1G77530
|
O-methyltransferase family protein |
| arTal_v1_Chr2_+_13036814_13036925 | 1.32 |
AT2G30600.4
AT2G30600.5 AT2G30600.1 AT2G30600.3 |
AT2G30600
|
BTB/POZ domain-containing protein |
| arTal_v1_Chr5_+_23187840_23187840 | 1.31 |
AT5G57220.1
|
CYP81F2
|
cytochrome P450, family 81, subfamily F, polypeptide 2 |
| arTal_v1_Chr2_+_13037238_13037238 | 1.29 |
AT2G30600.6
AT2G30600.2 |
AT2G30600
|
BTB/POZ domain-containing protein |
| arTal_v1_Chr1_-_8075037_8075037 | 1.29 |
AT1G22810.1
|
AT1G22810
|
Integrase-type DNA-binding superfamily protein |
| arTal_v1_Chr4_+_6832650_6832650 | 1.29 |
AT4G11210.1
|
AT4G11210
|
Disease resistance-responsive (dirigent-like protein) family protein |
| arTal_v1_Chr5_-_8175431_8175525 | 1.29 |
AT5G24150.2
AT5G24150.1 |
SQP1
|
FAD/NAD(P)-binding oxidoreductase family protein |
| arTal_v1_Chr4_-_5648727_5648868 | 1.28 |
AT4G08870.2
AT4G08870.1 |
ARGAH2
|
Arginase/deacetylase superfamily protein |
| arTal_v1_Chr1_-_3398358_3398358 | 1.28 |
AT1G10370.1
|
ERD9
|
Glutathione S-transferase family protein |
| arTal_v1_Chr4_-_3065294_3065294 | 1.27 |
AT4G06477.1
|
AT4G06477
|
|
| arTal_v1_Chr4_-_14002069_14002124 | 1.26 |
AT4G28250.2
AT4G28250.3 AT4G28250.4 AT4G28250.1 |
EXPB3
|
expansin B3 |
| arTal_v1_Chr1_+_30241452_30241452 | 1.26 |
AT1G80440.1
|
AT1G80440
|
Galactose oxidase/kelch repeat superfamily protein |
| arTal_v1_Chr3_+_17879542_17879542 | 1.25 |
AT3G48280.1
|
CYP71A25
|
cytochrome P450, family 71, subfamily A, polypeptide 25 |
| arTal_v1_Chr1_-_2747936_2747967 | 1.25 |
AT1G08630.6
AT1G08630.7 AT1G08630.5 AT1G08630.2 |
THA1
|
threonine aldolase 1 |
| arTal_v1_Chr1_+_15081952_15081952 | 1.24 |
AT1G40104.1
|
AT1G40104
|
hypothetical protein |
| arTal_v1_Chr4_+_17852441_17852441 | 1.24 |
AT4G37980.2
AT4G37980.1 |
ELI3-1
|
cinnamyl alcohol dehydrogenase 7 |
| arTal_v1_Chr1_-_23137254_23137254 | 1.23 |
AT1G62510.1
|
AT1G62510
|
Bifunctional inhibitor/lipid-transfer protein/seed storage 2S albumin superfamily protein |
| arTal_v1_Chr2_+_3618058_3618058 | 1.22 |
AT2G08986.1
|
AT2G08986
|
hypothetical protein |
| arTal_v1_Chr2_-_16416736_16416845 | 1.21 |
AT2G39310.4
AT2G39310.3 AT2G39310.2 AT2G39310.1 |
JAL22
|
jacalin-related lectin 22 |
| arTal_v1_Chr3_-_17008528_17008528 | 1.21 |
AT3G46280.1
|
AT3G46280
|
kinase-like protein |
| arTal_v1_Chr3_+_7906521_7906521 | 1.20 |
AT3G22370.1
|
AOX1A
|
alternative oxidase 1A |
| arTal_v1_Chr4_+_9759203_9759203 | 1.20 |
AT4G17500.1
|
ERF-1
|
ethylene responsive element binding factor 1 |
| arTal_v1_Chr5_+_4488476_4488476 | 1.19 |
AT5G13930.1
|
TT4
|
Chalcone and stilbene synthase family protein |
| arTal_v1_Chr3_-_5625519_5625519 | 1.17 |
AT3G16530.1
|
AT3G16530
|
Legume lectin family protein |
| arTal_v1_Chr1_-_28549586_28549586 | 1.17 |
AT1G76080.1
|
CDSP32
|
chloroplastic drought-induced stress protein of 32 kD |
| arTal_v1_Chr5_-_15382071_15382071 | 1.15 |
AT5G38420.1
|
RBCS2B
|
Ribulose bisphosphate carboxylase (small chain) family protein |
| arTal_v1_Chr1_-_7388512_7388512 | 1.15 |
AT1G21100.1
|
IGMT1
|
O-methyltransferase family protein |
| arTal_v1_Chr5_+_23003909_23003909 | 1.15 |
AT5G56870.1
|
BGAL4
|
beta-galactosidase 4 |
| arTal_v1_Chr4_-_18275017_18275216 | 1.14 |
AT4G39260.4
AT4G39260.3 AT4G39260.2 AT4G39260.1 |
CCR1
|
cold, circadian rhythm, and RNA binding 1 |
| arTal_v1_Chr3_+_22142856_22142856 | 1.14 |
AT3G59940.1
|
AT3G59940
|
Galactose oxidase/kelch repeat superfamily protein |
| arTal_v1_Chr5_-_19542760_19542760 | 1.13 |
AT5G48180.1
|
NSP5
|
nitrile specifier protein 5 |
| arTal_v1_Chr4_+_13391293_13391344 | 1.12 |
AT4G26530.2
AT4G26530.1 |
FBA5
|
Aldolase superfamily protein |
| arTal_v1_Chr3_-_1758807_1758807 | 1.11 |
AT3G05890.1
|
RCI2B
|
Low temperature and salt responsive protein family |
| arTal_v1_Chr5_+_2803833_2803957 | 1.11 |
AT5G08640.1
AT5G08640.2 |
FLS1
|
flavonol synthase 1 |
| arTal_v1_Chr3_-_21293158_21293171 | 1.11 |
AT3G57520.2
AT3G57520.3 AT3G57520.1 |
SIP2
|
seed imbibition 2 |
| arTal_v1_Chr5_+_84474_84474 | 1.11 |
AT5G01210.1
|
AT5G01210
|
HXXXD-type acyl-transferase family protein |
| arTal_v1_Chr4_+_13390754_13390754 | 1.10 |
AT4G26530.3
|
FBA5
|
Aldolase superfamily protein |
| arTal_v1_Chr5_-_8181107_8181107 | 1.10 |
AT5G24155.2
AT5G24155.3 AT5G24155.1 |
AT5G24155
|
FAD/NAD(P)-binding oxidoreductase family protein |
| arTal_v1_Chr1_-_2190784_2190784 | 1.09 |
AT1G07135.1
|
AT1G07135
|
glycine-rich protein |
| arTal_v1_Chr3_+_10538005_10538105 | 1.08 |
AT3G28270.2
AT3G28270.1 |
AT3G28270
|
transmembrane protein, putative (DUF677) |
| arTal_v1_Chr3_-_2130451_2130451 | 1.08 |
AT3G06750.1
|
AT3G06750
|
hydroxyproline-rich glycoprotein family protein |
| arTal_v1_Chr2_+_13658888_13659004 | 1.07 |
AT2G32150.1
AT2G32150.2 AT2G32150.3 |
AT2G32150
|
Haloacid dehalogenase-like hydrolase (HAD) superfamily protein |
| arTal_v1_Chr5_-_8186662_8186704 | 1.07 |
AT5G24160.2
AT5G24160.1 |
SQE6
|
squalene monooxygenase 6 |
| arTal_v1_Chr5_-_17166032_17166032 | 1.07 |
AT5G42800.1
|
DFR
|
dihydroflavonol 4-reductase |
| arTal_v1_Chr5_-_15849108_15849141 | 1.06 |
AT5G39580.2
AT5G39580.1 |
AT5G39580
|
Peroxidase superfamily protein |
| arTal_v1_Chr4_-_9754161_9754161 | 1.06 |
AT4G17490.1
|
ERF6
|
ethylene responsive element binding factor 6 |
| arTal_v1_Chr1_+_6130025_6130025 | 1.05 |
AT1G17810.1
|
BETA-TIP
|
beta-tonoplast intrinsic protein |
| arTal_v1_Chr5_+_6414488_6414488 | 1.05 |
AT5G19120.1
|
AT5G19120
|
Eukaryotic aspartyl protease family protein |
| arTal_v1_Chr2_+_15110492_15110492 | 1.04 |
AT2G35980.1
|
YLS9
|
Late embryogenesis abundant (LEA) hydroxyproline-rich glycoprotein family |
| arTal_v1_Chr5_+_26573964_26573964 | 1.04 |
AT5G66590.1
|
AT5G66590
|
CAP (Cysteine-rich secretory proteins, Antigen 5, and Pathogenesis-related 1 protein) superfamily protein |
| arTal_v1_Chr4_-_17571743_17571743 | 1.03 |
AT4G37370.1
|
CYP81D8
|
cytochrome P450, family 81, subfamily D, polypeptide 8 |
| arTal_v1_Chr5_+_26266180_26266266 | 1.02 |
AT5G65690.1
AT5G65690.2 AT5G65690.3 AT5G65690.4 |
PCK2
|
phosphoenolpyruvate carboxykinase 2 |
| arTal_v1_Chr3_-_3993886_3993886 | 1.02 |
AT3G12580.1
|
HSP70
|
heat shock protein 70 |
| arTal_v1_Chr1_+_3664187_3664187 | 1.01 |
AT1G10960.1
|
FD1
|
ferredoxin 1 |
| arTal_v1_Chr5_-_25661007_25661007 | 1.01 |
AT5G64120.1
|
AT5G64120
|
Peroxidase superfamily protein |
| arTal_v1_Chr3_+_5505360_5505360 | 1.00 |
AT3G16240.1
|
DELTA-TIP
|
delta tonoplast integral protein |
| arTal_v1_Chr5_-_20016857_20016857 | 1.00 |
AT5G49360.1
|
BXL1
|
beta-xylosidase 1 |
| arTal_v1_Chr1_-_28920976_28920976 | 1.00 |
AT1G76960.1
|
AT1G76960
|
transmembrane protein |
| arTal_v1_Chr2_+_10559173_10559173 | 0.98 |
AT2G24762.1
|
GDU4
|
glutamine dumper 4 |
| arTal_v1_Chr5_-_15175566_15175566 | 0.98 |
AT5G38030.1
|
AT5G38030
|
MATE efflux family protein |
| arTal_v1_Chr2_+_15445294_15445294 | 0.98 |
AT2G36830.1
|
GAMMA-TIP
|
gamma tonoplast intrinsic protein |
| arTal_v1_Chr5_-_3172701_3172701 | 0.97 |
AT5G10130.1
|
AT5G10130
|
Pollen Ole e 1 allergen and extensin family protein |
| arTal_v1_Chr1_+_1244947_1244947 | 0.97 |
AT1G04560.1
|
AT1G04560
|
AWPM-19-like family protein |
| arTal_v1_Chr1_+_4084162_4084162 | 0.96 |
AT1G12080.1
AT1G12080.2 |
AT1G12080
|
Vacuolar calcium-binding protein-like protein |
| arTal_v1_Chr5_-_216773_216773 | 0.96 |
AT5G01550.1
|
LECRKA4.2
|
lectin receptor kinase a4.1 |
| arTal_v1_Chr1_-_8912642_8912642 | 0.96 |
AT1G25400.2
|
AT1G25400
|
transmembrane protein |
| arTal_v1_Chr5_+_430858_430877 | 0.95 |
AT5G02180.1
AT5G02180.2 |
AT5G02180
|
Transmembrane amino acid transporter family protein |
| arTal_v1_Chr1_-_8912822_8912822 | 0.95 |
AT1G25400.1
|
AT1G25400
|
transmembrane protein |
| arTal_v1_Chr3_-_9723904_9723904 | 0.94 |
AT3G26520.1
|
TIP2
|
tonoplast intrinsic protein 2 |
| arTal_v1_Chr4_-_17494279_17494279 | 0.94 |
AT4G37150.1
|
MES9
|
methyl esterase 9 |
| arTal_v1_Chr2_-_9062093_9062093 | 0.94 |
AT2G21140.1
|
PRP2
|
proline-rich protein 2 |
| arTal_v1_Chr4_-_12143833_12143858 | 0.94 |
AT4G23190.1
AT4G23190.2 AT4G23190.3 |
CRK11
|
cysteine-rich RLK (RECEPTOR-like protein kinase) 11 |
| arTal_v1_Chr4_+_12916926_12916926 | 0.94 |
AT4G25200.1
|
HSP23.6-MITO
|
mitochondrion-localized small heat shock protein 23.6 |
| arTal_v1_Chr2_+_16011233_16011233 | 0.93 |
AT2G38230.1
|
PDX1.1
|
pyridoxine biosynthesis 1.1 |
| arTal_v1_Chr1_+_20525654_20525654 | 0.93 |
AT1G55020.1
|
LOX1
|
lipoxygenase 1 |
| arTal_v1_Chr5_+_17760865_17760865 | 0.92 |
AT5G44130.1
|
FLA13
|
FASCICLIN-like arabinogalactan protein 13 precursor |
| arTal_v1_Chr3_-_17441242_17441242 | 0.92 |
AT3G47340.3
AT3G47340.2 |
ASN1
|
glutamine-dependent asparagine synthase 1 |
| arTal_v1_Chr3_+_3442237_3442237 | 0.92 |
AT3G10985.1
|
SAG20
|
senescence associated gene 20 |
| arTal_v1_Chr2_-_7768040_7768040 | 0.92 |
AT2G17880.1
|
AT2G17880
|
Chaperone DnaJ-domain superfamily protein |
| arTal_v1_Chr1_+_6568002_6568002 | 0.92 |
AT1G19020.1
|
AT1G19020
|
CDP-diacylglycerol-glycerol-3-phosphate 3-phosphatidyltransferase |
| arTal_v1_Chr1_+_12267808_12267808 | 0.92 |
AT1G33811.1
|
AT1G33811
|
GDSL-like Lipase/Acylhydrolase superfamily protein |
| arTal_v1_Chr1_+_2025544_2025544 | 0.92 |
AT1G06620.1
AT1G06620.2 |
AT1G06620
|
2-oxoglutarate (2OG) and Fe(II)-dependent oxygenase superfamily protein |
| arTal_v1_Chr5_-_8186100_8186100 | 0.91 |
AT5G24160.3
|
SQE6
|
squalene monooxygenase 6 |
| arTal_v1_Chr3_-_17441431_17441431 | 0.91 |
AT3G47340.1
|
ASN1
|
glutamine-dependent asparagine synthase 1 |
| arTal_v1_Chr3_-_4660945_4660945 | 0.90 |
AT3G14067.1
|
AT3G14067
|
Subtilase family protein |
| arTal_v1_Chr5_-_19629167_19629167 | 0.90 |
AT5G48430.1
|
AT5G48430
|
Eukaryotic aspartyl protease family protein |
| arTal_v1_Chr3_+_20354351_20354351 | 0.90 |
AT3G54940.3
AT3G54940.2 |
AT3G54940
|
Papain family cysteine protease |
| arTal_v1_Chr1_+_26654768_26654768 | 0.90 |
AT1G70700.3
AT1G70700.2 |
TIFY7
|
TIFY domain/Divergent CCT motif family protein |
| arTal_v1_Chr4_-_12170055_12170080 | 0.90 |
AT4G23260.1
AT4G23260.2 |
CRK18
|
cysteine-rich RLK (RECEPTOR-like protein kinase) 18 |
| arTal_v1_Chr3_-_21942571_21942571 | 0.89 |
AT3G59370.1
|
AT3G59370
|
Vacuolar calcium-binding protein-like protein |
| arTal_v1_Chr1_-_22589789_22589789 | 0.89 |
AT1G61255.1
|
AT1G61255
|
hypothetical protein |
| arTal_v1_Chr5_-_17831336_17831336 | 0.89 |
AT5G44260.1
|
AT5G44260
|
Zinc finger C-x8-C-x5-C-x3-H type family protein |
| arTal_v1_Chr3_-_5310988_5310988 | 0.89 |
AT3G15670.1
|
AT3G15670
|
Late embryogenesis abundant protein (LEA) family protein |
| arTal_v1_Chr3_+_604785_604785 | 0.89 |
AT3G02790.1
|
AT3G02790
|
zinc finger (C2H2 type) family protein |
| arTal_v1_Chr1_+_28746833_28746833 | 0.88 |
AT1G76600.1
|
AT1G76600
|
poly polymerase |
| arTal_v1_Chr1_-_1702749_1702749 | 0.87 |
AT1G05675.1
|
AT1G05675
|
UDP-Glycosyltransferase superfamily protein |
| arTal_v1_Chr1_-_575085_575085 | 0.87 |
AT1G02660.1
|
AT1G02660
|
alpha/beta-Hydrolases superfamily protein |
| arTal_v1_Chr5_+_8217191_8217213 | 0.87 |
AT5G24210.1
AT5G24210.2 AT5G24210.3 |
AT5G24210
|
alpha/beta-Hydrolases superfamily protein |
| arTal_v1_Chr4_+_7740283_7740283 | 0.87 |
AT4G13290.1
|
CYP71A19
|
cytochrome P450, family 71, subfamily A, polypeptide 19 |
| arTal_v1_Chr3_-_8064649_8064649 | 0.86 |
AT3G22800.1
|
AT3G22800
|
Leucine-rich repeat (LRR) family protein |
| arTal_v1_Chr4_-_17044555_17044599 | 0.86 |
AT4G36020.3
AT4G36020.1 AT4G36020.2 |
CSDP1
|
cold shock domain protein 1 |
| arTal_v1_Chr1_+_26654529_26654529 | 0.86 |
AT1G70700.1
|
TIFY7
|
TIFY domain/Divergent CCT motif family protein |
| arTal_v1_Chr2_-_16359943_16359943 | 0.86 |
AT2G39200.1
|
MLO12
|
Seven transmembrane MLO family protein |
| arTal_v1_Chr5_+_9050660_9050660 | 0.86 |
AT5G25930.1
|
AT5G25930
|
kinase family with leucine-rich repeat domain-containing protein |
| arTal_v1_Chr1_+_6832325_6832325 | 0.86 |
AT1G19770.1
|
PUP14
|
purine permease 14 |
| arTal_v1_Chr4_+_17752079_17752079 | 0.86 |
AT4G37770.1
|
ACS8
|
1-amino-cyclopropane-1-carboxylate synthase 8 |
| arTal_v1_Chr3_-_17440176_17440176 | 0.86 |
AT3G47340.4
|
ASN1
|
glutamine-dependent asparagine synthase 1 |
| arTal_v1_Chr4_+_14517393_14517393 | 0.85 |
AT4G29610.1
|
AT4G29610
|
Cytidine/deoxycytidylate deaminase family protein |
| arTal_v1_Chr5_+_5594632_5594724 | 0.85 |
AT5G17020.1
AT5G17020.2 |
XPO1A
|
exportin 1A |
| arTal_v1_Chr2_-_15160799_15160799 | 0.85 |
AT2G36100.1
|
CASP1
|
Uncharacterized protein family (UPF0497) |
| arTal_v1_Chr4_-_8415605_8415650 | 0.84 |
AT4G14680.2
AT4G14680.1 |
APS3
|
Pseudouridine synthase/archaeosine transglycosylase-like family protein |
| arTal_v1_Chr1_-_26796529_26796532 | 0.84 |
AT1G71030.1
AT1G71030.2 |
MYBL2
|
MYB-like 2 |
| arTal_v1_Chr5_+_22652715_22652715 | 0.84 |
AT5G55930.1
|
OPT1
|
oligopeptide transporter 1 |
| arTal_v1_Chr5_-_3278461_3278461 | 0.84 |
AT5G10430.1
|
AGP4
|
arabinogalactan protein 4 |
| arTal_v1_Chr4_+_14304921_14304921 | 0.84 |
AT4G29020.2
AT4G29020.1 |
AT4G29020
|
glycine-rich protein |
| arTal_v1_Chr3_+_5588459_5588486 | 0.84 |
AT3G16450.3
AT3G16450.1 |
JAL33
|
Mannose-binding lectin superfamily protein |
| arTal_v1_Chr1_-_27265806_27265806 | 0.84 |
AT1G72430.1
|
AT1G72430
|
SAUR-like auxin-responsive protein family |
| arTal_v1_Chr1_-_10720843_10720843 | 0.84 |
AT1G30370.1
|
DLAH
|
alpha/beta-Hydrolases superfamily protein |
| arTal_v1_Chr3_+_17520958_17521029 | 0.83 |
AT3G47540.1
AT3G47540.2 |
AT3G47540
|
Chitinase family protein |
| arTal_v1_Chr3_-_3420932_3420932 | 0.83 |
AT3G10930.1
|
AT3G10930
|
hypothetical protein |
| arTal_v1_Chr3_-_3091766_3091766 | 0.83 |
AT3G10020.2
|
AT3G10020
|
plant/protein |
| arTal_v1_Chr4_+_10375244_10375340 | 0.82 |
AT4G18950.1
AT4G18950.2 |
AT4G18950
|
Integrin-linked protein kinase family |
| arTal_v1_Chr5_-_24987811_24987811 | 0.82 |
AT5G62210.1
|
AT5G62210
|
Embryo-specific protein 3, (ATS3) |
| arTal_v1_Chr1_+_5204312_5204433 | 0.82 |
AT1G15125.1
AT1G15125.2 |
AT1G15125
|
S-adenosyl-L-methionine-dependent methyltransferases superfamily protein |
| arTal_v1_Chr3_+_5588292_5588292 | 0.82 |
AT3G16450.2
|
JAL33
|
Mannose-binding lectin superfamily protein |
| arTal_v1_Chr2_-_6920319_6920319 | 0.82 |
AT2G15880.1
|
AT2G15880
|
Leucine-rich repeat (LRR) family protein |
| arTal_v1_Chr5_-_16995062_16995062 | 0.81 |
AT5G42500.1
|
AT5G42500
|
Disease resistance-responsive (dirigent-like protein) family protein |
| arTal_v1_Chr5_+_26772644_26772644 | 0.81 |
AT5G67080.1
|
MAPKKK19
|
mitogen-activated protein kinase kinase kinase 19 |
| arTal_v1_Chr3_-_3059148_3059244 | 0.81 |
AT3G09940.2
AT3G09940.1 |
MDHAR
|
monodehydroascorbate reductase |
| arTal_v1_Chr2_+_13820909_13820909 | 0.81 |
AT2G32550.3
AT2G32550.1 |
AT2G32550
|
Cell differentiation, Rcd1-like protein |
| arTal_v1_Chr3_+_9208861_9208941 | 0.81 |
AT3G25290.1
AT3G25290.2 |
AT3G25290
|
Auxin-responsive family protein |
| arTal_v1_Chr5_+_3423381_3423381 | 0.81 |
AT5G10830.1
|
AT5G10830
|
S-adenosyl-L-methionine-dependent methyltransferases superfamily protein |
| arTal_v1_Chr5_+_834859_834859 | 0.81 |
AT5G03390.1
|
AT5G03390
|
hypothetical protein (DUF295) |
| arTal_v1_Chr4_+_11155453_11155460 | 0.81 |
AT4G20830.1
AT4G20830.2 |
AT4G20830
|
FAD-binding Berberine family protein |
| arTal_v1_Chr3_-_16448844_16448844 | 0.81 |
AT3G44990.1
|
XTH31
|
xyloglucan endo-transglycosylase-related 8 |
| arTal_v1_Chr5_-_23873691_23873849 | 0.81 |
AT5G59130.1
AT5G59130.2 AT5G59130.3 AT5G59130.4 |
AT5G59130
|
Subtilase family protein |
| arTal_v1_Chr2_-_14863412_14863412 | 0.80 |
AT2G35300.1
|
LEA18
|
Late embryogenesis abundant protein, group 1 protein |
| arTal_v1_Chr4_+_12686459_12686459 | 0.80 |
AT4G24570.1
|
DIC2
|
dicarboxylate carrier 2 |
| arTal_v1_Chr3_+_4462841_4462841 | 0.79 |
AT3G13650.1
|
AT3G13650
|
Disease resistance-responsive (dirigent-like protein) family protein |
| arTal_v1_Chr2_-_11710128_11710128 | 0.79 |
AT2G27370.1
|
CASP3
|
Uncharacterized protein family (UPF0497) |
| arTal_v1_Chr1_+_786832_786832 | 0.79 |
AT1G03220.1
|
AT1G03220
|
Eukaryotic aspartyl protease family protein |
| arTal_v1_Chr5_-_16943820_16943820 | 0.79 |
AT5G42380.1
|
CML37
|
calmodulin like 37 |
| arTal_v1_Chr1_+_11928757_11928757 | 0.79 |
AT1G32920.1
|
AT1G32920
|
hypothetical protein |
| arTal_v1_Chr2_+_13722362_13722427 | 0.78 |
AT2G32300.2
AT2G32300.1 |
UCC1
|
uclacyanin 1 |
| arTal_v1_Chr4_-_17355891_17356037 | 0.78 |
AT4G36850.3
AT4G36850.4 AT4G36850.2 AT4G36850.1 |
AT4G36850
|
PQ-loop repeat family protein / transmembrane family protein |
| arTal_v1_Chr5_-_3993767_3993767 | 0.78 |
AT5G12340.2
|
AT5G12340
|
DUF4228 domain protein |
| arTal_v1_Chr4_+_6869863_6869863 | 0.78 |
AT4G11290.1
|
AT4G11290
|
Peroxidase superfamily protein |
| arTal_v1_Chr4_-_8854706_8854706 | 0.77 |
AT4G15490.1
|
UGT84A3
|
UDP-Glycosyltransferase superfamily protein |
| arTal_v1_Chr5_+_8042853_8042876 | 0.77 |
AT5G23860.1
AT5G23860.2 |
TUB8
|
tubulin beta 8 |
| arTal_v1_Chr5_-_16174783_16174783 | 0.77 |
AT5G40420.1
|
OLEO2
|
oleosin 2 |
| arTal_v1_Chr2_-_9741463_9741463 | 0.77 |
AT2G22880.1
|
AT2G22880
|
VQ motif-containing protein |
| arTal_v1_Chr3_+_17897506_17897506 | 0.77 |
AT3G48340.1
|
CEP2
|
Cysteine proteinases superfamily protein |
| arTal_v1_Chr3_-_1261634_1261683 | 0.77 |
AT3G04640.2
AT3G04640.1 AT3G04640.3 |
AT3G04640
|
glycine-rich protein |
| arTal_v1_Chr1_+_4794664_4794756 | 0.77 |
AT1G13990.1
AT1G13990.2 AT1G13990.3 |
AT1G13990
|
plant/protein |
| arTal_v1_Chr4_+_13200593_13200593 | 0.77 |
AT4G26010.1
|
AT4G26010
|
Peroxidase superfamily protein |
| arTal_v1_Chr3_+_19090947_19090947 | 0.76 |
AT3G51450.1
|
AT3G51450
|
Calcium-dependent phosphotriesterase superfamily protein |
| arTal_v1_Chr2_+_17137829_17137846 | 0.76 |
AT2G41100.4
AT2G41100.7 |
TCH3
|
Calcium-binding EF hand family protein |
| arTal_v1_Chr5_-_753657_753657 | 0.76 |
AT5G03170.1
|
FLA11
|
FASCICLIN-like arabinogalactan-protein 11 |
| arTal_v1_Chr3_+_5187082_5187082 | 0.76 |
AT3G15357.1
|
AT3G15357
|
phosphopantothenoylcysteine decarboxylase subunit |
| arTal_v1_Chr2_+_18253610_18253610 | 0.76 |
AT2G44130.1
|
AT2G44130
|
Galactose oxidase/kelch repeat superfamily protein |
| arTal_v1_Chr4_+_14026577_14026577 | 0.76 |
AT4G28350.1
|
AT4G28350
|
Concanavalin A-like lectin protein kinase family protein |
| arTal_v1_Chr4_-_11134075_11134075 | 0.75 |
AT4G20780.1
|
CML42
|
calmodulin like 42 |
| arTal_v1_Chr5_+_1608988_1608988 | 0.75 |
AT5G05440.1
|
PYL5
|
Polyketide cyclase/dehydrase and lipid transport superfamily protein |
| arTal_v1_Chr4_-_12339967_12339967 | 0.75 |
AT4G23690.1
|
DIR6
|
Disease resistance-responsive (dirigent-like protein) family protein |
| arTal_v1_Chr4_-_7493080_7493080 | 0.75 |
AT4G12730.1
|
FLA2
|
FASCICLIN-like arabinogalactan 2 |
| arTal_v1_Chr2_+_17137427_17137431 | 0.75 |
AT2G41100.5
AT2G41100.6 |
TCH3
|
Calcium-binding EF hand family protein |
| arTal_v1_Chr1_-_8310916_8310916 | 0.75 |
AT1G23390.1
|
AT1G23390
|
Kelch repeat-containing F-box family protein |
| arTal_v1_Chr2_-_17441416_17441416 | 0.75 |
AT2G41810.1
|
AT2G41810
|
imidazolonepropionase (Protein of unknown function, DUF642) |
| arTal_v1_Chr3_-_3091922_3091922 | 0.75 |
AT3G10020.1
|
AT3G10020
|
plant/protein |
| arTal_v1_Chr1_+_9425280_9425280 | 0.75 |
AT1G27130.1
|
GSTU13
|
glutathione S-transferase tau 13 |
| arTal_v1_Chr2_+_12300203_12300203 | 0.75 |
AT2G28671.1
|
AT2G28671
|
hypothetical protein |
| arTal_v1_Chr3_-_790693_790693 | 0.75 |
AT3G03341.1
|
AT3G03341
|
cold-regulated protein |
| arTal_v1_Chr1_+_27141765_27141765 | 0.74 |
AT1G72140.1
|
AT1G72140
|
Major facilitator superfamily protein |
| arTal_v1_Chr2_+_19508929_19508929 | 0.74 |
AT2G47550.1
|
AT2G47550
|
Plant invertase/pectin methylesterase inhibitor superfamily |
| arTal_v1_Chr3_+_23266227_23266227 | 0.74 |
AT3G62950.1
|
AT3G62950
|
Thioredoxin superfamily protein |
| arTal_v1_Chr1_-_11548016_11548016 | 0.74 |
AT1G32100.1
|
PRR1
|
pinoresinol reductase 1 |
| arTal_v1_Chr4_-_12143476_12143476 | 0.74 |
AT4G23190.4
|
CRK11
|
cysteine-rich RLK (RECEPTOR-like protein kinase) 11 |
| arTal_v1_Chr1_+_24824356_24824496 | 0.74 |
AT1G66540.1
AT1G66540.2 |
AT1G66540
|
Cytochrome P450 superfamily protein |
| arTal_v1_Chr2_+_16049918_16049918 | 0.73 |
AT2G38310.1
|
PYL4
|
PYR1-like 4 |
| arTal_v1_Chr2_+_17409370_17409370 | 0.73 |
AT2G41730.1
|
AT2G41730
|
calcium-binding site protein |
| arTal_v1_Chr4_+_10254359_10254359 | 0.73 |
AT4G18620.1
|
PYL13
|
PYR1-like 13 |
| arTal_v1_Chr1_+_8709941_8709941 | 0.73 |
AT1G24580.1
|
AT1G24580
|
RING/U-box superfamily protein |
| arTal_v1_Chr2_+_17138330_17138330 | 0.73 |
AT2G41100.2
|
TCH3
|
Calcium-binding EF hand family protein |
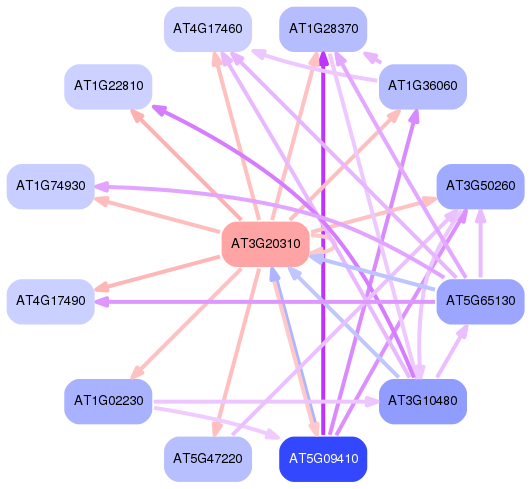
Network of associatons between targets according to the STRING database.

First level regulatory network of AT3G20310
Gene Ontology Analysis
Gene overrepresentation in biological process category:
| Log-likelihood per target | Total log-likelihood | Term | Description |
|---|---|---|---|
| 0.8 | 2.4 | GO:0015840 | urea transport(GO:0015840) |
| 0.7 | 2.8 | GO:0080003 | thalianol metabolic process(GO:0080003) |
| 0.5 | 2.6 | GO:0007043 | cell-cell junction assembly(GO:0007043) |
| 0.5 | 2.9 | GO:0043617 | cellular response to sucrose starvation(GO:0043617) |
| 0.5 | 2.9 | GO:0006567 | threonine catabolic process(GO:0006567) |
| 0.4 | 1.3 | GO:0000050 | urea cycle(GO:0000050) |
| 0.4 | 1.2 | GO:0010597 | green leaf volatile biosynthetic process(GO:0010597) |
| 0.4 | 2.0 | GO:0009806 | lignan metabolic process(GO:0009806) lignan biosynthetic process(GO:0009807) |
| 0.4 | 1.1 | GO:0033530 | raffinose metabolic process(GO:0033530) |
| 0.4 | 1.1 | GO:0080170 | hydrogen peroxide transmembrane transport(GO:0080170) |
| 0.4 | 3.5 | GO:0009652 | thigmotropism(GO:0009652) |
| 0.3 | 1.3 | GO:0097298 | regulation of nucleus size(GO:0097298) |
| 0.3 | 1.0 | GO:0010501 | RNA secondary structure unwinding(GO:0010501) |
| 0.3 | 1.3 | GO:0010185 | regulation of cellular defense response(GO:0010185) |
| 0.3 | 1.0 | GO:0010184 | cytokinin transport(GO:0010184) |
| 0.3 | 0.9 | GO:0000032 | cell wall mannoprotein biosynthetic process(GO:0000032) mannoprotein metabolic process(GO:0006056) mannoprotein biosynthetic process(GO:0006057) cell wall glycoprotein biosynthetic process(GO:0031506) |
| 0.3 | 5.0 | GO:0006030 | aminoglycan catabolic process(GO:0006026) chitin metabolic process(GO:0006030) chitin catabolic process(GO:0006032) amino sugar catabolic process(GO:0046348) glucosamine-containing compound catabolic process(GO:1901072) |
| 0.3 | 0.9 | GO:0019354 | siroheme biosynthetic process(GO:0019354) siroheme metabolic process(GO:0046156) |
| 0.3 | 0.9 | GO:0010124 | phenylacetate catabolic process(GO:0010124) |
| 0.3 | 0.9 | GO:0071422 | thiosulfate transport(GO:0015709) succinate transmembrane transport(GO:0071422) |
| 0.3 | 2.0 | GO:0010344 | seed oilbody biogenesis(GO:0010344) |
| 0.3 | 1.7 | GO:0006216 | cytidine catabolic process(GO:0006216) cytidine deamination(GO:0009972) cytidine metabolic process(GO:0046087) |
| 0.3 | 0.8 | GO:0010198 | synergid death(GO:0010198) |
| 0.3 | 1.6 | GO:0009759 | indole glucosinolate biosynthetic process(GO:0009759) |
| 0.3 | 1.3 | GO:0008615 | pyridoxine biosynthetic process(GO:0008615) |
| 0.2 | 0.7 | GO:0046459 | short-chain fatty acid metabolic process(GO:0046459) |
| 0.2 | 9.3 | GO:0016126 | sterol biosynthetic process(GO:0016126) |
| 0.2 | 0.7 | GO:0033528 | S-methylmethionine metabolic process(GO:0033477) S-methylmethionine cycle(GO:0033528) |
| 0.2 | 3.6 | GO:0080163 | regulation of protein serine/threonine phosphatase activity(GO:0080163) |
| 0.2 | 0.8 | GO:0070206 | protein trimerization(GO:0070206) |
| 0.2 | 1.0 | GO:0006307 | DNA dealkylation involved in DNA repair(GO:0006307) |
| 0.2 | 0.8 | GO:0010500 | transmitting tissue development(GO:0010500) |
| 0.2 | 2.0 | GO:0015749 | monosaccharide transport(GO:0015749) |
| 0.2 | 3.1 | GO:0042343 | indole glucosinolate metabolic process(GO:0042343) |
| 0.2 | 0.6 | GO:0009211 | deoxyribonucleoside triphosphate biosynthetic process(GO:0009202) pyrimidine deoxyribonucleoside triphosphate metabolic process(GO:0009211) pyrimidine deoxyribonucleotide metabolic process(GO:0009219) pyrimidine deoxyribonucleotide biosynthetic process(GO:0009221) 2'-deoxyribonucleotide biosynthetic process(GO:0009265) deoxyribose phosphate biosynthetic process(GO:0046385) |
| 0.2 | 1.5 | GO:0031222 | arabinan catabolic process(GO:0031222) |
| 0.2 | 0.5 | GO:0006097 | glyoxylate cycle(GO:0006097) |
| 0.2 | 3.2 | GO:0030388 | fructose 1,6-bisphosphate metabolic process(GO:0030388) |
| 0.2 | 0.7 | GO:0050792 | regulation of viral process(GO:0050792) |
| 0.2 | 0.5 | GO:1904580 | regulation of intracellular mRNA localization(GO:1904580) |
| 0.2 | 0.5 | GO:0055089 | fatty acid homeostasis(GO:0055089) |
| 0.2 | 0.8 | GO:0046825 | regulation of protein export from nucleus(GO:0046825) |
| 0.2 | 0.5 | GO:0034486 | vacuolar transmembrane transport(GO:0034486) |
| 0.2 | 1.2 | GO:0031930 | mitochondria-nucleus signaling pathway(GO:0031930) |
| 0.2 | 0.5 | GO:0060776 | simple leaf morphogenesis(GO:0060776) |
| 0.2 | 0.6 | GO:0097054 | L-glutamate biosynthetic process(GO:0097054) |
| 0.2 | 1.1 | GO:0006597 | spermine biosynthetic process(GO:0006597) |
| 0.2 | 1.0 | GO:0009099 | valine biosynthetic process(GO:0009099) |
| 0.2 | 0.8 | GO:0000965 | mitochondrial RNA 3'-end processing(GO:0000965) |
| 0.2 | 3.2 | GO:0031408 | oxylipin biosynthetic process(GO:0031408) |
| 0.2 | 1.3 | GO:0009061 | anaerobic respiration(GO:0009061) |
| 0.2 | 0.8 | GO:0010226 | response to lithium ion(GO:0010226) |
| 0.2 | 1.1 | GO:0019464 | glycine decarboxylation via glycine cleavage system(GO:0019464) |
| 0.2 | 0.5 | GO:0045901 | positive regulation of translational elongation(GO:0045901) positive regulation of translational termination(GO:0045905) |
| 0.1 | 0.4 | GO:0044259 | collagen metabolic process(GO:0032963) multicellular organism metabolic process(GO:0044236) multicellular organismal macromolecule metabolic process(GO:0044259) |
| 0.1 | 0.6 | GO:0099636 | cytoplasmic streaming(GO:0099636) |
| 0.1 | 1.3 | GO:0009939 | positive regulation of gibberellic acid mediated signaling pathway(GO:0009939) |
| 0.1 | 0.4 | GO:0010062 | negative regulation of cell fate specification(GO:0009996) negative regulation of trichoblast fate specification(GO:0010062) negative regulation of plant epidermal cell differentiation(GO:1903889) |
| 0.1 | 0.6 | GO:0010322 | regulation of isopentenyl diphosphate biosynthetic process, methylerythritol 4-phosphate pathway(GO:0010322) |
| 0.1 | 0.4 | GO:0015802 | basic amino acid transport(GO:0015802) |
| 0.1 | 1.0 | GO:0015837 | amine transport(GO:0015837) regulation of organic acid transport(GO:0032890) regulation of amine transport(GO:0051952) regulation of amino acid transport(GO:0051955) regulation of amino acid export(GO:0080143) |
| 0.1 | 0.7 | GO:1900384 | regulation of flavonol biosynthetic process(GO:1900384) |
| 0.1 | 0.5 | GO:0098740 | pollen tube adhesion(GO:0009865) cell-cell adhesion(GO:0098609) multi organism cell adhesion(GO:0098740) |
| 0.1 | 0.8 | GO:0031929 | TOR signaling(GO:0031929) |
| 0.1 | 0.9 | GO:0080148 | negative regulation of response to water deprivation(GO:0080148) |
| 0.1 | 0.3 | GO:1990937 | xylan acetylation(GO:1990937) |
| 0.1 | 2.1 | GO:0015833 | oligopeptide transport(GO:0006857) peptide transport(GO:0015833) |
| 0.1 | 0.7 | GO:0034051 | negative regulation of plant-type hypersensitive response(GO:0034051) |
| 0.1 | 0.3 | GO:0010581 | regulation of starch biosynthetic process(GO:0010581) |
| 0.1 | 2.0 | GO:1900057 | positive regulation of leaf senescence(GO:1900057) |
| 0.1 | 0.4 | GO:0010269 | response to selenium ion(GO:0010269) |
| 0.1 | 1.0 | GO:0016045 | detection of bacterium(GO:0016045) |
| 0.1 | 1.3 | GO:0009423 | chorismate biosynthetic process(GO:0009423) |
| 0.1 | 17.1 | GO:0010200 | response to chitin(GO:0010200) |
| 0.1 | 0.5 | GO:0042759 | long-chain fatty acid biosynthetic process(GO:0042759) |
| 0.1 | 0.4 | GO:0017145 | stem cell division(GO:0017145) |
| 0.1 | 0.4 | GO:0006571 | tyrosine biosynthetic process(GO:0006571) |
| 0.1 | 0.4 | GO:0001887 | selenium compound metabolic process(GO:0001887) |
| 0.1 | 1.3 | GO:0032366 | intracellular sterol transport(GO:0032366) |
| 0.1 | 0.7 | GO:0009745 | sucrose mediated signaling(GO:0009745) |
| 0.1 | 1.1 | GO:0060359 | response to ammonium ion(GO:0060359) |
| 0.1 | 0.7 | GO:1901001 | negative regulation of response to salt stress(GO:1901001) |
| 0.1 | 1.2 | GO:0080028 | nitrile metabolic process(GO:0050898) nitrile biosynthetic process(GO:0080028) |
| 0.1 | 0.4 | GO:0006022 | aminoglycan metabolic process(GO:0006022) |
| 0.1 | 0.4 | GO:0006419 | alanyl-tRNA aminoacylation(GO:0006419) |
| 0.1 | 0.5 | GO:0051014 | actin filament severing(GO:0051014) |
| 0.1 | 0.3 | GO:0051973 | positive regulation of telomerase activity(GO:0051973) |
| 0.1 | 0.8 | GO:0042981 | apoptotic process(GO:0006915) regulation of apoptotic process(GO:0042981) negative regulation of apoptotic process(GO:0043066) |
| 0.1 | 0.2 | GO:0090646 | mitochondrial tRNA processing(GO:0090646) |
| 0.1 | 0.4 | GO:0019499 | cyanide metabolic process(GO:0019499) |
| 0.1 | 0.5 | GO:0010438 | cellular response to sulfur starvation(GO:0010438) |
| 0.1 | 0.6 | GO:0006272 | leading strand elongation(GO:0006272) |
| 0.1 | 3.6 | GO:0009718 | anthocyanin-containing compound biosynthetic process(GO:0009718) |
| 0.1 | 0.2 | GO:0048281 | inflorescence morphogenesis(GO:0048281) |
| 0.1 | 0.4 | GO:0042989 | sequestering of actin monomers(GO:0042989) |
| 0.1 | 0.8 | GO:0009854 | oxidative photosynthetic carbon pathway(GO:0009854) |
| 0.1 | 0.7 | GO:0009187 | cyclic nucleotide metabolic process(GO:0009187) |
| 0.1 | 0.5 | GO:0042436 | tryptophan catabolic process(GO:0006569) indole-containing compound catabolic process(GO:0042436) indolalkylamine catabolic process(GO:0046218) |
| 0.1 | 0.3 | GO:0009143 | nucleoside triphosphate catabolic process(GO:0009143) |
| 0.1 | 0.4 | GO:0010606 | positive regulation of cytoplasmic mRNA processing body assembly(GO:0010606) |
| 0.1 | 0.2 | GO:0006449 | regulation of translational termination(GO:0006449) |
| 0.1 | 0.2 | GO:0006659 | phosphatidylserine metabolic process(GO:0006658) phosphatidylserine biosynthetic process(GO:0006659) |
| 0.1 | 0.9 | GO:0080086 | stamen filament development(GO:0080086) |
| 0.1 | 0.8 | GO:0007155 | cell adhesion(GO:0007155) biological adhesion(GO:0022610) |
| 0.1 | 0.2 | GO:0071466 | xenobiotic metabolic process(GO:0006805) cellular response to xenobiotic stimulus(GO:0071466) |
| 0.1 | 0.6 | GO:0051410 | detoxification of nitrogen compound(GO:0051410) |
| 0.1 | 0.6 | GO:0019408 | dolichol biosynthetic process(GO:0019408) |
| 0.1 | 1.0 | GO:0010262 | somatic embryogenesis(GO:0010262) |
| 0.1 | 0.4 | GO:0015720 | allantoin transport(GO:0015720) |
| 0.1 | 0.4 | GO:0016137 | glycoside metabolic process(GO:0016137) glycoside catabolic process(GO:0016139) |
| 0.1 | 1.6 | GO:0010600 | regulation of auxin biosynthetic process(GO:0010600) |
| 0.1 | 0.5 | GO:0046339 | diacylglycerol metabolic process(GO:0046339) |
| 0.1 | 0.7 | GO:0001676 | long-chain fatty acid metabolic process(GO:0001676) |
| 0.1 | 0.3 | GO:0010107 | potassium ion import(GO:0010107) potassium ion import across plasma membrane(GO:1990573) |
| 0.1 | 0.6 | GO:0051096 | regulation of helicase activity(GO:0051095) positive regulation of helicase activity(GO:0051096) |
| 0.1 | 0.6 | GO:0006013 | mannose metabolic process(GO:0006013) |
| 0.1 | 0.5 | GO:2000114 | regulation of establishment of cell polarity(GO:2000114) |
| 0.1 | 0.5 | GO:0046885 | regulation of hormone biosynthetic process(GO:0046885) |
| 0.1 | 0.4 | GO:0060860 | regulation of floral organ abscission(GO:0060860) negative regulation of floral organ abscission(GO:0060862) |
| 0.1 | 0.2 | GO:0009684 | indoleacetic acid biosynthetic process(GO:0009684) |
| 0.1 | 2.6 | GO:0010193 | response to ozone(GO:0010193) |
| 0.1 | 0.8 | GO:0006266 | DNA ligation(GO:0006266) |
| 0.1 | 0.3 | GO:0043433 | negative regulation of sequence-specific DNA binding transcription factor activity(GO:0043433) |
| 0.1 | 0.4 | GO:0007188 | G-protein coupled receptor signaling pathway, coupled to cyclic nucleotide second messenger(GO:0007187) adenylate cyclase-modulating G-protein coupled receptor signaling pathway(GO:0007188) |
| 0.1 | 0.8 | GO:0034085 | establishment of sister chromatid cohesion(GO:0034085) |
| 0.1 | 1.3 | GO:0009697 | salicylic acid biosynthetic process(GO:0009697) |
| 0.1 | 1.0 | GO:0010115 | regulation of abscisic acid biosynthetic process(GO:0010115) |
| 0.1 | 0.4 | GO:0048533 | sporocyte differentiation(GO:0048533) |
| 0.1 | 0.4 | GO:2001295 | malonyl-CoA biosynthetic process(GO:2001295) |
| 0.1 | 1.2 | GO:0006094 | gluconeogenesis(GO:0006094) |
| 0.1 | 0.3 | GO:1900378 | positive regulation of secondary metabolite biosynthetic process(GO:1900378) |
| 0.1 | 0.2 | GO:0040019 | positive regulation of embryonic development(GO:0040019) |
| 0.1 | 0.6 | GO:0043266 | regulation of potassium ion transport(GO:0043266) |
| 0.1 | 0.5 | GO:0006021 | inositol biosynthetic process(GO:0006021) |
| 0.1 | 1.0 | GO:0009554 | megasporogenesis(GO:0009554) |
| 0.1 | 1.0 | GO:0010160 | formation of organ boundary(GO:0010160) formation of anatomical boundary(GO:0048859) |
| 0.1 | 0.4 | GO:0006788 | heme oxidation(GO:0006788) |
| 0.1 | 0.4 | GO:0015969 | guanosine tetraphosphate metabolic process(GO:0015969) purine ribonucleoside bisphosphate metabolic process(GO:0034035) |
| 0.1 | 2.5 | GO:2000022 | regulation of jasmonic acid mediated signaling pathway(GO:2000022) |
| 0.1 | 0.3 | GO:0001113 | DNA-templated transcriptional open complex formation(GO:0001112) transcriptional open complex formation at RNA polymerase II promoter(GO:0001113) protein-DNA complex remodeling(GO:0001120) macromolecular complex remodeling(GO:0034367) |
| 0.1 | 0.2 | GO:0044208 | 'de novo' AMP biosynthetic process(GO:0044208) |
| 0.1 | 0.4 | GO:0070301 | cellular response to hydrogen peroxide(GO:0070301) |
| 0.1 | 0.8 | GO:0010196 | nonphotochemical quenching(GO:0010196) energy quenching(GO:1990066) |
| 0.1 | 0.3 | GO:0007035 | vacuolar acidification(GO:0007035) intracellular pH reduction(GO:0051452) |
| 0.1 | 0.4 | GO:0032309 | icosanoid secretion(GO:0032309) acid secretion(GO:0046717) arachidonic acid secretion(GO:0050482) icosanoid transport(GO:0071715) fatty acid derivative transport(GO:1901571) arachidonate transport(GO:1903963) |
| 0.1 | 0.2 | GO:0006517 | protein deglycosylation(GO:0006517) |
| 0.1 | 0.5 | GO:0090057 | root radial pattern formation(GO:0090057) |
| 0.1 | 0.5 | GO:1905177 | tracheary element differentiation(GO:1905177) |
| 0.1 | 0.3 | GO:0043407 | negative regulation of MAP kinase activity(GO:0043407) negative regulation of MAPK cascade(GO:0043409) |
| 0.1 | 1.4 | GO:0031048 | chromatin silencing by small RNA(GO:0031048) |
| 0.1 | 0.2 | GO:0010623 | programmed cell death involved in cell development(GO:0010623) |
| 0.1 | 2.8 | GO:0010208 | pollen wall assembly(GO:0010208) cellular component assembly involved in morphogenesis(GO:0010927) extracellular matrix assembly(GO:0085029) |
| 0.1 | 0.3 | GO:0000055 | ribosomal large subunit export from nucleus(GO:0000055) |
| 0.1 | 0.9 | GO:0010076 | maintenance of floral meristem identity(GO:0010076) |
| 0.1 | 0.3 | GO:0045332 | phospholipid translocation(GO:0045332) |
| 0.1 | 2.3 | GO:0045492 | xylan biosynthetic process(GO:0045492) |
| 0.1 | 0.2 | GO:0046102 | inosine catabolic process(GO:0006148) inosine metabolic process(GO:0046102) |
| 0.1 | 0.4 | GO:0072530 | purine-containing compound transmembrane transport(GO:0072530) |
| 0.1 | 0.7 | GO:2000122 | negative regulation of stomatal complex development(GO:2000122) |
| 0.1 | 0.3 | GO:0016120 | carotene biosynthetic process(GO:0016120) |
| 0.1 | 0.6 | GO:0009095 | aromatic amino acid family biosynthetic process, prephenate pathway(GO:0009095) |
| 0.1 | 0.2 | GO:0046391 | 5-phosphoribose 1-diphosphate biosynthetic process(GO:0006015) 5-phosphoribose 1-diphosphate metabolic process(GO:0046391) |
| 0.1 | 0.2 | GO:0035017 | cuticle pattern formation(GO:0035017) |
| 0.1 | 0.2 | GO:0033120 | positive regulation of RNA splicing(GO:0033120) |
| 0.1 | 0.3 | GO:0015714 | phosphoenolpyruvate transport(GO:0015714) |
| 0.1 | 0.5 | GO:1990778 | protein localization to cell periphery(GO:1990778) |
| 0.1 | 0.2 | GO:0043970 | histone H3-K9 acetylation(GO:0043970) |
| 0.1 | 0.3 | GO:0009268 | response to pH(GO:0009268) |
| 0.1 | 0.3 | GO:0010032 | meiotic chromosome condensation(GO:0010032) |
| 0.1 | 0.5 | GO:0080190 | lateral growth(GO:0080190) |
| 0.1 | 0.1 | GO:0032491 | detection of molecule of fungal origin(GO:0032491) |
| 0.1 | 0.1 | GO:0048445 | carpel morphogenesis(GO:0048445) |
| 0.1 | 0.3 | GO:0043570 | maintenance of DNA repeat elements(GO:0043570) |
| 0.1 | 0.3 | GO:0048830 | adventitious root development(GO:0048830) |
| 0.1 | 1.1 | GO:0006722 | triterpenoid metabolic process(GO:0006722) |
| 0.1 | 5.1 | GO:0045490 | pectin catabolic process(GO:0045490) |
| 0.1 | 0.2 | GO:0042539 | hypotonic salinity response(GO:0042539) |
| 0.1 | 0.2 | GO:0070898 | RNA polymerase III transcriptional preinitiation complex assembly(GO:0070898) |
| 0.1 | 0.3 | GO:0019079 | viral genome replication(GO:0019079) |
| 0.1 | 0.5 | GO:0090506 | axillary shoot meristem initiation(GO:0090506) |
| 0.1 | 0.4 | GO:0090059 | protoxylem development(GO:0090059) |
| 0.1 | 0.7 | GO:0009113 | purine nucleobase biosynthetic process(GO:0009113) |
| 0.1 | 0.1 | GO:0010045 | response to nickel cation(GO:0010045) |
| 0.1 | 0.4 | GO:0030307 | positive regulation of cell growth(GO:0030307) |
| 0.1 | 0.3 | GO:0010077 | maintenance of inflorescence meristem identity(GO:0010077) |
| 0.1 | 0.3 | GO:0016106 | sesquiterpenoid biosynthetic process(GO:0016106) |
| 0.1 | 0.3 | GO:0042549 | photosystem II stabilization(GO:0042549) |
| 0.1 | 0.2 | GO:0034058 | endosomal vesicle fusion(GO:0034058) |
| 0.1 | 0.2 | GO:0031468 | nuclear envelope reassembly(GO:0031468) |
| 0.1 | 0.2 | GO:0000256 | allantoin catabolic process(GO:0000256) |
| 0.1 | 0.7 | GO:0009901 | anther dehiscence(GO:0009901) |
| 0.1 | 0.2 | GO:0042908 | xenobiotic transport(GO:0042908) |
| 0.1 | 0.5 | GO:0000304 | response to singlet oxygen(GO:0000304) |
| 0.1 | 9.8 | GO:0071456 | cellular response to hypoxia(GO:0071456) |
| 0.1 | 0.9 | GO:0070413 | trehalose metabolism in response to stress(GO:0070413) |
| 0.1 | 0.4 | GO:0052482 | defense response by cell wall thickening(GO:0052482) |
| 0.1 | 1.5 | GO:0080092 | regulation of pollen tube growth(GO:0080092) |
| 0.1 | 0.4 | GO:0048354 | mucilage biosynthetic process involved in seed coat development(GO:0048354) |
| 0.1 | 1.3 | GO:0030150 | protein import into mitochondrial matrix(GO:0030150) |
| 0.1 | 0.4 | GO:0031936 | negative regulation of chromatin silencing(GO:0031936) |
| 0.1 | 0.5 | GO:0043928 | exonucleolytic nuclear-transcribed mRNA catabolic process involved in deadenylation-dependent decay(GO:0043928) |
| 0.1 | 0.6 | GO:0035336 | long-chain fatty-acyl-CoA metabolic process(GO:0035336) |
| 0.1 | 0.7 | GO:0045493 | xylan catabolic process(GO:0045493) |
| 0.0 | 0.8 | GO:0051762 | sesquiterpene biosynthetic process(GO:0051762) |
| 0.0 | 2.5 | GO:0010411 | xyloglucan metabolic process(GO:0010411) |
| 0.0 | 0.9 | GO:0019915 | lipid storage(GO:0019915) |
| 0.0 | 0.2 | GO:0080119 | ER body organization(GO:0080119) |
| 0.0 | 1.1 | GO:0006817 | phosphate ion transport(GO:0006817) |
| 0.0 | 2.2 | GO:0009834 | plant-type secondary cell wall biogenesis(GO:0009834) |
| 0.0 | 0.1 | GO:0002215 | defense response to nematode(GO:0002215) |
| 0.0 | 0.1 | GO:0006570 | tyrosine metabolic process(GO:0006570) |
| 0.0 | 0.3 | GO:0009823 | cytokinin catabolic process(GO:0009823) hormone catabolic process(GO:0042447) |
| 0.0 | 0.1 | GO:0042351 | 'de novo' GDP-L-fucose biosynthetic process(GO:0042351) |
| 0.0 | 0.4 | GO:0033314 | mitotic DNA replication checkpoint(GO:0033314) |
| 0.0 | 0.2 | GO:0048446 | petal morphogenesis(GO:0048446) |
| 0.0 | 0.1 | GO:0010272 | response to silver ion(GO:0010272) |
| 0.0 | 0.2 | GO:0080187 | floral organ senescence(GO:0080187) |
| 0.0 | 0.8 | GO:0006814 | sodium ion transport(GO:0006814) |
| 0.0 | 0.1 | GO:0071596 | ubiquitin-dependent protein catabolic process via the N-end rule pathway(GO:0071596) |
| 0.0 | 0.2 | GO:0010731 | protein glutathionylation(GO:0010731) |
| 0.0 | 0.5 | GO:0009970 | cellular response to sulfate starvation(GO:0009970) |
| 0.0 | 1.2 | GO:0099518 | vesicle transport along actin filament(GO:0030050) vesicle cytoskeletal trafficking(GO:0099518) |
| 0.0 | 0.2 | GO:0060919 | auxin influx(GO:0060919) |
| 0.0 | 0.2 | GO:0010603 | regulation of cytoplasmic mRNA processing body assembly(GO:0010603) |
| 0.0 | 0.2 | GO:0080113 | regulation of seed growth(GO:0080113) |
| 0.0 | 0.3 | GO:0080183 | response to photooxidative stress(GO:0080183) |
| 0.0 | 0.2 | GO:0070509 | calcium ion import(GO:0070509) |
| 0.0 | 0.2 | GO:0006426 | glycyl-tRNA aminoacylation(GO:0006426) |
| 0.0 | 0.2 | GO:0000727 | double-strand break repair via break-induced replication(GO:0000727) |
| 0.0 | 0.4 | GO:0002758 | immune response-activating signal transduction(GO:0002757) innate immune response-activating signal transduction(GO:0002758) immune response-regulating signaling pathway(GO:0002764) |
| 0.0 | 0.3 | GO:0048579 | negative regulation of long-day photoperiodism, flowering(GO:0048579) |
| 0.0 | 0.2 | GO:0032957 | inositol trisphosphate metabolic process(GO:0032957) |
| 0.0 | 1.1 | GO:0007166 | cell surface receptor signaling pathway(GO:0007166) |
| 0.0 | 0.4 | GO:1901957 | regulation of cutin biosynthetic process(GO:1901957) |
| 0.0 | 0.2 | GO:0009410 | response to xenobiotic stimulus(GO:0009410) |
| 0.0 | 1.1 | GO:0032508 | DNA duplex unwinding(GO:0032508) |
| 0.0 | 0.5 | GO:0009299 | mRNA transcription(GO:0009299) |
| 0.0 | 0.6 | GO:0019852 | L-ascorbic acid metabolic process(GO:0019852) |
| 0.0 | 0.1 | GO:0034767 | positive regulation of ion transmembrane transport(GO:0034767) |
| 0.0 | 0.1 | GO:0080151 | positive regulation of salicylic acid mediated signaling pathway(GO:0080151) |
| 0.0 | 0.2 | GO:0099515 | actin filament-based transport(GO:0099515) |
| 0.0 | 0.1 | GO:0010253 | UDP-rhamnose biosynthetic process(GO:0010253) UDP-rhamnose metabolic process(GO:0033478) |
| 0.0 | 0.4 | GO:0052542 | defense response by callose deposition(GO:0052542) |
| 0.0 | 0.2 | GO:0000244 | spliceosomal tri-snRNP complex assembly(GO:0000244) |
| 0.0 | 0.2 | GO:0016255 | attachment of GPI anchor to protein(GO:0016255) |
| 0.0 | 0.3 | GO:0017182 | peptidyl-diphthamide metabolic process(GO:0017182) peptidyl-diphthamide biosynthetic process from peptidyl-histidine(GO:0017183) peptidyl-histidine modification(GO:0018202) |
| 0.0 | 0.2 | GO:0048655 | anther morphogenesis(GO:0048654) anther wall tapetum morphogenesis(GO:0048655) |
| 0.0 | 0.3 | GO:0070129 | regulation of mitochondrial translation(GO:0070129) positive regulation of mitochondrial translation(GO:0070131) |
| 0.0 | 0.1 | GO:0030259 | lipid glycosylation(GO:0030259) |
| 0.0 | 0.2 | GO:0003400 | regulation of COPII vesicle coating(GO:0003400) regulation of ER to Golgi vesicle-mediated transport by GTP hydrolysis(GO:0090113) |
| 0.0 | 0.2 | GO:0044211 | CTP salvage(GO:0044211) |
| 0.0 | 0.8 | GO:0071577 | zinc II ion transmembrane transport(GO:0071577) |
| 0.0 | 0.1 | GO:0030030 | cell projection organization(GO:0030030) cell projection assembly(GO:0030031) |
| 0.0 | 0.4 | GO:0005992 | trehalose biosynthetic process(GO:0005992) |
| 0.0 | 0.1 | GO:0009866 | induced systemic resistance, ethylene mediated signaling pathway(GO:0009866) |
| 0.0 | 0.6 | GO:0080188 | RNA-directed DNA methylation(GO:0080188) |
| 0.0 | 0.1 | GO:0035279 | mRNA cleavage involved in gene silencing by miRNA(GO:0035279) mRNA cleavage involved in gene silencing(GO:0098795) |
| 0.0 | 0.1 | GO:0042547 | cell wall modification involved in multidimensional cell growth(GO:0042547) |
| 0.0 | 0.2 | GO:0006552 | leucine catabolic process(GO:0006552) |
| 0.0 | 0.0 | GO:0006750 | glutathione biosynthetic process(GO:0006750) nonribosomal peptide biosynthetic process(GO:0019184) |
| 0.0 | 0.3 | GO:0051984 | positive regulation of mitotic nuclear division(GO:0045840) positive regulation of mitotic metaphase/anaphase transition(GO:0045842) positive regulation of chromosome segregation(GO:0051984) positive regulation of mitotic sister chromatid separation(GO:1901970) positive regulation of metaphase/anaphase transition of cell cycle(GO:1902101) |
| 0.0 | 0.3 | GO:0016558 | protein import into peroxisome matrix(GO:0016558) |
| 0.0 | 0.3 | GO:0080027 | response to herbivore(GO:0080027) |
| 0.0 | 0.1 | GO:0006556 | S-adenosylmethionine biosynthetic process(GO:0006556) |
| 0.0 | 0.4 | GO:0018401 | protein hydroxylation(GO:0018126) peptidyl-proline hydroxylation to 4-hydroxy-L-proline(GO:0018401) 4-hydroxyproline metabolic process(GO:0019471) peptidyl-proline hydroxylation(GO:0019511) |
| 0.0 | 0.3 | GO:0009695 | jasmonic acid biosynthetic process(GO:0009695) |
| 0.0 | 0.1 | GO:2000693 | positive regulation of seed maturation(GO:2000693) |
| 0.0 | 0.0 | GO:0010113 | negative regulation of systemic acquired resistance(GO:0010113) |
| 0.0 | 0.4 | GO:0009051 | pentose-phosphate shunt, oxidative branch(GO:0009051) |
| 0.0 | 0.2 | GO:0008216 | spermidine metabolic process(GO:0008216) |
| 0.0 | 0.6 | GO:0032968 | positive regulation of transcription elongation from RNA polymerase II promoter(GO:0032968) |
| 0.0 | 0.0 | GO:1902289 | negative regulation of defense response to oomycetes(GO:1902289) |
| 0.0 | 0.2 | GO:0010449 | root meristem growth(GO:0010449) |
| 0.0 | 1.3 | GO:0009808 | lignin metabolic process(GO:0009808) |
| 0.0 | 0.3 | GO:2000896 | amylopectin biosynthetic process(GO:0010021) amylopectin metabolic process(GO:2000896) |
| 0.0 | 0.3 | GO:0006122 | mitochondrial electron transport, ubiquinol to cytochrome c(GO:0006122) |
| 0.0 | 0.2 | GO:0006183 | GTP biosynthetic process(GO:0006183) |
| 0.0 | 0.2 | GO:0009799 | specification of symmetry(GO:0009799) |
| 0.0 | 0.2 | GO:0006048 | UDP-N-acetylglucosamine biosynthetic process(GO:0006048) |
| 0.0 | 0.6 | GO:0009768 | photosynthesis, light harvesting in photosystem I(GO:0009768) |
| 0.0 | 0.3 | GO:0010345 | suberin biosynthetic process(GO:0010345) |
| 0.0 | 0.3 | GO:0009851 | auxin biosynthetic process(GO:0009851) |
| 0.0 | 0.2 | GO:0032784 | regulation of DNA-templated transcription, elongation(GO:0032784) |
| 0.0 | 0.1 | GO:0006000 | fructose metabolic process(GO:0006000) |
| 0.0 | 0.2 | GO:0048658 | anther wall tapetum development(GO:0048658) |
| 0.0 | 0.8 | GO:0009817 | defense response to fungus, incompatible interaction(GO:0009817) |
| 0.0 | 0.1 | GO:1900909 | negative regulation of ethylene biosynthetic process(GO:0010366) negative regulation of sulfur amino acid metabolic process(GO:0031336) negative regulation of cellular amine metabolic process(GO:0033239) negative regulation of cellular amino acid metabolic process(GO:0045763) negative regulation of sulfur metabolic process(GO:0051175) negative regulation of olefin metabolic process(GO:1900909) negative regulation of olefin biosynthetic process(GO:1900912) |
| 0.0 | 0.5 | GO:0048768 | root hair cell tip growth(GO:0048768) |
| 0.0 | 0.1 | GO:2000037 | regulation of stomatal complex patterning(GO:2000037) |
| 0.0 | 0.4 | GO:0034394 | protein localization to cell surface(GO:0034394) |
| 0.0 | 0.1 | GO:0060148 | positive regulation of posttranscriptional gene silencing(GO:0060148) positive regulation of RNA interference(GO:1900370) |
| 0.0 | 0.2 | GO:0009405 | pathogenesis(GO:0009405) |
| 0.0 | 0.4 | GO:0009773 | photosynthetic electron transport in photosystem I(GO:0009773) |
| 0.0 | 0.2 | GO:0001709 | cell fate determination(GO:0001709) |
| 0.0 | 1.0 | GO:0016485 | protein processing(GO:0016485) |
| 0.0 | 0.8 | GO:0009690 | cytokinin metabolic process(GO:0009690) |
| 0.0 | 0.2 | GO:0046482 | para-aminobenzoic acid metabolic process(GO:0046482) |
| 0.0 | 0.1 | GO:0042659 | regulation of cell fate specification(GO:0042659) |
| 0.0 | 0.4 | GO:0051510 | regulation of unidimensional cell growth(GO:0051510) |
| 0.0 | 0.4 | GO:0015772 | oligosaccharide transport(GO:0015772) |
| 0.0 | 0.3 | GO:0009862 | systemic acquired resistance, salicylic acid mediated signaling pathway(GO:0009862) |
| 0.0 | 0.3 | GO:0006415 | translational termination(GO:0006415) |
| 0.0 | 0.3 | GO:0070940 | dephosphorylation of RNA polymerase II C-terminal domain(GO:0070940) |
| 0.0 | 0.1 | GO:0010387 | COP9 signalosome assembly(GO:0010387) |
| 0.0 | 0.2 | GO:0019287 | isopentenyl diphosphate biosynthetic process, mevalonate pathway(GO:0019287) |
| 0.0 | 0.3 | GO:0010214 | seed coat development(GO:0010214) |
| 0.0 | 0.3 | GO:0006573 | valine metabolic process(GO:0006573) |
| 0.0 | 0.1 | GO:0032011 | ARF protein signal transduction(GO:0032011) regulation of ARF protein signal transduction(GO:0032012) |
| 0.0 | 0.1 | GO:0006564 | L-serine biosynthetic process(GO:0006564) |
| 0.0 | 0.1 | GO:0006020 | inositol metabolic process(GO:0006020) |
| 0.0 | 0.0 | GO:0010023 | proanthocyanidin biosynthetic process(GO:0010023) |
| 0.0 | 0.2 | GO:0000086 | G2/M transition of mitotic cell cycle(GO:0000086) cell cycle G2/M phase transition(GO:0044839) |
| 0.0 | 0.3 | GO:0009765 | photosynthesis, light harvesting(GO:0009765) |
| 0.0 | 0.1 | GO:0006474 | N-terminal protein amino acid acetylation(GO:0006474) N-terminal peptidyl-methionine acetylation(GO:0017196) |
| 0.0 | 0.4 | GO:0046653 | tetrahydrofolate metabolic process(GO:0046653) |
| 0.0 | 0.2 | GO:0051131 | chaperone-mediated protein complex assembly(GO:0051131) |
| 0.0 | 0.1 | GO:1901336 | lactone metabolic process(GO:1901334) lactone biosynthetic process(GO:1901336) strigolactone metabolic process(GO:1901600) strigolactone biosynthetic process(GO:1901601) |
| 0.0 | 0.1 | GO:0006662 | glycerol ether metabolic process(GO:0006662) |
| 0.0 | 0.6 | GO:0000122 | negative regulation of transcription from RNA polymerase II promoter(GO:0000122) |
| 0.0 | 1.5 | GO:0043086 | negative regulation of catalytic activity(GO:0043086) |
| 0.0 | 0.0 | GO:0000492 | box C/D snoRNP assembly(GO:0000492) |
| 0.0 | 0.1 | GO:0009920 | cell plate formation involved in plant-type cell wall biogenesis(GO:0009920) |
| 0.0 | 0.2 | GO:0006787 | porphyrin-containing compound catabolic process(GO:0006787) tetrapyrrole catabolic process(GO:0033015) |
| 0.0 | 0.1 | GO:0002943 | tRNA dihydrouridine synthesis(GO:0002943) |
| 0.0 | 0.0 | GO:0051601 | exocyst localization(GO:0051601) |
| 0.0 | 0.0 | GO:0035280 | miRNA loading onto RISC involved in gene silencing by miRNA(GO:0035280) small RNA loading onto RISC(GO:0070922) |
| 0.0 | 0.7 | GO:2000280 | regulation of root development(GO:2000280) |
| 0.0 | 0.3 | GO:0032981 | mitochondrial respiratory chain complex I assembly(GO:0032981) mitochondrial respiratory chain complex I biogenesis(GO:0097031) |
| 0.0 | 0.4 | GO:0009693 | ethylene metabolic process(GO:0009692) ethylene biosynthetic process(GO:0009693) cellular alkene metabolic process(GO:0043449) alkene biosynthetic process(GO:0043450) olefin metabolic process(GO:1900673) olefin biosynthetic process(GO:1900674) |
| 0.0 | 0.3 | GO:0046219 | tryptophan biosynthetic process(GO:0000162) indolalkylamine biosynthetic process(GO:0046219) |
| 0.0 | 0.5 | GO:0010311 | lateral root formation(GO:0010311) |
| 0.0 | 0.0 | GO:0090628 | plant epidermal cell fate specification(GO:0090628) |
| 0.0 | 0.3 | GO:0042744 | hydrogen peroxide catabolic process(GO:0042744) |
| 0.0 | 0.2 | GO:0000463 | maturation of LSU-rRNA from tricistronic rRNA transcript (SSU-rRNA, 5.8S rRNA, LSU-rRNA)(GO:0000463) |
| 0.0 | 0.0 | GO:0010677 | negative regulation of cellular carbohydrate metabolic process(GO:0010677) |
| 0.0 | 0.5 | GO:0010043 | response to zinc ion(GO:0010043) |
| 0.0 | 0.6 | GO:0090487 | toxin catabolic process(GO:0009407) secondary metabolite catabolic process(GO:0090487) |
| 0.0 | 0.1 | GO:0051214 | RNA virus induced gene silencing(GO:0051214) |
| 0.0 | 0.1 | GO:0072348 | sulfur compound transport(GO:0072348) |
| 0.0 | 0.1 | GO:0016121 | carotene catabolic process(GO:0016121) terpene catabolic process(GO:0046247) |
| 0.0 | 0.1 | GO:0010424 | DNA methylation on cytosine within a CG sequence(GO:0010424) |
| 0.0 | 0.1 | GO:0042256 | mature ribosome assembly(GO:0042256) |
| 0.0 | 0.1 | GO:0010440 | stomatal lineage progression(GO:0010440) |
| 0.0 | 0.0 | GO:0035019 | somatic stem cell population maintenance(GO:0035019) |
| 0.0 | 0.0 | GO:0002164 | nematode larval development(GO:0002119) larval development(GO:0002164) regulation of nematode larval development(GO:0061062) |
| 0.0 | 0.1 | GO:0007143 | female meiotic division(GO:0007143) |
| 0.0 | 0.1 | GO:0010439 | regulation of glucosinolate biosynthetic process(GO:0010439) |
| 0.0 | 0.0 | GO:0051646 | mitochondrion localization(GO:0051646) |
| 0.0 | 0.1 | GO:1902532 | negative regulation of intracellular signal transduction(GO:1902532) |
| 0.0 | 0.1 | GO:0043966 | histone H3 acetylation(GO:0043966) |
| 0.0 | 0.2 | GO:0043062 | extracellular matrix organization(GO:0030198) extracellular structure organization(GO:0043062) |
| 0.0 | 0.2 | GO:0010207 | photosystem II assembly(GO:0010207) |
| 0.0 | 0.2 | GO:0010492 | maintenance of shoot apical meristem identity(GO:0010492) |
| 0.0 | 0.2 | GO:0048017 | inositol lipid-mediated signaling(GO:0048017) |
| 0.0 | 0.1 | GO:0010588 | cotyledon vascular tissue pattern formation(GO:0010588) |
| 0.0 | 0.0 | GO:0045912 | negative regulation of carbohydrate metabolic process(GO:0045912) |
| 0.0 | 0.2 | GO:0071472 | cellular response to salt stress(GO:0071472) |
| 0.0 | 1.3 | GO:0045944 | positive regulation of transcription from RNA polymerase II promoter(GO:0045944) |
| 0.0 | 0.0 | GO:0060964 | regulation of gene silencing by miRNA(GO:0060964) |
| 0.0 | 0.1 | GO:2000142 | regulation of DNA-templated transcription, initiation(GO:2000142) |
Gene overrepresentation in cellular component category:
| Log-likelihood per target | Total log-likelihood | Term | Description |
|---|---|---|---|
| 0.3 | 1.0 | GO:0005652 | nuclear lamina(GO:0005652) |
| 0.3 | 0.9 | GO:0043673 | pollen wall(GO:0043667) exine(GO:0043668) sexine(GO:0043673) columella(GO:0043674) |
| 0.3 | 1.0 | GO:0034663 | endoplasmic reticulum chaperone complex(GO:0034663) |
| 0.2 | 2.7 | GO:0048226 | Casparian strip(GO:0048226) |
| 0.2 | 0.2 | GO:0005905 | clathrin-coated pit(GO:0005905) |
| 0.2 | 1.2 | GO:0005960 | glycine cleavage complex(GO:0005960) |
| 0.2 | 2.4 | GO:0000322 | storage vacuole(GO:0000322) protein storage vacuole(GO:0000326) |
| 0.2 | 0.6 | GO:0009514 | glyoxysome(GO:0009514) |
| 0.2 | 0.5 | GO:0070382 | exocytic vesicle(GO:0070382) |
| 0.2 | 1.5 | GO:0031588 | nucleotide-activated protein kinase complex(GO:0031588) |
| 0.2 | 1.2 | GO:0042406 | extrinsic component of endoplasmic reticulum membrane(GO:0042406) |
| 0.2 | 0.5 | GO:0030015 | CCR4-NOT core complex(GO:0030015) |
| 0.1 | 0.3 | GO:0044420 | extracellular matrix component(GO:0044420) pollen coat(GO:0070505) |
| 0.1 | 0.3 | GO:0016323 | basal plasma membrane(GO:0009925) basolateral plasma membrane(GO:0016323) basal part of cell(GO:0045178) |
| 0.1 | 0.8 | GO:0031931 | TORC1 complex(GO:0031931) TOR complex(GO:0038201) |
| 0.1 | 0.4 | GO:0045334 | clathrin-coated endocytic vesicle(GO:0045334) |
| 0.1 | 0.5 | GO:0016461 | unconventional myosin complex(GO:0016461) |
| 0.1 | 0.3 | GO:0031080 | nuclear pore outer ring(GO:0031080) |
| 0.1 | 2.6 | GO:0012511 | monolayer-surrounded lipid storage body(GO:0012511) |
| 0.1 | 0.9 | GO:0030076 | thylakoid light-harvesting complex(GO:0009503) PSII associated light-harvesting complex II(GO:0009517) light-harvesting complex(GO:0030076) |
| 0.1 | 0.4 | GO:0008622 | epsilon DNA polymerase complex(GO:0008622) |
| 0.1 | 0.3 | GO:1990429 | Pex17p-Pex14p docking complex(GO:1990415) peroxisomal importomer complex(GO:1990429) |
| 0.1 | 0.2 | GO:0035101 | FACT complex(GO:0035101) |
| 0.1 | 0.4 | GO:1990124 | messenger ribonucleoprotein complex(GO:1990124) |
| 0.1 | 0.8 | GO:0005788 | endoplasmic reticulum lumen(GO:0005788) |
| 0.1 | 0.3 | GO:0030139 | endocytic vesicle(GO:0030139) |
| 0.1 | 0.6 | GO:0035619 | root hair(GO:0035618) root hair tip(GO:0035619) |
| 0.1 | 0.3 | GO:0010316 | pyrophosphate-dependent phosphofructokinase complex(GO:0010316) |
| 0.1 | 0.2 | GO:0044614 | nuclear pore cytoplasmic filaments(GO:0044614) |
| 0.1 | 0.3 | GO:0030870 | Mre11 complex(GO:0030870) |
| 0.1 | 0.3 | GO:0042645 | mitochondrial nucleoid(GO:0042645) |
| 0.1 | 0.2 | GO:0002189 | ribose phosphate diphosphokinase complex(GO:0002189) |
| 0.1 | 0.5 | GO:0005884 | actin filament(GO:0005884) |
| 0.1 | 0.5 | GO:0045252 | oxoglutarate dehydrogenase complex(GO:0045252) |
| 0.1 | 0.2 | GO:0000126 | transcription factor TFIIIB complex(GO:0000126) |
| 0.1 | 16.1 | GO:0031225 | anchored component of membrane(GO:0031225) |
| 0.1 | 0.3 | GO:0030127 | COPII vesicle coat(GO:0030127) |
| 0.1 | 0.2 | GO:0035102 | PRC1 complex(GO:0035102) |
| 0.1 | 0.3 | GO:0045240 | dihydrolipoyl dehydrogenase complex(GO:0045240) |
| 0.0 | 0.2 | GO:0032044 | DSIF complex(GO:0032044) |
| 0.0 | 0.9 | GO:0016602 | CCAAT-binding factor complex(GO:0016602) |
| 0.0 | 0.4 | GO:0005742 | mitochondrial outer membrane translocase complex(GO:0005742) |
| 0.0 | 0.1 | GO:0032301 | MutSalpha complex(GO:0032301) |
| 0.0 | 0.1 | GO:0044463 | cell projection part(GO:0044463) |
| 0.0 | 8.4 | GO:0009505 | plant-type cell wall(GO:0009505) |
| 0.0 | 0.2 | GO:0009509 | chromoplast(GO:0009509) |
| 0.0 | 0.8 | GO:0045177 | apical part of cell(GO:0045177) |
| 0.0 | 0.1 | GO:0030093 | chloroplast photosystem I(GO:0030093) |
| 0.0 | 0.4 | GO:0005801 | cis-Golgi network(GO:0005801) |
| 0.0 | 0.2 | GO:0031429 | box H/ACA snoRNP complex(GO:0031429) box H/ACA RNP complex(GO:0072588) |
| 0.0 | 0.2 | GO:0030915 | Smc5-Smc6 complex(GO:0030915) |
| 0.0 | 0.2 | GO:0044545 | NSL complex(GO:0044545) |
| 0.0 | 1.6 | GO:0005764 | lysosome(GO:0005764) |
| 0.0 | 0.9 | GO:0005744 | mitochondrial inner membrane presequence translocase complex(GO:0005744) |
| 0.0 | 0.3 | GO:0016593 | Cdc73/Paf1 complex(GO:0016593) |
| 0.0 | 0.3 | GO:0009538 | photosystem I reaction center(GO:0009538) |
| 0.0 | 1.3 | GO:0000145 | exocyst(GO:0000145) |
| 0.0 | 0.4 | GO:1902562 | NuA4 histone acetyltransferase complex(GO:0035267) H4/H2A histone acetyltransferase complex(GO:0043189) H4 histone acetyltransferase complex(GO:1902562) |
| 0.0 | 0.1 | GO:0000811 | GINS complex(GO:0000811) |
| 0.0 | 0.2 | GO:0008250 | oligosaccharyltransferase complex(GO:0008250) |
| 0.0 | 0.2 | GO:0042765 | GPI-anchor transamidase complex(GO:0042765) |
| 0.0 | 0.3 | GO:0010445 | nuclear dicing body(GO:0010445) |
| 0.0 | 0.2 | GO:0017053 | transcriptional repressor complex(GO:0017053) |
| 0.0 | 0.1 | GO:0009522 | photosystem I(GO:0009522) |
| 0.0 | 0.2 | GO:0031380 | RNA-directed RNA polymerase complex(GO:0031379) nuclear RNA-directed RNA polymerase complex(GO:0031380) |
| 0.0 | 0.1 | GO:0005658 | alpha DNA polymerase:primase complex(GO:0005658) |
| 0.0 | 0.2 | GO:0030892 | nuclear cohesin complex(GO:0000798) mitotic cohesin complex(GO:0030892) meiotic cohesin complex(GO:0030893) nuclear mitotic cohesin complex(GO:0034990) nuclear meiotic cohesin complex(GO:0034991) |
| 0.0 | 0.2 | GO:0000778 | condensed nuclear chromosome kinetochore(GO:0000778) |
| 0.0 | 0.8 | GO:0005811 | lipid particle(GO:0005811) |
| 0.0 | 0.4 | GO:0034399 | nuclear periphery(GO:0034399) |
| 0.0 | 0.7 | GO:0000137 | Golgi cis cisterna(GO:0000137) |
| 0.0 | 0.0 | GO:0000795 | synaptonemal complex(GO:0000795) |
| 0.0 | 0.3 | GO:0030140 | trans-Golgi network transport vesicle(GO:0030140) |
| 0.0 | 0.7 | GO:0090406 | pollen tube(GO:0090406) |
| 0.0 | 0.5 | GO:0000159 | protein phosphatase type 2A complex(GO:0000159) |
| 0.0 | 0.1 | GO:0048476 | Holliday junction resolvase complex(GO:0048476) |
| 0.0 | 0.2 | GO:0005662 | DNA replication factor A complex(GO:0005662) |
| 0.0 | 0.4 | GO:0031965 | nuclear membrane(GO:0031965) |
| 0.0 | 0.2 | GO:0032300 | mismatch repair complex(GO:0032300) |
| 0.0 | 0.1 | GO:0071012 | U2-type catalytic step 1 spliceosome(GO:0071006) catalytic step 1 spliceosome(GO:0071012) |
| 0.0 | 48.6 | GO:0005576 | extracellular region(GO:0005576) |
| 0.0 | 0.4 | GO:0000307 | cyclin-dependent protein kinase holoenzyme complex(GO:0000307) |
| 0.0 | 0.1 | GO:0031414 | N-terminal protein acetyltransferase complex(GO:0031414) NatC complex(GO:0031417) |
| 0.0 | 0.2 | GO:0000127 | transcription factor TFIIIC complex(GO:0000127) RNA polymerase III transcription factor complex(GO:0090576) |
| 0.0 | 0.0 | GO:0034702 | ion channel complex(GO:0034702) cation channel complex(GO:0034703) |
| 0.0 | 0.1 | GO:0001673 | male germ cell nucleus(GO:0001673) |
| 0.0 | 0.7 | GO:0031201 | SNARE complex(GO:0031201) |
| 0.0 | 0.1 | GO:0005968 | Rab-protein geranylgeranyltransferase complex(GO:0005968) |
| 0.0 | 0.1 | GO:0000796 | condensin complex(GO:0000796) |
| 0.0 | 0.3 | GO:0005680 | anaphase-promoting complex(GO:0005680) |
| 0.0 | 0.0 | GO:0033063 | Rad51B-Rad51C-Rad51D-XRCC2 complex(GO:0033063) |
Gene overrepresentation in molecular function category:
| Log-likelihood per target | Total log-likelihood | Term | Description |
|---|---|---|---|
| 0.8 | 2.4 | GO:0015204 | urea transmembrane transporter activity(GO:0015204) |
| 0.6 | 1.9 | GO:0000249 | C-22 sterol desaturase activity(GO:0000249) |
| 0.6 | 4.7 | GO:0004506 | squalene monooxygenase activity(GO:0004506) |
| 0.6 | 2.9 | GO:0004793 | threonine aldolase activity(GO:0004793) L-allo-threonine aldolase activity(GO:0008732) |
| 0.5 | 1.5 | GO:0050736 | O-malonyltransferase activity(GO:0050736) |
| 0.5 | 1.5 | GO:0003849 | 3-deoxy-7-phosphoheptulonate synthase activity(GO:0003849) |
| 0.5 | 1.5 | GO:0008909 | isochorismate synthase activity(GO:0008909) |
| 0.5 | 1.4 | GO:0036381 | pyridoxal 5'-phosphate synthase (glutamine hydrolysing) activity(GO:0036381) |
| 0.4 | 1.7 | GO:0048030 | disaccharide binding(GO:0048030) maltose binding(GO:1901982) |
| 0.4 | 1.2 | GO:0010283 | pinoresinol reductase activity(GO:0010283) |
| 0.4 | 1.2 | GO:0004375 | glycine dehydrogenase (decarboxylating) activity(GO:0004375) oxidoreductase activity, acting on the CH-NH2 group of donors, disulfide as acceptor(GO:0016642) |
| 0.4 | 2.6 | GO:0004066 | asparagine synthase (glutamine-hydrolyzing) activity(GO:0004066) |
| 0.4 | 1.1 | GO:0052692 | alpha-galactosidase activity(GO:0004557) raffinose alpha-galactosidase activity(GO:0052692) |
| 0.3 | 1.3 | GO:0005432 | calcium:sodium antiporter activity(GO:0005432) |
| 0.3 | 1.0 | GO:0051738 | xanthophyll binding(GO:0051738) |
| 0.3 | 0.9 | GO:0004476 | mannose-6-phosphate isomerase activity(GO:0004476) |
| 0.3 | 1.5 | GO:0016629 | 12-oxophytodienoate reductase activity(GO:0016629) |
| 0.3 | 0.9 | GO:0015117 | thiosulfate transmembrane transporter activity(GO:0015117) |
| 0.3 | 0.9 | GO:0009924 | octadecanal decarbonylase activity(GO:0009924) aldehyde decarbonylase activity(GO:0071771) aldehyde oxygenase (deformylating) activity(GO:1990465) |
| 0.3 | 1.7 | GO:0004126 | cytidine deaminase activity(GO:0004126) |
| 0.3 | 0.8 | GO:0047209 | coniferyl-alcohol glucosyltransferase activity(GO:0047209) |
| 0.3 | 1.4 | GO:0008430 | selenium binding(GO:0008430) |
| 0.3 | 0.8 | GO:0050412 | cinnamate beta-D-glucosyltransferase activity(GO:0050412) |
| 0.3 | 0.5 | GO:0015116 | sulfate transmembrane transporter activity(GO:0015116) |
| 0.3 | 3.5 | GO:0004332 | fructose-bisphosphate aldolase activity(GO:0004332) |
| 0.2 | 0.7 | GO:0010331 | gibberellin binding(GO:0010331) |
| 0.2 | 0.7 | GO:0016618 | hydroxypyruvate reductase activity(GO:0016618) |
| 0.2 | 0.7 | GO:0008898 | S-adenosylmethionine-homocysteine S-methyltransferase activity(GO:0008898) betaine-homocysteine S-methyltransferase activity(GO:0047150) |
| 0.2 | 0.7 | GO:0004044 | amidophosphoribosyltransferase activity(GO:0004044) |
| 0.2 | 1.2 | GO:0052654 | L-leucine transaminase activity(GO:0052654) L-valine transaminase activity(GO:0052655) L-isoleucine transaminase activity(GO:0052656) |
| 0.2 | 0.6 | GO:0016643 | glutamate synthase (ferredoxin) activity(GO:0016041) oxidoreductase activity, acting on the CH-NH2 group of donors, iron-sulfur protein as acceptor(GO:0016643) |
| 0.2 | 0.6 | GO:0000309 | nicotinamide-nucleotide adenylyltransferase activity(GO:0000309) |
| 0.2 | 1.2 | GO:0016984 | ribulose-bisphosphate carboxylase activity(GO:0016984) |
| 0.2 | 0.8 | GO:0050815 | phosphoserine binding(GO:0050815) RNA polymerase II C-terminal domain phosphoserine binding(GO:1990269) |
| 0.2 | 3.3 | GO:0015250 | water transmembrane transporter activity(GO:0005372) water channel activity(GO:0015250) |
| 0.2 | 0.5 | GO:0046027 | phospholipid:diacylglycerol acyltransferase activity(GO:0046027) |
| 0.2 | 1.8 | GO:0008113 | peptide-methionine (S)-S-oxide reductase activity(GO:0008113) |
| 0.2 | 1.2 | GO:0045431 | flavonol synthase activity(GO:0045431) |
| 0.2 | 4.3 | GO:0019840 | abscisic acid binding(GO:0010427) isoprenoid binding(GO:0019840) |
| 0.2 | 4.3 | GO:0004568 | chitinase activity(GO:0004568) |
| 0.2 | 0.8 | GO:0004781 | sulfate adenylyltransferase (ATP) activity(GO:0004781) |
| 0.2 | 0.8 | GO:0004148 | dihydrolipoyl dehydrogenase activity(GO:0004148) |
| 0.2 | 0.5 | GO:0008131 | primary amine oxidase activity(GO:0008131) |
| 0.2 | 0.5 | GO:0032131 | alkylated DNA binding(GO:0032131) |
| 0.2 | 1.3 | GO:0052634 | gibberellin 2-beta-dioxygenase activity(GO:0045543) C-19 gibberellin 2-beta-dioxygenase activity(GO:0052634) |
| 0.2 | 1.7 | GO:0008970 | phosphatidylcholine 1-acylhydrolase activity(GO:0008970) |
| 0.2 | 0.8 | GO:0016768 | spermine synthase activity(GO:0016768) |
| 0.1 | 0.9 | GO:0047274 | galactinol-sucrose galactosyltransferase activity(GO:0047274) |
| 0.1 | 0.7 | GO:0016801 | hydrolase activity, acting on ether bonds(GO:0016801) |
| 0.1 | 1.3 | GO:0003988 | acetyl-CoA C-acyltransferase activity(GO:0003988) |
| 0.1 | 0.6 | GO:0052578 | alpha-farnesene synthase activity(GO:0052578) |
| 0.1 | 0.4 | GO:0070704 | sterol desaturase activity(GO:0070704) |
| 0.1 | 0.5 | GO:0004737 | pyruvate decarboxylase activity(GO:0004737) |
| 0.1 | 1.3 | GO:0052736 | beta-glucanase activity(GO:0052736) |
| 0.1 | 1.9 | GO:0045551 | cinnamyl-alcohol dehydrogenase activity(GO:0045551) |
| 0.1 | 1.1 | GO:0000254 | C-4 methylsterol oxidase activity(GO:0000254) |
| 0.1 | 1.0 | GO:0052623 | ATP dimethylallyltransferase activity(GO:0052622) ADP dimethylallyltransferase activity(GO:0052623) |
| 0.1 | 0.6 | GO:0004049 | anthranilate synthase activity(GO:0004049) |
| 0.1 | 0.6 | GO:0005355 | glucose transmembrane transporter activity(GO:0005355) |
| 0.1 | 0.4 | GO:0004014 | adenosylmethionine decarboxylase activity(GO:0004014) |
| 0.1 | 0.9 | GO:0004623 | phospholipase A2 activity(GO:0004623) |
| 0.1 | 0.5 | GO:0034513 | box H/ACA snoRNA binding(GO:0034513) |
| 0.1 | 1.0 | GO:0009916 | alternative oxidase activity(GO:0009916) |
| 0.1 | 0.6 | GO:0033843 | xyloglucan 6-xylosyltransferase activity(GO:0033843) |
| 0.1 | 0.8 | GO:0005049 | nuclear export signal receptor activity(GO:0005049) |
| 0.1 | 0.5 | GO:0046593 | mandelonitrile lyase activity(GO:0046593) |
| 0.1 | 0.5 | GO:0016165 | linoleate 13S-lipoxygenase activity(GO:0016165) |
| 0.1 | 0.9 | GO:0004566 | beta-glucuronidase activity(GO:0004566) |
| 0.1 | 0.5 | GO:0047215 | indole-3-acetate beta-glucosyltransferase activity(GO:0047215) |
| 0.1 | 0.6 | GO:0043682 | copper-transporting ATPase activity(GO:0043682) |
| 0.1 | 0.5 | GO:0004512 | inositol-3-phosphate synthase activity(GO:0004512) |
| 0.1 | 0.2 | GO:0000992 | polymerase III regulatory region sequence-specific DNA binding(GO:0000992) RNA polymerase III type 3 promoter sequence-specific DNA binding(GO:0001006) RNA polymerase III regulatory region DNA binding(GO:0001016) RNA polymerase III type 3 promoter DNA binding(GO:0001032) |
| 0.1 | 0.8 | GO:1990538 | xylan O-acetyltransferase activity(GO:1990538) |
| 0.1 | 1.0 | GO:0035673 | oligopeptide transmembrane transporter activity(GO:0035673) peptide transmembrane transporter activity(GO:1904680) |
| 0.1 | 1.4 | GO:0009044 | xylan 1,4-beta-xylosidase activity(GO:0009044) |
| 0.1 | 0.4 | GO:0004813 | alanine-tRNA ligase activity(GO:0004813) |
| 0.1 | 0.3 | GO:0033984 | indole-3-glycerol-phosphate lyase activity(GO:0033984) |
| 0.1 | 1.1 | GO:0008169 | C-methyltransferase activity(GO:0008169) |
| 0.1 | 0.7 | GO:0004664 | prephenate dehydratase activity(GO:0004664) arogenate dehydratase activity(GO:0047769) |
| 0.1 | 0.4 | GO:0004617 | phosphoglycerate dehydrogenase activity(GO:0004617) |
| 0.1 | 0.8 | GO:0016815 | nitrilase activity(GO:0000257) hydrolase activity, acting on carbon-nitrogen (but not peptide) bonds, in nitriles(GO:0016815) nitrile hydratase activity(GO:0018822) indole-3-acetonitrile nitrilase activity(GO:0080061) |
| 0.1 | 1.1 | GO:0048038 | quinone binding(GO:0048038) |
| 0.1 | 2.7 | GO:0004565 | beta-galactosidase activity(GO:0004565) |
| 0.1 | 0.1 | GO:0032356 | oxidized DNA binding(GO:0032356) oxidized purine DNA binding(GO:0032357) |
| 0.1 | 0.3 | GO:0035671 | enone reductase activity(GO:0035671) |
| 0.1 | 0.4 | GO:0070330 | oxidoreductase activity, acting on paired donors, with incorporation or reduction of molecular oxygen, reduced flavin or flavoprotein as one donor, and incorporation of one atom of oxygen(GO:0016712) aromatase activity(GO:0070330) |
| 0.1 | 0.4 | GO:0004075 | biotin carboxylase activity(GO:0004075) |
| 0.1 | 3.8 | GO:0008171 | O-methyltransferase activity(GO:0008171) |
| 0.1 | 0.6 | GO:0045547 | dehydrodolichyl diphosphate synthase activity(GO:0045547) |
| 0.1 | 0.4 | GO:0032135 | DNA insertion or deletion binding(GO:0032135) |
| 0.1 | 1.2 | GO:0015145 | monosaccharide transmembrane transporter activity(GO:0015145) |
| 0.1 | 0.3 | GO:0015377 | cation:chloride symporter activity(GO:0015377) |
| 0.1 | 0.3 | GO:0004560 | alpha-L-fucosidase activity(GO:0004560) |
| 0.1 | 0.4 | GO:0046423 | allene-oxide cyclase activity(GO:0046423) |
| 0.1 | 0.7 | GO:0050105 | L-gulonolactone oxidase activity(GO:0050105) |
| 0.1 | 0.2 | GO:0015292 | uniporter activity(GO:0015292) |
| 0.1 | 0.3 | GO:0031071 | cysteine desulfurase activity(GO:0031071) |
| 0.1 | 0.4 | GO:0080116 | glucuronoxylan glucuronosyltransferase activity(GO:0080116) |
| 0.1 | 1.1 | GO:0097599 | endo-1,4-beta-xylanase activity(GO:0031176) xylanase activity(GO:0097599) |
| 0.1 | 0.3 | GO:0008442 | 3-hydroxyisobutyrate dehydrogenase activity(GO:0008442) |
| 0.1 | 0.6 | GO:0016621 | cinnamoyl-CoA reductase activity(GO:0016621) |
| 0.1 | 2.2 | GO:0016682 | oxidoreductase activity, acting on diphenols and related substances as donors, oxygen as acceptor(GO:0016682) |
| 0.1 | 0.4 | GO:0004020 | adenylylsulfate kinase activity(GO:0004020) |
| 0.1 | 1.1 | GO:0016813 | hydrolase activity, acting on carbon-nitrogen (but not peptide) bonds, in linear amidines(GO:0016813) |
| 0.1 | 0.4 | GO:0003979 | UDP-glucose 6-dehydrogenase activity(GO:0003979) |
| 0.1 | 0.7 | GO:0016833 | oxo-acid-lyase activity(GO:0016833) |
| 0.1 | 0.3 | GO:0019156 | isoamylase activity(GO:0019156) |
| 0.1 | 0.6 | GO:0008200 | ion channel inhibitor activity(GO:0008200) channel inhibitor activity(GO:0016248) sodium channel regulator activity(GO:0017080) sodium channel inhibitor activity(GO:0019871) |
| 0.1 | 0.3 | GO:0004729 | oxygen-dependent protoporphyrinogen oxidase activity(GO:0004729) protoporphyrinogen oxidase activity(GO:0070818) |
| 0.1 | 0.2 | GO:0070259 | tyrosyl-DNA phosphodiesterase activity(GO:0070259) |
| 0.1 | 0.4 | GO:0003785 | actin monomer binding(GO:0003785) |
| 0.1 | 0.4 | GO:0031492 | nucleosomal DNA binding(GO:0031492) |
| 0.1 | 0.3 | GO:0008297 | single-stranded DNA exodeoxyribonuclease activity(GO:0008297) |
| 0.1 | 1.0 | GO:0016308 | 1-phosphatidylinositol-4-phosphate 5-kinase activity(GO:0016308) |
| 0.1 | 1.8 | GO:0015174 | basic amino acid transmembrane transporter activity(GO:0015174) |
| 0.1 | 0.5 | GO:0017057 | 6-phosphogluconolactonase activity(GO:0017057) |
| 0.1 | 6.0 | GO:0030599 | pectinesterase activity(GO:0030599) |
| 0.1 | 1.9 | GO:0016762 | xyloglucan:xyloglucosyl transferase activity(GO:0016762) |
| 0.1 | 0.7 | GO:0004550 | nucleoside diphosphate kinase activity(GO:0004550) |
| 0.1 | 0.4 | GO:0008728 | GTP diphosphokinase activity(GO:0008728) |
| 0.1 | 2.0 | GO:0008810 | cellulase activity(GO:0008810) |
| 0.1 | 0.6 | GO:0003997 | acyl-CoA oxidase activity(GO:0003997) |
| 0.1 | 0.2 | GO:0004133 | glycogen debranching enzyme activity(GO:0004133) |
| 0.1 | 0.6 | GO:0004559 | alpha-mannosidase activity(GO:0004559) |
| 0.1 | 1.7 | GO:0016645 | oxidoreductase activity, acting on the CH-NH group of donors(GO:0016645) |
| 0.1 | 0.3 | GO:0047334 | diphosphate-fructose-6-phosphate 1-phosphotransferase activity(GO:0047334) |
| 0.1 | 0.4 | GO:0050062 | long-chain-fatty-acyl-CoA reductase activity(GO:0050062) |
| 0.1 | 0.2 | GO:0004347 | glucose-6-phosphate isomerase activity(GO:0004347) |
| 0.1 | 0.3 | GO:0004647 | phosphoserine phosphatase activity(GO:0004647) |
| 0.1 | 0.6 | GO:0017048 | Rho GTPase binding(GO:0017048) |
| 0.1 | 0.4 | GO:0005274 | allantoin uptake transmembrane transporter activity(GO:0005274) uracil:cation symporter activity(GO:0015505) uptake transmembrane transporter activity(GO:0015563) |
| 0.1 | 0.9 | GO:0004708 | MAP kinase kinase activity(GO:0004708) |
| 0.1 | 0.2 | GO:0004749 | ribose phosphate diphosphokinase activity(GO:0004749) |
| 0.1 | 1.1 | GO:0015114 | phosphate ion transmembrane transporter activity(GO:0015114) |
| 0.1 | 0.7 | GO:0004396 | hexokinase activity(GO:0004396) |
| 0.1 | 0.2 | GO:0002151 | G-quadruplex RNA binding(GO:0002151) |
| 0.1 | 0.2 | GO:0051980 | iron chelate transmembrane transporter activity(GO:0015603) iron-nicotianamine transmembrane transporter activity(GO:0051980) |
| 0.1 | 1.2 | GO:0016702 | oxidoreductase activity, acting on single donors with incorporation of molecular oxygen, incorporation of two atoms of oxygen(GO:0016702) |
| 0.1 | 1.3 | GO:0042300 | beta-amyrin synthase activity(GO:0042300) |
| 0.1 | 0.3 | GO:0003863 | 3-methyl-2-oxobutanoate dehydrogenase (2-methylpropanoyl-transferring) activity(GO:0003863) |
| 0.1 | 0.2 | GO:0098748 | clathrin adaptor activity(GO:0035615) endocytic adaptor activity(GO:0098748) |
| 0.1 | 0.2 | GO:0034596 | phosphatidylinositol phosphate 4-phosphatase activity(GO:0034596) phosphatidylinositol-4-phosphate phosphatase activity(GO:0043812) |
| 0.1 | 0.3 | GO:0003959 | NADPH dehydrogenase activity(GO:0003959) |
| 0.1 | 0.2 | GO:0016672 | oxidoreductase activity, acting on a sulfur group of donors, quinone or similar compound as acceptor(GO:0016672) glutathione dehydrogenase (ascorbate) activity(GO:0045174) |
| 0.1 | 0.2 | GO:0004807 | triose-phosphate isomerase activity(GO:0004807) |
| 0.1 | 1.2 | GO:0042973 | glucan endo-1,3-beta-D-glucosidase activity(GO:0042973) |
| 0.1 | 1.0 | GO:0047196 | long-chain-alcohol O-fatty-acyltransferase activity(GO:0047196) |
| 0.1 | 0.3 | GO:0042084 | 5-methyltetrahydropteroyltriglutamate-homocysteine S-methyltransferase activity(GO:0003871) methionine synthase activity(GO:0008705) 5-methyltetrahydrofolate-dependent methyltransferase activity(GO:0042084) 5-methyltetrahydropteroyltri-L-glutamate-dependent methyltransferase activity(GO:0042085) |
| 0.1 | 0.2 | GO:1990380 | Lys48-specific deubiquitinase activity(GO:1990380) |
| 0.1 | 0.2 | GO:0016418 | dihydrolipoyllysine-residue acetyltransferase activity(GO:0004742) S-acetyltransferase activity(GO:0016418) |
| 0.1 | 1.5 | GO:0032934 | sterol binding(GO:0032934) |
| 0.1 | 0.4 | GO:0010279 | indole-3-acetic acid amido synthetase activity(GO:0010279) |
| 0.1 | 0.2 | GO:0033925 | mannosyl-glycoprotein endo-beta-N-acetylglucosaminidase activity(GO:0033925) |
| 0.1 | 0.2 | GO:0047661 | racemase and epimerase activity, acting on amino acids and derivatives(GO:0016855) racemase activity, acting on amino acids and derivatives(GO:0036361) amino-acid racemase activity(GO:0047661) |
| 0.1 | 2.8 | GO:0070001 | aspartic-type peptidase activity(GO:0070001) |
| 0.1 | 0.9 | GO:0003825 | alpha,alpha-trehalose-phosphate synthase (UDP-forming) activity(GO:0003825) |
| 0.1 | 1.0 | GO:0016844 | strictosidine synthase activity(GO:0016844) |
| 0.1 | 0.2 | GO:0004113 | cyclic-nucleotide phosphodiesterase activity(GO:0004112) 2',3'-cyclic-nucleotide 3'-phosphodiesterase activity(GO:0004113) |
| 0.1 | 0.6 | GO:0003691 | double-stranded telomeric DNA binding(GO:0003691) |
| 0.1 | 1.2 | GO:0005345 | purine nucleobase transmembrane transporter activity(GO:0005345) |
| 0.0 | 0.0 | GO:0045181 | glutamate synthase activity(GO:0015930) glutamate synthase (NADH) activity(GO:0016040) glutamate synthase activity, NAD(P)H as acceptor(GO:0045181) |
| 0.0 | 0.6 | GO:0016847 | 1-aminocyclopropane-1-carboxylate synthase activity(GO:0016847) |
| 0.0 | 0.1 | GO:0005496 | steroid binding(GO:0005496) |
| 0.0 | 0.3 | GO:0010429 | methyl-CpNpG binding(GO:0010428) methyl-CpNpN binding(GO:0010429) |
| 0.0 | 0.2 | GO:0047724 | inosine nucleosidase activity(GO:0047724) |
| 0.0 | 2.8 | GO:0004364 | glutathione transferase activity(GO:0004364) |
| 0.0 | 1.0 | GO:0005199 | structural constituent of cell wall(GO:0005199) |
| 0.0 | 1.1 | GO:0016168 | chlorophyll binding(GO:0016168) |
| 0.0 | 0.4 | GO:0047372 | acylglycerol lipase activity(GO:0047372) |
| 0.0 | 0.2 | GO:0003987 | acetate-CoA ligase activity(GO:0003987) |
| 0.0 | 0.7 | GO:0008195 | phosphatidate phosphatase activity(GO:0008195) |
| 0.0 | 0.5 | GO:0004806 | triglyceride lipase activity(GO:0004806) |
| 0.0 | 1.2 | GO:0051539 | 4 iron, 4 sulfur cluster binding(GO:0051539) |
| 0.0 | 0.2 | GO:0015172 | acidic amino acid transmembrane transporter activity(GO:0015172) |
| 0.0 | 1.6 | GO:0080030 | methyl indole-3-acetate esterase activity(GO:0080030) |
| 0.0 | 0.3 | GO:0004611 | phosphoenolpyruvate carboxykinase activity(GO:0004611) |
| 0.0 | 1.2 | GO:0030898 | microfilament motor activity(GO:0000146) actin-dependent ATPase activity(GO:0030898) |
| 0.0 | 0.2 | GO:0036218 | dTTP diphosphatase activity(GO:0036218) |
| 0.0 | 1.3 | GO:0005179 | hormone activity(GO:0005179) |
| 0.0 | 0.8 | GO:0010333 | terpene synthase activity(GO:0010333) |
| 0.0 | 0.2 | GO:0003977 | UDP-N-acetylglucosamine diphosphorylase activity(GO:0003977) |
| 0.0 | 1.7 | GO:0015081 | sodium ion transmembrane transporter activity(GO:0015081) |
| 0.0 | 0.5 | GO:0004930 | G-protein coupled receptor activity(GO:0004930) |
| 0.0 | 0.2 | GO:0034511 | U3 snoRNA binding(GO:0034511) |
| 0.0 | 0.4 | GO:0030674 | protein binding, bridging(GO:0030674) |
| 0.0 | 0.2 | GO:0004820 | glycine-tRNA ligase activity(GO:0004820) |
| 0.0 | 0.2 | GO:0016985 | mannan endo-1,4-beta-mannosidase activity(GO:0016985) |
| 0.0 | 0.1 | GO:0004618 | phosphoglycerate kinase activity(GO:0004618) |
| 0.0 | 0.2 | GO:0016174 | NAD(P)H oxidase activity(GO:0016174) oxidoreductase activity, acting on NAD(P)H, oxygen as acceptor(GO:0050664) |
| 0.0 | 0.2 | GO:0016653 | oxidoreductase activity, acting on NAD(P)H, heme protein as acceptor(GO:0016653) |
| 0.0 | 0.2 | GO:0010313 | phytochrome binding(GO:0010313) |
| 0.0 | 0.1 | GO:0033201 | starch synthase activity(GO:0009011) alpha-1,4-glucan synthase activity(GO:0033201) |
| 0.0 | 0.2 | GO:0070006 | metalloaminopeptidase activity(GO:0070006) |
| 0.0 | 0.1 | GO:0010242 | oxygen evolving activity(GO:0010242) |
| 0.0 | 0.1 | GO:0000386 | second spliceosomal transesterification activity(GO:0000386) |
| 0.0 | 0.3 | GO:0016812 | hydrolase activity, acting on carbon-nitrogen (but not peptide) bonds, in cyclic amides(GO:0016812) |
| 0.0 | 0.1 | GO:0030151 | molybdenum ion binding(GO:0030151) |
| 0.0 | 1.7 | GO:0015035 | protein disulfide oxidoreductase activity(GO:0015035) |
| 0.0 | 0.4 | GO:0032440 | 2-alkenal reductase [NAD(P)] activity(GO:0032440) |
| 0.0 | 0.3 | GO:0046923 | ER retention sequence binding(GO:0046923) |
| 0.0 | 0.1 | GO:0000225 | N-acetylglucosaminylphosphatidylinositol deacetylase activity(GO:0000225) |
| 0.0 | 0.2 | GO:0031177 | phosphopantetheine binding(GO:0031177) |
| 0.0 | 0.2 | GO:0033549 | MAP kinase phosphatase activity(GO:0033549) |
| 0.0 | 0.2 | GO:0033743 | peptide-methionine (R)-S-oxide reductase activity(GO:0033743) |
| 0.0 | 0.4 | GO:0004032 | alditol:NADP+ 1-oxidoreductase activity(GO:0004032) |
| 0.0 | 0.6 | GO:0004022 | alcohol dehydrogenase (NAD) activity(GO:0004022) |
| 0.0 | 0.6 | GO:0005227 | calcium activated cation channel activity(GO:0005227) ion gated channel activity(GO:0022839) |
| 0.0 | 0.2 | GO:0004392 | heme oxygenase (decyclizing) activity(GO:0004392) |
| 0.0 | 0.2 | GO:0052853 | very-long-chain-(S)-2-hydroxy-acid oxidase activity(GO:0052852) long-chain-(S)-2-hydroxy-long-chain-acid oxidase activity(GO:0052853) medium-chain-(S)-2-hydroxy-acid oxidase activity(GO:0052854) |
| 0.0 | 0.2 | GO:0003968 | RNA-directed RNA polymerase activity(GO:0003968) |
| 0.0 | 0.4 | GO:0004805 | trehalose-phosphatase activity(GO:0004805) |
| 0.0 | 0.4 | GO:0046910 | pectinesterase inhibitor activity(GO:0046910) |
| 0.0 | 0.0 | GO:0043295 | glutathione binding(GO:0043295) oligopeptide binding(GO:1900750) |
| 0.0 | 0.1 | GO:0046409 | p-coumarate 3-hydroxylase activity(GO:0046409) |
| 0.0 | 0.3 | GO:0051920 | thioredoxin peroxidase activity(GO:0008379) peroxiredoxin activity(GO:0051920) |
| 0.0 | 0.1 | GO:0004478 | methionine adenosyltransferase activity(GO:0004478) |
| 0.0 | 0.3 | GO:0008079 | translation release factor activity(GO:0003747) translation termination factor activity(GO:0008079) |
| 0.0 | 0.4 | GO:0019798 | procollagen-proline 4-dioxygenase activity(GO:0004656) procollagen-proline dioxygenase activity(GO:0019798) peptidyl-proline 4-dioxygenase activity(GO:0031545) |
| 0.0 | 0.1 | GO:0004535 | poly(A)-specific ribonuclease activity(GO:0004535) |
| 0.0 | 0.2 | GO:0080019 | fatty-acyl-CoA reductase (alcohol-forming) activity(GO:0080019) |
| 0.0 | 1.6 | GO:0005484 | SNAP receptor activity(GO:0005484) |
| 0.0 | 0.2 | GO:0004345 | glucose-6-phosphate dehydrogenase activity(GO:0004345) |
| 0.0 | 0.2 | GO:0008494 | translation activator activity(GO:0008494) mitochondrial ribosome binding(GO:0097177) |
| 0.0 | 0.2 | GO:0016886 | DNA ligase activity(GO:0003909) DNA ligase (ATP) activity(GO:0003910) ligase activity, forming phosphoric ester bonds(GO:0016886) |
| 0.0 | 0.4 | GO:0033293 | monocarboxylic acid binding(GO:0033293) |
| 0.0 | 0.1 | GO:0015120 | phosphoglycerate transmembrane transporter activity(GO:0015120) aldonate transmembrane transporter activity(GO:0042879) |
| 0.0 | 0.8 | GO:0004724 | magnesium-dependent protein serine/threonine phosphatase activity(GO:0004724) |
| 0.0 | 0.3 | GO:0103075 | indole-3-pyruvate monooxygenase activity(GO:0103075) |
| 0.0 | 0.0 | GO:0004766 | spermidine synthase activity(GO:0004766) |
| 0.0 | 0.3 | GO:0004867 | serine-type endopeptidase inhibitor activity(GO:0004867) |
| 0.0 | 0.1 | GO:0004450 | isocitrate dehydrogenase (NADP+) activity(GO:0004450) |
| 0.0 | 1.0 | GO:0003993 | acid phosphatase activity(GO:0003993) |
| 0.0 | 0.2 | GO:0004849 | uridine kinase activity(GO:0004849) |
| 0.0 | 0.6 | GO:0016597 | amino acid binding(GO:0016597) |
| 0.0 | 0.1 | GO:0004181 | metallocarboxypeptidase activity(GO:0004181) |
| 0.0 | 7.5 | GO:0020037 | heme binding(GO:0020037) |
| 0.0 | 0.1 | GO:0008106 | alcohol dehydrogenase (NADP+) activity(GO:0008106) |
| 0.0 | 0.1 | GO:0050567 | glutaminyl-tRNA synthase (glutamine-hydrolyzing) activity(GO:0050567) |
| 0.0 | 0.5 | GO:0016881 | acid-amino acid ligase activity(GO:0016881) |
| 0.0 | 0.1 | GO:0047429 | nucleoside-triphosphate diphosphatase activity(GO:0047429) |
| 0.0 | 0.6 | GO:0005385 | zinc ion transmembrane transporter activity(GO:0005385) |
| 0.0 | 0.1 | GO:0016781 | phosphotransferase activity, paired acceptors(GO:0016781) |
| 0.0 | 0.1 | GO:0004441 | inositol-1,4-bisphosphate 1-phosphatase activity(GO:0004441) |
| 0.0 | 0.1 | GO:0005460 | UDP-glucose transmembrane transporter activity(GO:0005460) |
| 0.0 | 0.8 | GO:0004222 | metalloendopeptidase activity(GO:0004222) |
| 0.0 | 0.0 | GO:0047517 | 1,4-beta-D-xylan synthase activity(GO:0047517) |
| 0.0 | 0.2 | GO:0010385 | double-stranded methylated DNA binding(GO:0010385) |
| 0.0 | 0.2 | GO:0070568 | guanylyltransferase activity(GO:0070568) |
| 0.0 | 0.3 | GO:0008515 | sucrose transmembrane transporter activity(GO:0008515) |
| 0.0 | 0.1 | GO:0004123 | cystathionine gamma-lyase activity(GO:0004123) |
| 0.0 | 0.0 | GO:0003986 | acetyl-CoA hydrolase activity(GO:0003986) |
| 0.0 | 0.4 | GO:0016706 | oxidoreductase activity, acting on paired donors, with incorporation or reduction of molecular oxygen, 2-oxoglutarate as one donor, and incorporation of one atom each of oxygen into both donors(GO:0016706) |
| 0.0 | 0.9 | GO:0001228 | transcriptional activator activity, RNA polymerase II transcription regulatory region sequence-specific binding(GO:0001228) |
| 0.0 | 0.7 | GO:0016759 | cellulose synthase activity(GO:0016759) |
| 0.0 | 0.1 | GO:0008061 | chitin binding(GO:0008061) |
| 0.0 | 1.2 | GO:0009055 | electron carrier activity(GO:0009055) |
| 0.0 | 0.1 | GO:0004142 | diacylglycerol cholinephosphotransferase activity(GO:0004142) |
| 0.0 | 0.6 | GO:0003713 | transcription coactivator activity(GO:0003713) |
| 0.0 | 0.1 | GO:0050291 | sphingosine N-acyltransferase activity(GO:0050291) |
| 0.0 | 0.1 | GO:0004473 | malate dehydrogenase (decarboxylating) (NADP+) activity(GO:0004473) |
| 0.0 | 0.0 | GO:0097157 | U2 snRNA binding(GO:0030620) pre-mRNA intronic binding(GO:0097157) |
| 0.0 | 0.1 | GO:0009927 | histidine phosphotransfer kinase activity(GO:0009927) |
| 0.0 | 0.1 | GO:0004028 | 3-chloroallyl aldehyde dehydrogenase activity(GO:0004028) |
Gene overrepresentation in curated gene sets: canonical pathways category:
| Log-likelihood per target | Total log-likelihood | Term | Description |
|---|---|---|---|
| 0.5 | 1.5 | PID HIV NEF PATHWAY | HIV-1 Nef: Negative effector of Fas and TNF-alpha |
| 0.3 | 1.2 | PID CASPASE PATHWAY | Caspase cascade in apoptosis |
| 0.2 | 1.0 | PID REG GR PATHWAY | Glucocorticoid receptor regulatory network |
| 0.2 | 0.8 | PID VEGF VEGFR PATHWAY | VEGF and VEGFR signaling network |
| 0.2 | 0.7 | PID SMAD2 3NUCLEAR PATHWAY | Regulation of nuclear SMAD2/3 signaling |
| 0.1 | 0.6 | PID ATF2 PATHWAY | ATF-2 transcription factor network |
| 0.1 | 0.2 | NABA SECRETED FACTORS | Genes encoding secreted soluble factors |
| 0.1 | 0.7 | PID ATR PATHWAY | ATR signaling pathway |
| 0.1 | 0.2 | PID ARF 3PATHWAY | Arf1 pathway |
| 0.0 | 0.1 | PID BARD1 PATHWAY | BARD1 signaling events |
| 0.0 | 0.2 | ST WNT BETA CATENIN PATHWAY | Wnt/beta-catenin Pathway |
| 0.0 | 0.1 | PID HIF2PATHWAY | HIF-2-alpha transcription factor network |
| 0.0 | 0.1 | PID DELTA NP63 PATHWAY | Validated transcriptional targets of deltaNp63 isoforms |
| 0.0 | 0.2 | SIG INSULIN RECEPTOR PATHWAY IN CARDIAC MYOCYTES | Genes related to the insulin receptor pathway |
| 0.0 | 0.1 | PID CDC42 PATHWAY | CDC42 signaling events |
| 0.0 | 0.0 | NABA MATRISOME ASSOCIATED | Ensemble of genes encoding ECM-associated proteins including ECM-affilaited proteins, ECM regulators and secreted factors |
Gene overrepresentation in curated gene sets: REACTOME pathways category:
| Log-likelihood per target | Total log-likelihood | Term | Description |
|---|---|---|---|
| 0.5 | 1.5 | REACTOME NUCLEOTIDE BINDING DOMAIN LEUCINE RICH REPEAT CONTAINING RECEPTOR NLR SIGNALING PATHWAYS | Genes involved in Nucleotide-binding domain, leucine rich repeat containing receptor (NLR) signaling pathways |
| 0.3 | 0.8 | REACTOME APOPTOTIC EXECUTION PHASE | Genes involved in Apoptotic execution phase |
| 0.2 | 1.7 | REACTOME G0 AND EARLY G1 | Genes involved in G0 and Early G1 |
| 0.2 | 0.6 | REACTOME SEMAPHORIN INTERACTIONS | Genes involved in Semaphorin interactions |
| 0.2 | 0.8 | REACTOME GLUCONEOGENESIS | Genes involved in Gluconeogenesis |
| 0.1 | 1.1 | REACTOME CHEMOKINE RECEPTORS BIND CHEMOKINES | Genes involved in Chemokine receptors bind chemokines |
| 0.1 | 0.7 | REACTOME HOMOLOGOUS RECOMBINATION REPAIR OF REPLICATION INDEPENDENT DOUBLE STRAND BREAKS | Genes involved in Homologous recombination repair of replication-independent double-strand breaks |
| 0.1 | 0.2 | REACTOME VEGF LIGAND RECEPTOR INTERACTIONS | Genes involved in VEGF ligand-receptor interactions |
| 0.1 | 0.5 | REACTOME GENERIC TRANSCRIPTION PATHWAY | Genes involved in Generic Transcription Pathway |
| 0.1 | 0.3 | REACTOME MITOTIC PROMETAPHASE | Genes involved in Mitotic Prometaphase |
| 0.1 | 0.3 | REACTOME DOPAMINE NEUROTRANSMITTER RELEASE CYCLE | Genes involved in Dopamine Neurotransmitter Release Cycle |
| 0.1 | 0.2 | REACTOME COPI MEDIATED TRANSPORT | Genes involved in COPI Mediated Transport |
| 0.1 | 0.2 | REACTOME MRNA DECAY BY 5 TO 3 EXORIBONUCLEASE | Genes involved in mRNA Decay by 5' to 3' Exoribonuclease |
| 0.1 | 0.4 | REACTOME MEIOTIC RECOMBINATION | Genes involved in Meiotic Recombination |
| 0.1 | 0.5 | REACTOME ASPARAGINE N LINKED GLYCOSYLATION | Genes involved in Asparagine N-linked glycosylation |
| 0.0 | 0.0 | REACTOME LIPOPROTEIN METABOLISM | Genes involved in Lipoprotein metabolism |
| 0.0 | 0.1 | REACTOME GOLGI ASSOCIATED VESICLE BIOGENESIS | Genes involved in Golgi Associated Vesicle Biogenesis |
| 0.0 | 0.1 | REACTOME SIGNALING BY ROBO RECEPTOR | Genes involved in Signaling by Robo receptor |
| 0.0 | 0.1 | REACTOME RECYCLING OF BILE ACIDS AND SALTS | Genes involved in Recycling of bile acids and salts |
| 0.0 | 0.1 | REACTOME MITOCHONDRIAL PROTEIN IMPORT | Genes involved in Mitochondrial Protein Import |
| 0.0 | 0.0 | REACTOME G ALPHA I SIGNALLING EVENTS | Genes involved in G alpha (i) signalling events |