Project
GSE130291:vernalization in Arabidopsis thaliana
Navigation
Downloads
Results for AT3G12250
Z-value: 1.11
Transcription factors associated with AT3G12250
| Gene Symbol | Gene ID | Gene Info |
|---|---|---|
|
AT3G12250
|
AT3G12250 | TGACG motif-binding factor 6 |
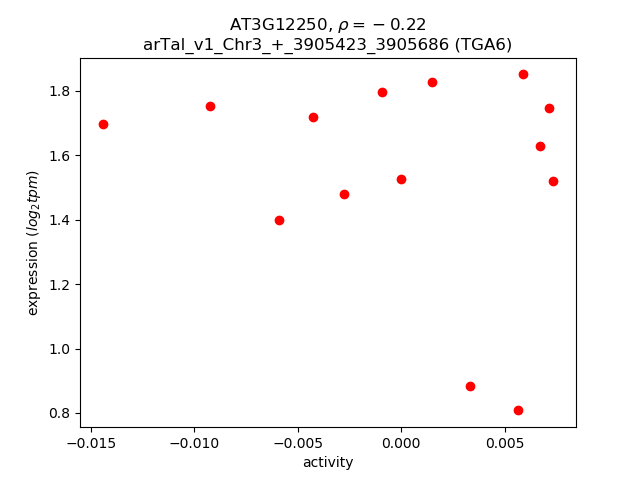
Activity-expression correlation:
| Gene | Promoter | Pearson corr. coef. | P-value | Plot |
|---|---|---|---|---|
| TGA6 | arTal_v1_Chr3_+_3905423_3905686 | -0.22 | 4.4e-01 | Click! |
Activity profile of AT3G12250 motif
Sorted Z-values of AT3G12250 motif
| Promoter | Log-likelihood | Transcript | Gene | Gene Info |
|---|---|---|---|---|
| arTal_v1_Chr2_-_17712290_17712330 | 1.24 |
AT2G42540.2
AT2G42540.4 AT2G42540.1 AT2G42540.3 |
COR15A
|
cold-regulated 15a |
| arTal_v1_Chr5_+_21240717_21240717 | 0.98 |
AT5G52310.1
|
LTI78
|
low-temperature-responsive protein 78 (LTI78) / desiccation-responsive protein 29A (RD29A) |
| arTal_v1_Chr1_+_3019639_3019639 | 0.88 |
AT1G09350.1
|
GolS3
|
galactinol synthase 3 |
| arTal_v1_Chr3_+_4104463_4104463 | 0.83 |
AT3G12900.1
|
AT3G12900
|
2-oxoglutarate (2OG) and Fe(II)-dependent oxygenase superfamily protein |
| arTal_v1_Chr1_+_3020221_3020221 | 0.81 |
AT1G09350.2
|
GolS3
|
galactinol synthase 3 |
| arTal_v1_Chr3_-_20576249_20576249 | 0.75 |
AT3G55500.1
|
EXPA16
|
expansin A16 |
| arTal_v1_Chr4_-_13016235_13016235 | 0.73 |
AT4G25470.1
|
CBF2
|
C-repeat/DRE binding factor 2 |
| arTal_v1_Chr1_-_9275193_9275193 | 0.72 |
AT1G26790.1
|
AT1G26790
|
Dof-type zinc finger DNA-binding family protein |
| arTal_v1_Chr4_+_15451988_15451988 | 0.71 |
AT4G31940.1
|
CYP82C4
|
cytochrome P450, family 82, subfamily C, polypeptide 4 |
| arTal_v1_Chr3_+_3595694_3595694 | 0.64 |
AT3G11430.1
|
GPAT5
|
glycerol-3-phosphate acyltransferase 5 |
| arTal_v1_Chr4_+_12827856_12827937 | 0.64 |
AT4G24960.1
AT4G24960.3 AT4G24960.2 |
HVA22D
|
HVA22 homologue D |
| arTal_v1_Chr1_+_5872024_5872024 | 0.61 |
AT1G17180.1
|
GSTU25
|
glutathione S-transferase TAU 25 |
| arTal_v1_Chr5_-_5692920_5692992 | 0.61 |
AT5G17300.2
AT5G17300.1 |
RVE1
|
Homeodomain-like superfamily protein |
| arTal_v1_Chr3_-_82182_82182 | 0.61 |
AT3G01260.1
|
AT3G01260
|
Galactose mutarotase-like superfamily protein |
| arTal_v1_Chr5_-_7054281_7054281 | 0.60 |
AT5G20830.3
|
SUS1
|
sucrose synthase 1 |
| arTal_v1_Chr5_-_7054713_7054713 | 0.60 |
AT5G20830.1
|
SUS1
|
sucrose synthase 1 |
| arTal_v1_Chr1_-_22871298_22871358 | 0.60 |
AT1G61890.3
AT1G61890.1 AT1G61890.2 |
AT1G61890
|
MATE efflux family protein |
| arTal_v1_Chr4_+_8827600_8827710 | 0.60 |
AT4G15430.2
AT4G15430.1 |
AT4G15430
|
ERD (early-responsive to dehydration stress) family protein |
| arTal_v1_Chr5_-_7055398_7055398 | 0.60 |
AT5G20830.2
|
SUS1
|
sucrose synthase 1 |
| arTal_v1_Chr5_-_6547127_6547177 | 0.59 |
AT5G19410.1
AT5G19410.2 |
ABCG23
|
ABC-2 type transporter family protein |
| arTal_v1_Chr2_+_13987669_13987669 | 0.58 |
AT2G32960.1
|
PFA-DSP2
|
Phosphotyrosine protein phosphatases superfamily protein |
| arTal_v1_Chr1_-_17266724_17266824 | 0.58 |
AT1G46768.3
AT1G46768.2 AT1G46768.1 |
RAP2.1
|
related to AP2 1 |
| arTal_v1_Chr5_-_17199793_17199910 | 0.56 |
AT5G42900.1
AT5G42900.3 AT5G42900.2 |
COR27
|
cold regulated protein 27 |
| arTal_v1_Chr5_+_1835047_1835047 | 0.55 |
AT5G06090.1
|
GPAT7
|
glycerol-3-phosphate acyltransferase 7 |
| arTal_v1_Chr5_-_5759817_5759817 | 0.53 |
AT5G17460.3
AT5G17460.2 AT5G17460.1 |
AT5G17460
|
glutamyl-tRNA (Gln) amidotransferase subunit C |
| arTal_v1_Chr5_+_4370692_4370692 | 0.53 |
AT5G13580.1
|
ABCG6
|
ABC-2 type transporter family protein |
| arTal_v1_Chr2_-_18082776_18082776 | 0.53 |
AT2G43590.1
|
AT2G43590
|
Chitinase family protein |
| arTal_v1_Chr3_-_8085669_8085669 | 0.52 |
AT3G22840.1
|
ELIP1
|
Chlorophyll A-B binding family protein |
| arTal_v1_Chr1_-_6579314_6579314 | 0.51 |
AT1G19050.1
|
ARR7
|
response regulator 7 |
| arTal_v1_Chr2_-_14489767_14489767 | 0.51 |
AT2G34340.1
|
AT2G34340
|
senescence regulator (Protein of unknown function, DUF584) |
| arTal_v1_Chr5_-_16998925_16998925 | 0.50 |
AT5G42510.1
|
AT5G42510
|
Disease resistance-responsive (dirigent-like protein) family protein |
| arTal_v1_Chr3_-_7557969_7557969 | 0.50 |
AT3G21460.1
|
AT3G21460
|
Glutaredoxin family protein |
| arTal_v1_Chr1_+_22198266_22198266 | 0.49 |
AT1G60190.1
|
PUB19
|
ARM repeat superfamily protein |
| arTal_v1_Chr4_+_5812335_5812335 | 0.49 |
AT4G09110.1
|
AT4G09110
|
RING/U-box superfamily protein |
| arTal_v1_Chr5_-_3728726_3728726 | 0.48 |
AT5G11590.1
|
TINY2
|
Integrase-type DNA-binding superfamily protein |
| arTal_v1_Chr5_-_23768111_23768111 | 0.48 |
AT5G58860.1
|
CYP86A1
|
cytochrome P450, family 86, subfamily A, polypeptide 1 |
| arTal_v1_Chr5_+_21688763_21688773 | 0.48 |
AT5G53450.2
AT5G53450.3 AT5G53450.1 |
ORG1
|
OBP3-responsive protein 1 |
| arTal_v1_Chr4_-_13022996_13022996 | 0.48 |
AT4G25490.1
|
CBF1
|
C-repeat/DRE binding factor 1 |
| arTal_v1_Chr5_-_4481950_4481950 | 0.47 |
AT5G13900.1
|
AT5G13900
|
Bifunctional inhibitor/lipid-transfer protein/seed storage 2S albumin superfamily protein |
| arTal_v1_Chr4_+_9655669_9655669 | 0.47 |
AT4G17215.1
|
AT4G17215
|
Pollen Ole e 1 allergen and extensin family protein |
| arTal_v1_Chr4_+_14762819_14762819 | 0.47 |
AT4G30170.1
|
AT4G30170
|
Peroxidase family protein |
| arTal_v1_Chr1_+_21652988_21652988 | 0.47 |
AT1G58340.1
|
ZF14
|
MATE efflux family protein |
| arTal_v1_Chr4_-_9680389_9680389 | 0.47 |
AT4G17280.1
|
AT4G17280
|
Auxin-responsive family protein |
| arTal_v1_Chr1_+_920950_920950 | 0.47 |
AT1G03700.1
|
AT1G03700
|
Uncharacterized protein family (UPF0497) |
| arTal_v1_Chr2_-_18821889_18821889 | 0.47 |
AT2G45680.1
|
TCP9
|
TCP family transcription factor |
| arTal_v1_Chr1_+_25701770_25701770 | 0.46 |
AT1G68500.1
|
AT1G68500
|
hypothetical protein |
| arTal_v1_Chr3_+_19845097_19845172 | 0.46 |
AT3G53530.2
AT3G53530.1 |
NAKR3
|
Chloroplast-targeted copper chaperone protein |
| arTal_v1_Chr3_-_19063538_19063538 | 0.46 |
AT3G51350.1
|
AT3G51350
|
Eukaryotic aspartyl protease family protein |
| arTal_v1_Chr3_-_489467_489467 | 0.45 |
AT3G02380.1
|
COL2
|
CONSTANS-like 2 |
| arTal_v1_Chr3_-_1756924_1756924 | 0.45 |
AT3G05880.1
|
RCI2A
|
Low temperature and salt responsive protein family |
| arTal_v1_Chr1_+_954290_954290 | 0.45 |
AT1G03790.1
|
SOM
|
Zinc finger C-x8-C-x5-C-x3-H type family protein |
| arTal_v1_Chr1_-_26163715_26163715 | 0.45 |
AT1G69570.1
|
AT1G69570
|
Dof-type zinc finger DNA-binding family protein |
| arTal_v1_Chr4_-_16285229_16285229 | 0.45 |
AT4G33980.1
|
AT4G33980
|
hypothetical protein |
| arTal_v1_Chr3_-_7796310_7796460 | 0.45 |
AT3G22120.1
AT3G22120.2 |
CWLP
|
cell wall-plasma membrane linker protein |
| arTal_v1_Chr5_-_6725966_6725966 | 0.45 |
AT5G19890.1
|
AT5G19890
|
Peroxidase superfamily protein |
| arTal_v1_Chr3_-_17475274_17475274 | 0.45 |
AT3G47420.3
AT3G47420.1 AT3G47420.2 |
G3Pp1
|
putative glycerol-3-phosphate transporter 1 |
| arTal_v1_Chr4_-_16285059_16285059 | 0.44 |
AT4G33980.2
|
AT4G33980
|
hypothetical protein |
| arTal_v1_Chr5_-_19977620_19977620 | 0.44 |
AT5G49280.1
|
AT5G49280
|
hydroxyproline-rich glycoprotein family protein |
| arTal_v1_Chr1_+_17766738_17766738 | 0.44 |
AT1G48100.1
|
AT1G48100
|
Pectin lyase-like superfamily protein |
| arTal_v1_Chr1_+_18305445_18305445 | 0.44 |
AT1G49450.1
|
AT1G49450
|
Transducin/WD40 repeat-like superfamily protein |
| arTal_v1_Chr3_-_18902152_18902152 | 0.44 |
AT3G50850.1
|
AT3G50850
|
Putative methyltransferase family protein |
| arTal_v1_Chr5_+_16161449_16161449 | 0.43 |
AT5G40390.1
|
SIP1
|
Raffinose synthase family protein |
| arTal_v1_Chr2_-_8235440_8235440 | 0.43 |
AT2G18980.1
|
AT2G18980
|
Peroxidase superfamily protein |
| arTal_v1_Chr5_+_22388782_22388782 | 0.43 |
AT5G55180.2
|
AT5G55180
|
O-Glycosyl hydrolases family 17 protein |
| arTal_v1_Chr3_+_18940643_18940643 | 0.43 |
AT3G50970.1
|
LTI30
|
dehydrin family protein |
| arTal_v1_Chr3_+_5025383_5025383 | 0.43 |
AT3G14940.2
|
PPC3
|
phosphoenolpyruvate carboxylase 3 |
| arTal_v1_Chr3_+_5025184_5025184 | 0.43 |
AT3G14940.1
|
PPC3
|
phosphoenolpyruvate carboxylase 3 |
| arTal_v1_Chr5_+_22808641_22808641 | 0.42 |
AT5G56320.2
AT5G56320.1 AT5G56320.3 |
EXPA14
|
expansin A14 |
| arTal_v1_Chr1_-_37757_37871 | 0.42 |
AT1G01060.3
AT1G01060.2 AT1G01060.4 AT1G01060.1 AT1G01060.6 AT1G01060.7 AT1G01060.5 |
LHY
|
Homeodomain-like superfamily protein |
| arTal_v1_Chr3_+_17268700_17268700 | 0.42 |
AT3G46900.1
|
COPT2
|
copper transporter 2 |
| arTal_v1_Chr5_+_22388521_22388521 | 0.42 |
AT5G55180.1
|
AT5G55180
|
O-Glycosyl hydrolases family 17 protein |
| arTal_v1_Chr3_+_5471735_5471735 | 0.42 |
AT3G16150.1
|
ASPGB1
|
N-terminal nucleophile aminohydrolases (Ntn hydrolases) superfamily protein |
| arTal_v1_Chr1_+_1529767_1529767 | 0.42 |
AT1G05260.1
|
RCI3
|
Peroxidase superfamily protein |
| arTal_v1_Chr3_-_2569700_2569700 | 0.42 |
AT3G08040.2
AT3G08040.1 |
FRD3
|
MATE efflux family protein |
| arTal_v1_Chr4_-_810574_810611 | 0.42 |
AT4G01870.1
AT4G01870.2 |
AT4G01870
|
tolB protein-like protein |
| arTal_v1_Chr3_-_7101637_7101637 | 0.42 |
AT3G20360.1
|
AT3G20360
|
TRAF-like family protein |
| arTal_v1_Chr5_-_5759449_5759449 | 0.41 |
AT5G17460.4
AT5G17460.5 |
AT5G17460
|
glutamyl-tRNA (Gln) amidotransferase subunit C |
| arTal_v1_Chr5_+_23337832_23337832 | 0.41 |
AT5G57625.1
|
AT5G57625
|
CAP (Cysteine-rich secretory proteins, Antigen 5, and Pathogenesis-related 1 protein) superfamily protein |
| arTal_v1_Chr1_-_3029549_3029549 | 0.41 |
AT1G09380.1
|
UMAMIT25
|
nodulin MtN21 /EamA-like transporter family protein |
| arTal_v1_Chr3_+_2946239_2946382 | 0.41 |
AT3G09600.1
AT3G09600.2 AT3G09600.4 AT3G09600.3 AT3G09600.7 AT3G09600.6 AT3G09600.5 AT3G09600.8 AT3G09600.9 |
RVE8
|
Homeodomain-like superfamily protein |
| arTal_v1_Chr1_+_1425539_1425539 | 0.40 |
AT1G05000.3
AT1G05000.1 AT1G05000.2 |
PFA-DSP1
|
Phosphotyrosine protein phosphatases superfamily protein |
| arTal_v1_Chr5_+_21069495_21069495 | 0.40 |
AT5G51830.2
|
AT5G51830
|
pfkB-like carbohydrate kinase family protein |
| arTal_v1_Chr5_+_21069110_21069110 | 0.40 |
AT5G51830.1
|
AT5G51830
|
pfkB-like carbohydrate kinase family protein |
| arTal_v1_Chr5_-_9366963_9366963 | 0.40 |
AT5G26620.1
|
AT5G26620
|
hypothetical protein |
| arTal_v1_Chr5_-_23117403_23117686 | 0.39 |
AT5G57110.3
AT5G57110.1 AT5G57110.2 |
ACA8
|
autoinhibited Ca2+ -ATPase, isoform 8 |
| arTal_v1_Chr5_-_17755742_17755768 | 0.39 |
AT5G44110.2
AT5G44110.4 AT5G44110.3 AT5G44110.1 |
ABCI21
|
P-loop containing nucleoside triphosphate hydrolases superfamily protein |
| arTal_v1_Chr4_-_857020_857020 | 0.39 |
AT4G01970.1
|
STS
|
stachyose synthase |
| arTal_v1_Chr1_+_27628678_27628678 | 0.39 |
AT1G73480.1
|
AT1G73480
|
alpha/beta-Hydrolases superfamily protein |
| arTal_v1_Chr5_+_2167468_2167536 | 0.38 |
AT5G06980.4
AT5G06980.3 AT5G06980.5 AT5G06980.2 |
AT5G06980
|
hypothetical protein |
| arTal_v1_Chr4_-_18472048_18472048 | 0.38 |
AT4G39800.1
|
MIPS1
|
myo-inositol-1-phosphate synthase 1 |
| arTal_v1_Chr1_-_10356482_10356482 | 0.38 |
AT1G29640.1
|
AT1G29640
|
senescence regulator (Protein of unknown function, DUF584) |
| arTal_v1_Chr2_-_15955752_15955752 | 0.38 |
AT2G38110.1
|
GPAT6
|
glycerol-3-phosphate acyltransferase 6 |
| arTal_v1_Chr3_-_19139423_19139423 | 0.38 |
AT3G51600.1
|
LTP5
|
lipid transfer protein 5 |
| arTal_v1_Chr1_-_27989865_27989865 | 0.38 |
AT1G74460.1
|
AT1G74460
|
GDSL-like Lipase/Acylhydrolase superfamily protein |
| arTal_v1_Chr1_-_7455009_7455009 | 0.38 |
AT1G21310.1
|
EXT3
|
extensin 3 |
| arTal_v1_Chr4_-_84709_84770 | 0.38 |
AT4G00200.2
AT4G00200.1 |
AT4G00200
|
AT hook motif DNA-binding family protein |
| arTal_v1_Chr4_-_857401_857401 | 0.38 |
AT4G01970.2
|
STS
|
stachyose synthase |
| arTal_v1_Chr5_-_2359311_2359311 | 0.38 |
AT5G07450.1
|
CYCP4%3B3
|
cyclin p4;3 |
| arTal_v1_Chr2_+_15056753_15056753 | 0.38 |
AT2G35850.1
|
AT2G35850
|
transmembrane protein |
| arTal_v1_Chr5_-_23263457_23263479 | 0.38 |
AT5G57400.1
AT5G57400.2 |
AT5G57400
|
transmembrane protein |
| arTal_v1_Chr1_-_30202349_30202349 | 0.37 |
AT1G80340.1
|
GA3OX2
|
gibberellin 3-oxidase 2 |
| arTal_v1_Chr5_+_15878698_15878726 | 0.37 |
AT5G39660.1
AT5G39660.3 AT5G39660.2 |
CDF2
|
cycling DOF factor 2 |
| arTal_v1_Chr5_-_5890218_5890260 | 0.37 |
AT5G17820.1
AT5G17820.2 |
AT5G17820
|
Peroxidase superfamily protein |
| arTal_v1_Chr5_+_2167120_2167120 | 0.37 |
AT5G06980.1
|
AT5G06980
|
hypothetical protein |
| arTal_v1_Chr1_-_16917053_16917053 | 0.37 |
AT1G44800.1
|
SIAR1
|
nodulin MtN21 /EamA-like transporter family protein |
| arTal_v1_Chr5_-_22115539_22115539 | 0.37 |
AT5G54470.1
|
BBX29
|
B-box type zinc finger family protein |
| arTal_v1_Chr3_+_22935510_22935510 | 0.37 |
AT3G61930.1
|
AT3G61930
|
hypothetical protein |
| arTal_v1_Chr5_+_20427749_20427749 | 0.37 |
AT5G50175.1
|
AT5G50175
|
transmembrane protein |
| arTal_v1_Chr1_-_29459493_29459493 | 0.37 |
AT1G78290.2
AT1G78290.3 |
SNRK2-8
|
Protein kinase superfamily protein |
| arTal_v1_Chr5_-_2041928_2041928 | 0.36 |
AT5G06640.2
AT5G06640.1 |
EXT10
|
Proline-rich extensin-like family protein |
| arTal_v1_Chr2_-_19638678_19638678 | 0.36 |
AT2G47990.1
|
SWA1
|
transducin family protein / WD-40 repeat family protein |
| arTal_v1_Chr4_+_15455083_15455083 | 0.36 |
AT4G31950.1
|
CYP82C3
|
cytochrome P450, family 82, subfamily C, polypeptide 3 |
| arTal_v1_Chr2_-_19207608_19207608 | 0.36 |
AT2G46740.1
|
GulLO5
|
D-arabinono-1,4-lactone oxidase family protein |
| arTal_v1_Chr4_+_5244865_5244865 | 0.36 |
AT4G08300.1
|
UMAMIT17
|
nodulin MtN21 /EamA-like transporter family protein |
| arTal_v1_Chr1_+_5869543_5869543 | 0.36 |
AT1G17170.1
|
GSTU24
|
glutathione S-transferase TAU 24 |
| arTal_v1_Chr4_+_2572621_2572621 | 0.36 |
AT4G05020.2
|
NDB2
|
NAD(P)H dehydrogenase B2 |
| arTal_v1_Chr4_+_2572427_2572427 | 0.35 |
AT4G05020.1
|
NDB2
|
NAD(P)H dehydrogenase B2 |
| arTal_v1_Chr5_-_6976036_6976036 | 0.35 |
AT5G20630.1
|
GER3
|
germin 3 |
| arTal_v1_Chr4_+_131422_131422 | 0.35 |
AT4G00305.1
|
AT4G00305
|
RING/U-box superfamily protein |
| arTal_v1_Chr1_+_209208_209208 | 0.35 |
AT1G01580.1
|
FRO2
|
ferric reduction oxidase 2 |
| arTal_v1_Chr1_+_208995_208995 | 0.35 |
AT1G01580.2
|
FRO2
|
ferric reduction oxidase 2 |
| arTal_v1_Chr4_-_16347364_16347434 | 0.35 |
AT4G34135.1
AT4G34135.2 |
UGT73B2
|
UDP-glucosyltransferase 73B2 |
| arTal_v1_Chr1_+_10991478_10991478 | 0.35 |
AT1G30870.1
|
AT1G30870
|
Peroxidase superfamily protein |
| arTal_v1_Chr1_+_18198227_18198227 | 0.35 |
AT1G49200.1
|
AT1G49200
|
RING/U-box superfamily protein |
| arTal_v1_Chr4_+_13675537_13675537 | 0.35 |
AT4G27310.1
|
BBX28
|
B-box type zinc finger family protein |
| arTal_v1_Chr1_+_8709941_8709941 | 0.35 |
AT1G24580.1
|
AT1G24580
|
RING/U-box superfamily protein |
| arTal_v1_Chr4_+_17639_17784 | 0.35 |
AT4G00050.1
AT4G00050.3 AT4G00050.2 |
UNE10
|
basic helix-loop-helix (bHLH) DNA-binding superfamily protein |
| arTal_v1_Chr2_-_7496292_7496292 | 0.35 |
AT2G17230.1
|
EXL5
|
EXORDIUM like 5 |
| arTal_v1_Chr1_-_37230_37230 | 0.35 |
AT1G01060.8
|
LHY
|
Homeodomain-like superfamily protein |
| arTal_v1_Chr1_-_25885261_25885261 | 0.34 |
AT1G68850.1
|
AT1G68850
|
Peroxidase superfamily protein |
| arTal_v1_Chr5_+_4432297_4432306 | 0.34 |
AT5G13740.2
AT5G13740.1 |
ZIF1
|
zinc induced facilitator 1 |
| arTal_v1_Chr1_-_9890875_9891015 | 0.34 |
AT1G28290.2
AT1G28290.1 |
AGP31
|
arabinogalactan protein 31 |
| arTal_v1_Chr3_-_68665_68665 | 0.34 |
AT3G01190.1
|
AT3G01190
|
Peroxidase superfamily protein |
| arTal_v1_Chr2_+_17527167_17527167 | 0.34 |
AT2G41990.1
|
AT2G41990
|
late embryogenesis abundant protein |
| arTal_v1_Chr1_-_5645443_5645443 | 0.34 |
AT1G16510.1
|
AT1G16510
|
SAUR-like auxin-responsive protein family |
| arTal_v1_Chr3_-_21499943_21499943 | 0.34 |
AT3G58060.1
|
AT3G58060
|
Cation efflux family protein |
| arTal_v1_Chr4_+_1569937_1569937 | 0.34 |
AT4G03540.1
|
AT4G03540
|
Uncharacterized protein family (UPF0497) |
| arTal_v1_Chr5_+_7426310_7426310 | 0.34 |
AT5G22410.1
|
RHS18
|
root hair specific 18 |
| arTal_v1_Chr5_-_3018342_3018342 | 0.34 |
AT5G09730.1
|
BXL3
|
beta-xylosidase 3 |
| arTal_v1_Chr5_+_3536189_3536189 | 0.34 |
AT5G11110.1
|
SPS2F
|
sucrose phosphate synthase 2F |
| arTal_v1_Chr5_-_5862462_5862475 | 0.34 |
AT5G17760.2
AT5G17760.1 |
AT5G17760
|
P-loop containing nucleoside triphosphate hydrolases superfamily protein |
| arTal_v1_Chr5_+_463073_463073 | 0.34 |
AT5G02260.1
|
EXPA9
|
expansin A9 |
| arTal_v1_Chr3_-_21499676_21499676 | 0.34 |
AT3G58060.2
|
AT3G58060
|
Cation efflux family protein |
| arTal_v1_Chr1_+_993400_993400 | 0.33 |
AT1G03905.4
AT1G03905.2 AT1G03905.1 AT1G03905.3 |
ABCI19
|
P-loop containing nucleoside triphosphate hydrolases superfamily protein |
| arTal_v1_Chr4_-_17267472_17267472 | 0.33 |
AT4G36610.1
|
AT4G36610
|
alpha/beta-Hydrolases superfamily protein |
| arTal_v1_Chr5_-_23108883_23108883 | 0.33 |
AT5G57100.4
AT5G57100.1 AT5G57100.2 AT5G57100.3 |
AT5G57100
|
Nucleotide/sugar transporter family protein |
| arTal_v1_Chr3_+_6119707_6119707 | 0.33 |
AT3G17860.4
AT3G17860.1 |
JAZ3
|
jasmonate-zim-domain protein 3 |
| arTal_v1_Chr4_-_14117367_14117367 | 0.33 |
AT4G28560.1
|
RIC7
|
ROP-interactive CRIB motif-containing protein 7 |
| arTal_v1_Chr1_+_29354944_29354944 | 0.33 |
AT1G78070.1
|
AT1G78070
|
Transducin/WD40 repeat-like superfamily protein |
| arTal_v1_Chr2_+_15119516_15119589 | 0.33 |
AT2G36010.3
AT2G36010.1 AT2G36010.2 |
E2F3
|
E2F transcription factor 3 |
| arTal_v1_Chr2_+_9592956_9592956 | 0.33 |
AT2G22590.1
|
AT2G22590
|
UDP-Glycosyltransferase superfamily protein |
| arTal_v1_Chr5_+_25703649_25703649 | 0.33 |
AT5G64260.1
|
EXL2
|
EXORDIUM like 2 |
| arTal_v1_Chr5_+_1461786_1461786 | 0.33 |
AT5G04960.1
|
AT5G04960
|
Plant invertase/pectin methylesterase inhibitor superfamily |
| arTal_v1_Chr3_+_4449259_4449259 | 0.32 |
AT3G13610.1
|
AT3G13610
|
2-oxoglutarate (2OG) and Fe(II)-dependent oxygenase superfamily protein |
| arTal_v1_Chr2_-_16690182_16690182 | 0.32 |
AT2G39980.1
|
AT2G39980
|
HXXXD-type acyl-transferase family protein |
| arTal_v1_Chr1_-_27509272_27509272 | 0.32 |
AT1G73165.1
|
CLE1
|
CLAVATA3/ESR-RELATED 1 |
| arTal_v1_Chr4_-_9368852_9368852 | 0.32 |
AT4G16640.1
|
AT4G16640
|
Matrixin family protein |
| arTal_v1_Chr5_+_894582_894582 | 0.32 |
AT5G03545.1
|
AT5G03545
|
expressed in response to phosphate starvation protein |
| arTal_v1_Chr1_-_7089606_7089606 | 0.32 |
AT1G20450.1
AT1G20450.2 |
ERD10
|
Dehydrin family protein |
| arTal_v1_Chr5_-_19291103_19291103 | 0.32 |
AT5G47560.1
|
TDT
|
tonoplast dicarboxylate transporter |
| arTal_v1_Chr3_+_10576961_10576961 | 0.32 |
AT3G28310.1
|
AT3G28310
|
hypothetical protein (DUF677) |
| arTal_v1_Chr2_-_15036556_15036556 | 0.32 |
AT2G35770.1
|
scpl28
|
serine carboxypeptidase-like 28 |
| arTal_v1_Chr5_+_26894778_26894778 | 0.32 |
AT5G67400.1
|
RHS19
|
root hair specific 19 |
| arTal_v1_Chr3_+_3556554_3556554 | 0.32 |
AT3G11340.1
|
UGT76B1
|
UDP-Glycosyltransferase superfamily protein |
| arTal_v1_Chr2_+_10622396_10622453 | 0.32 |
AT2G24980.2
AT2G24980.3 AT2G24980.1 |
EXT6
|
Proline-rich extensin-like family protein |
| arTal_v1_Chr3_+_22298373_22298380 | 0.32 |
AT3G60330.2
AT3G60330.3 |
HA7
|
H[+]-ATPase 7 |
| arTal_v1_Chr1_-_3444360_3444360 | 0.32 |
AT1G10470.1
|
ARR4
|
response regulator 4 |
| arTal_v1_Chr5_+_21771811_21771811 | 0.32 |
AT5G53590.1
|
AT5G53590
|
SAUR-like auxin-responsive protein family |
| arTal_v1_Chr3_+_19825267_19825267 | 0.32 |
AT3G53480.1
|
ABCG37
|
pleiotropic drug resistance 9 |
| arTal_v1_Chr3_+_22298549_22298578 | 0.31 |
AT3G60330.4
AT3G60330.1 |
HA7
|
H[+]-ATPase 7 |
| arTal_v1_Chr1_-_105330_105330 | 0.31 |
AT1G01250.1
|
AT1G01250
|
Integrase-type DNA-binding superfamily protein |
| arTal_v1_Chr3_+_6120029_6120029 | 0.31 |
AT3G17860.3
AT3G17860.2 |
JAZ3
|
jasmonate-zim-domain protein 3 |
| arTal_v1_Chr1_-_3443957_3443957 | 0.31 |
AT1G10470.3
AT1G10470.2 |
ARR4
|
response regulator 4 |
| arTal_v1_Chr1_-_10553295_10553295 | 0.31 |
AT1G30080.1
AT1G30080.2 |
AT1G30080
|
Glycosyl hydrolase superfamily protein |
| arTal_v1_Chr3_-_4496800_4496800 | 0.31 |
AT3G13720.1
|
PRA8
|
PRA1 (Prenylated rab acceptor) family protein |
| arTal_v1_Chr2_-_10711281_10711281 | 0.31 |
AT2G25160.2
AT2G25160.1 |
CYP82F1
|
cytochrome P450, family 82, subfamily F, polypeptide 1 |
| arTal_v1_Chr2_+_19437648_19437648 | 0.31 |
AT2G47360.1
|
AT2G47360
|
transmembrane protein |
| arTal_v1_Chr4_-_15857440_15857440 | 0.31 |
AT4G32860.1
|
AT4G32860
|
Avr9/Cf-9 rapidly elicited protein |
| arTal_v1_Chr5_-_1994824_1994961 | 0.31 |
AT5G06530.2
AT5G06530.3 AT5G06530.4 AT5G06530.1 |
ABCG22
|
ABC-2 type transporter family protein |
| arTal_v1_Chr5_-_20111806_20111806 | 0.31 |
AT5G49560.1
|
AT5G49560
|
Putative methyltransferase family protein |
| arTal_v1_Chr3_+_18291339_18291429 | 0.31 |
AT3G49330.2
AT3G49330.1 |
AT3G49330
|
Plant invertase/pectin methylesterase inhibitor superfamily protein |
| arTal_v1_Chr2_+_10258107_10258148 | 0.31 |
AT2G24130.2
AT2G24130.1 |
AT2G24130
|
Leucine-rich receptor-like protein kinase family protein |
| arTal_v1_Chr3_-_4657723_4657723 | 0.31 |
AT3G14060.1
|
AT3G14060
|
hypothetical protein |
| arTal_v1_Chr5_-_22712441_22712441 | 0.31 |
AT5G56080.1
|
NAS2
|
nicotianamine synthase 2 |
| arTal_v1_Chr4_+_15230008_15230008 | 0.31 |
AT4G31380.1
|
FLP1
|
flowering-promoting factor-like protein |
| arTal_v1_Chr5_-_1558486_1558486 | 0.30 |
AT5G05250.1
|
AT5G05250
|
hypothetical protein |
| arTal_v1_Chr3_+_17427950_17427950 | 0.30 |
AT3G47295.1
|
AT3G47295
|
hypothetical protein |
| arTal_v1_Chr5_+_23100516_23100641 | 0.30 |
AT5G57090.1
AT5G57090.2 |
EIR1
|
Auxin efflux carrier family protein |
| arTal_v1_Chr2_-_14677398_14677398 | 0.30 |
AT2G34790.1
|
MEE23
|
FAD-binding Berberine family protein |
| arTal_v1_Chr4_+_16746525_16746525 | 0.30 |
AT4G35190.2
|
LOG5
|
Putative lysine decarboxylase family protein |
| arTal_v1_Chr2_-_19378331_19378331 | 0.30 |
AT2G47200.1
|
AT2G47200
|
hypothetical protein |
| arTal_v1_Chr3_-_5526212_5526212 | 0.30 |
AT3G16300.1
|
AT3G16300
|
Uncharacterized protein family (UPF0497) |
| arTal_v1_Chr1_-_2195996_2195996 | 0.30 |
AT1G07150.1
|
MAPKKK13
|
mitogen-activated protein kinase kinase kinase 13 |
| arTal_v1_Chr1_+_7610241_7610241 | 0.30 |
AT1G21670.1
|
AT1G21670
|
DPP6 amino-terminal domain protein |
| arTal_v1_Chr3_-_23046153_23046153 | 0.30 |
AT3G62270.1
|
AT3G62270
|
HCO3- transporter family |
| arTal_v1_Chr3_+_5720941_5721030 | 0.30 |
AT3G16800.5
AT3G16800.4 AT3G16800.2 AT3G16800.6 AT3G16800.1 |
AT3G16800
|
Protein phosphatase 2C family protein |
| arTal_v1_Chr2_+_16076289_16076289 | 0.30 |
AT2G38380.1
|
AT2G38380
|
Peroxidase superfamily protein |
| arTal_v1_Chr1_-_2195798_2195798 | 0.30 |
AT1G07150.2
|
MAPKKK13
|
mitogen-activated protein kinase kinase kinase 13 |
| arTal_v1_Chr3_+_5721225_5721225 | 0.30 |
AT3G16800.3
|
AT3G16800
|
Protein phosphatase 2C family protein |
| arTal_v1_Chr1_+_8195776_8195776 | 0.30 |
AT1G23100.1
|
AT1G23100
|
GroES-like family protein |
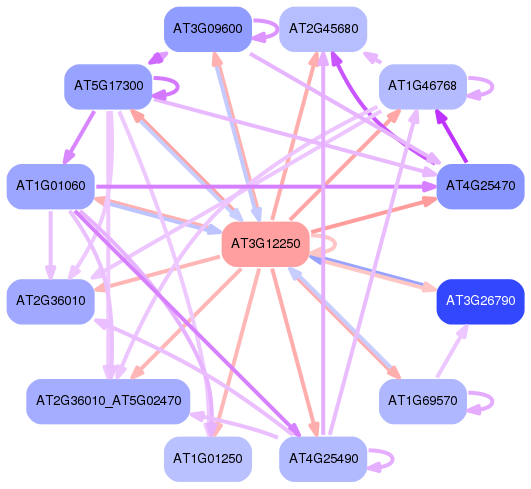
Network of associatons between targets according to the STRING database.

First level regulatory network of AT3G12250
Gene Ontology Analysis
Gene overrepresentation in biological process category:
| Log-likelihood per target | Total log-likelihood | Term | Description |
|---|---|---|---|
| 0.7 | 0.7 | GO:0071281 | cellular response to iron ion(GO:0071281) |
| 0.4 | 1.8 | GO:0072708 | response to sorbitol(GO:0072708) |
| 0.2 | 0.7 | GO:1990532 | stress response to nickel ion(GO:1990532) |
| 0.2 | 0.2 | GO:0019322 | pentose biosynthetic process(GO:0019322) arabinose biosynthetic process(GO:0019567) |
| 0.2 | 0.7 | GO:0043433 | negative regulation of sequence-specific DNA binding transcription factor activity(GO:0043433) |
| 0.2 | 0.5 | GO:0006059 | hexitol metabolic process(GO:0006059) hexitol biosynthetic process(GO:0019406) mannitol biosynthetic process(GO:0019593) mannitol metabolic process(GO:0019594) |
| 0.2 | 0.6 | GO:0010507 | negative regulation of autophagy(GO:0010507) |
| 0.2 | 1.4 | GO:0009819 | drought recovery(GO:0009819) |
| 0.1 | 0.6 | GO:0033499 | galactose catabolic process(GO:0019388) galactose catabolic process via UDP-galactose(GO:0033499) |
| 0.1 | 0.7 | GO:0071366 | cellular response to indolebutyric acid stimulus(GO:0071366) |
| 0.1 | 0.5 | GO:0046498 | S-adenosylmethionine cycle(GO:0033353) S-adenosylhomocysteine metabolic process(GO:0046498) |
| 0.1 | 0.4 | GO:0016540 | protein autoprocessing(GO:0016540) |
| 0.1 | 0.4 | GO:0006658 | phosphatidylserine metabolic process(GO:0006658) phosphatidylserine biosynthetic process(GO:0006659) |
| 0.1 | 0.5 | GO:0030417 | nicotianamine metabolic process(GO:0030417) nicotianamine biosynthetic process(GO:0030418) tricarboxylic acid biosynthetic process(GO:0072351) |
| 0.1 | 0.2 | GO:1903793 | positive regulation of transporter activity(GO:0032411) positive regulation of ion transmembrane transporter activity(GO:0032414) positive regulation of anion channel activity(GO:1901529) positive regulation of anion transport(GO:1903793) positive regulation of anion transmembrane transport(GO:1903961) |
| 0.1 | 0.1 | GO:0043062 | extracellular matrix organization(GO:0030198) extracellular structure organization(GO:0043062) |
| 0.1 | 0.8 | GO:0071588 | hydrogen peroxide mediated signaling pathway(GO:0071588) |
| 0.1 | 0.3 | GO:0044259 | collagen metabolic process(GO:0032963) multicellular organism metabolic process(GO:0044236) multicellular organismal macromolecule metabolic process(GO:0044259) |
| 0.1 | 0.2 | GO:0048480 | stigma development(GO:0048480) |
| 0.1 | 0.3 | GO:0044277 | cell wall modification involved in abscission(GO:0009830) cell wall disassembly(GO:0044277) |
| 0.1 | 0.8 | GO:0043090 | amino acid import(GO:0043090) |
| 0.1 | 0.5 | GO:0071786 | endoplasmic reticulum tubular network organization(GO:0071786) |
| 0.1 | 0.4 | GO:0071836 | nectar secretion(GO:0071836) |
| 0.1 | 0.3 | GO:1900386 | positive regulation of flavonol biosynthetic process(GO:1900386) |
| 0.1 | 0.5 | GO:0048455 | stamen formation(GO:0048455) |
| 0.1 | 0.4 | GO:1900409 | positive regulation of cellular response to oxidative stress(GO:1900409) |
| 0.1 | 1.6 | GO:1902074 | response to salt(GO:1902074) |
| 0.1 | 0.4 | GO:0010606 | positive regulation of cytoplasmic mRNA processing body assembly(GO:0010606) |
| 0.1 | 0.3 | GO:0032196 | transposition(GO:0032196) |
| 0.1 | 0.4 | GO:0009831 | plant-type cell wall modification involved in multidimensional cell growth(GO:0009831) |
| 0.1 | 0.6 | GO:0071492 | response to UV-A(GO:0070141) cellular response to UV-A(GO:0071492) |
| 0.1 | 0.3 | GO:2001009 | regulation of plant-type cell wall cellulose biosynthetic process(GO:2001009) |
| 0.1 | 0.4 | GO:0015739 | sialic acid transport(GO:0015739) |
| 0.1 | 0.4 | GO:1901601 | lactone metabolic process(GO:1901334) lactone biosynthetic process(GO:1901336) strigolactone metabolic process(GO:1901600) strigolactone biosynthetic process(GO:1901601) |
| 0.1 | 0.4 | GO:1901562 | response to paraquat(GO:1901562) |
| 0.1 | 0.1 | GO:0035280 | miRNA loading onto RISC involved in gene silencing by miRNA(GO:0035280) small RNA loading onto RISC(GO:0070922) |
| 0.1 | 0.7 | GO:0060774 | auxin mediated signaling pathway involved in phyllotactic patterning(GO:0060774) |
| 0.1 | 0.3 | GO:0010480 | microsporocyte differentiation(GO:0010480) |
| 0.1 | 0.3 | GO:0015786 | UDP-glucose transport(GO:0015786) |
| 0.1 | 1.6 | GO:0006074 | (1->3)-beta-D-glucan metabolic process(GO:0006074) (1->3)-beta-D-glucan biosynthetic process(GO:0006075) |
| 0.1 | 0.2 | GO:0010376 | stomatal complex formation(GO:0010376) |
| 0.1 | 0.2 | GO:0006493 | protein O-linked glycosylation(GO:0006493) |
| 0.1 | 0.2 | GO:0015696 | ammonium transport(GO:0015696) |
| 0.1 | 0.3 | GO:0030856 | regulation of epithelial cell differentiation(GO:0030856) regulation of epidermal cell differentiation(GO:0045604) regulation of epidermis development(GO:0045682) |
| 0.1 | 0.2 | GO:0010501 | RNA secondary structure unwinding(GO:0010501) |
| 0.1 | 0.5 | GO:1901332 | negative regulation of lateral root development(GO:1901332) |
| 0.1 | 0.2 | GO:0031538 | negative regulation of anthocyanin metabolic process(GO:0031538) |
| 0.1 | 0.2 | GO:0033567 | DNA replication, Okazaki fragment processing(GO:0033567) |
| 0.1 | 0.4 | GO:0042351 | 'de novo' GDP-L-fucose biosynthetic process(GO:0042351) |
| 0.1 | 0.1 | GO:0055047 | generative cell mitosis(GO:0055047) |
| 0.1 | 0.7 | GO:0010951 | negative regulation of endopeptidase activity(GO:0010951) regulation of endopeptidase activity(GO:0052548) |
| 0.1 | 0.2 | GO:0071461 | cellular response to redox state(GO:0071461) |
| 0.1 | 0.1 | GO:0031114 | regulation of microtubule depolymerization(GO:0031114) |
| 0.1 | 0.5 | GO:0010233 | vascular transport(GO:0010232) phloem transport(GO:0010233) |
| 0.1 | 0.9 | GO:0006621 | protein retention in ER lumen(GO:0006621) |
| 0.1 | 1.9 | GO:0006012 | galactose metabolic process(GO:0006012) |
| 0.1 | 0.2 | GO:0030638 | polyketide metabolic process(GO:0030638) |
| 0.1 | 0.3 | GO:0048464 | sepal development(GO:0048442) flower calyx development(GO:0048464) |
| 0.1 | 0.3 | GO:0032951 | regulation of beta-glucan metabolic process(GO:0032950) regulation of beta-glucan biosynthetic process(GO:0032951) regulation of cellulose biosynthetic process(GO:2001006) |
| 0.1 | 0.2 | GO:0035461 | thiamine pyrophosphate transport(GO:0030974) vitamin transmembrane transport(GO:0035461) azole transport(GO:0045117) |
| 0.1 | 0.2 | GO:0051775 | response to redox state(GO:0051775) |
| 0.1 | 0.2 | GO:0043132 | NAD transport(GO:0043132) |
| 0.1 | 0.2 | GO:0010541 | acropetal auxin transport(GO:0010541) |
| 0.1 | 1.9 | GO:0010187 | negative regulation of seed germination(GO:0010187) |
| 0.1 | 0.4 | GO:0043328 | protein targeting to vacuole involved in ubiquitin-dependent protein catabolic process via the multivesicular body sorting pathway(GO:0043328) |
| 0.1 | 0.3 | GO:0006023 | aminoglycan biosynthetic process(GO:0006023) glycosaminoglycan biosynthetic process(GO:0006024) UDP-glucuronate biosynthetic process(GO:0006065) glycosaminoglycan metabolic process(GO:0030203) |
| 0.1 | 0.1 | GO:0006063 | uronic acid metabolic process(GO:0006063) galacturonate metabolic process(GO:0019586) |
| 0.1 | 0.9 | GO:0055069 | zinc ion homeostasis(GO:0055069) |
| 0.1 | 0.1 | GO:0032025 | response to cobalt ion(GO:0032025) |
| 0.1 | 0.2 | GO:1903335 | regulation of vacuolar transport(GO:1903335) |
| 0.1 | 1.2 | GO:0046341 | CDP-diacylglycerol biosynthetic process(GO:0016024) CDP-diacylglycerol metabolic process(GO:0046341) |
| 0.1 | 0.2 | GO:2000653 | guard cell fate commitment(GO:0010377) regulation of G1/S transition of mitotic cell cycle(GO:2000045) regulation of genetic imprinting(GO:2000653) |
| 0.1 | 0.2 | GO:0019368 | fatty acid elongation, saturated fatty acid(GO:0019367) fatty acid elongation, unsaturated fatty acid(GO:0019368) fatty acid elongation, monounsaturated fatty acid(GO:0034625) fatty acid elongation, polyunsaturated fatty acid(GO:0034626) |
| 0.1 | 0.8 | GO:0032922 | circadian regulation of gene expression(GO:0032922) |
| 0.1 | 0.2 | GO:0010434 | bract development(GO:0010432) bract morphogenesis(GO:0010433) bract formation(GO:0010434) |
| 0.1 | 0.2 | GO:0030100 | regulation of endocytosis(GO:0030100) |
| 0.1 | 0.2 | GO:0034635 | glutathione transport(GO:0034635) tripeptide transport(GO:0042939) |
| 0.1 | 0.3 | GO:0010148 | transpiration(GO:0010148) |
| 0.1 | 0.2 | GO:0009866 | induced systemic resistance, ethylene mediated signaling pathway(GO:0009866) |
| 0.1 | 0.1 | GO:0010599 | production of lsiRNA involved in RNA interference(GO:0010599) |
| 0.1 | 0.3 | GO:0010508 | positive regulation of autophagy(GO:0010508) |
| 0.1 | 0.2 | GO:0048832 | specification of organ number(GO:0048832) specification of floral organ number(GO:0048833) |
| 0.1 | 0.2 | GO:0046741 | transport of virus in host, tissue to tissue(GO:0046741) |
| 0.1 | 0.2 | GO:0017145 | stem cell division(GO:0017145) |
| 0.1 | 0.2 | GO:0031336 | negative regulation of ethylene biosynthetic process(GO:0010366) negative regulation of sulfur amino acid metabolic process(GO:0031336) negative regulation of cellular amine metabolic process(GO:0033239) negative regulation of cellular amino acid metabolic process(GO:0045763) negative regulation of sulfur metabolic process(GO:0051175) negative regulation of olefin metabolic process(GO:1900909) negative regulation of olefin biosynthetic process(GO:1900912) |
| 0.1 | 0.1 | GO:0051512 | positive regulation of unidimensional cell growth(GO:0051512) |
| 0.1 | 0.8 | GO:0048766 | root hair initiation(GO:0048766) |
| 0.1 | 0.3 | GO:0009647 | skotomorphogenesis(GO:0009647) |
| 0.1 | 2.1 | GO:0055072 | iron ion homeostasis(GO:0055072) |
| 0.1 | 0.2 | GO:0045002 | DNA double-strand break processing involved in repair via single-strand annealing(GO:0010792) double-strand break repair via single-strand annealing(GO:0045002) |
| 0.1 | 0.2 | GO:0080168 | abscisic acid transport(GO:0080168) |
| 0.1 | 0.6 | GO:0051446 | positive regulation of meiotic cell cycle(GO:0051446) |
| 0.1 | 0.4 | GO:0031222 | arabinan catabolic process(GO:0031222) |
| 0.1 | 0.4 | GO:0035434 | copper ion transmembrane transport(GO:0035434) |
| 0.1 | 0.2 | GO:0060145 | viral gene silencing in virus induced gene silencing(GO:0060145) |
| 0.1 | 0.2 | GO:0045948 | positive regulation of translational initiation(GO:0045948) |
| 0.1 | 0.2 | GO:0035445 | borate transmembrane transport(GO:0035445) |
| 0.1 | 0.2 | GO:0042450 | arginine biosynthetic process via ornithine(GO:0042450) |
| 0.0 | 0.7 | GO:0010274 | hydrotropism(GO:0010274) |
| 0.0 | 0.2 | GO:0080140 | regulation of jasmonic acid metabolic process(GO:0080140) regulation of jasmonic acid biosynthetic process(GO:0080141) |
| 0.0 | 0.3 | GO:0010086 | embryonic root morphogenesis(GO:0010086) |
| 0.0 | 0.1 | GO:0010113 | negative regulation of systemic acquired resistance(GO:0010113) |
| 0.0 | 0.2 | GO:0048462 | carpel formation(GO:0048462) |
| 0.0 | 0.1 | GO:0006348 | chromatin silencing at telomere(GO:0006348) |
| 0.0 | 0.2 | GO:1990019 | protein storage vacuole organization(GO:1990019) |
| 0.0 | 0.4 | GO:0051214 | RNA virus induced gene silencing(GO:0051214) |
| 0.0 | 0.6 | GO:0070298 | negative regulation of ethylene-activated signaling pathway(GO:0010105) negative regulation of phosphorelay signal transduction system(GO:0070298) |
| 0.0 | 0.1 | GO:0042908 | xenobiotic transport(GO:0042908) |
| 0.0 | 0.1 | GO:1900033 | regulation of trichome patterning(GO:1900032) negative regulation of trichome patterning(GO:1900033) |
| 0.0 | 0.2 | GO:0015846 | polyamine transport(GO:0015846) |
| 0.0 | 0.6 | GO:0043248 | proteasome assembly(GO:0043248) |
| 0.0 | 0.1 | GO:0080171 | lytic vacuole organization(GO:0080171) |
| 0.0 | 0.1 | GO:1902448 | regulation of shade avoidance(GO:1902446) positive regulation of shade avoidance(GO:1902448) |
| 0.0 | 0.2 | GO:0042256 | mature ribosome assembly(GO:0042256) |
| 0.0 | 0.2 | GO:1990428 | miRNA transport(GO:1990428) |
| 0.0 | 0.2 | GO:0006501 | C-terminal protein lipidation(GO:0006501) |
| 0.0 | 0.2 | GO:0015824 | proline transport(GO:0015824) |
| 0.0 | 0.1 | GO:0048445 | carpel morphogenesis(GO:0048445) |
| 0.0 | 0.2 | GO:0006272 | leading strand elongation(GO:0006272) |
| 0.0 | 0.2 | GO:0045827 | negative regulation of isoprenoid metabolic process(GO:0045827) |
| 0.0 | 0.3 | GO:0010344 | seed oilbody biogenesis(GO:0010344) |
| 0.0 | 0.2 | GO:0016098 | monoterpenoid metabolic process(GO:0016098) monoterpenoid biosynthetic process(GO:0016099) |
| 0.0 | 0.3 | GO:0007095 | mitotic G2 DNA damage checkpoint(GO:0007095) G2 DNA damage checkpoint(GO:0031572) |
| 0.0 | 0.7 | GO:0016998 | cell wall macromolecule catabolic process(GO:0016998) |
| 0.0 | 0.6 | GO:0009113 | purine nucleobase biosynthetic process(GO:0009113) |
| 0.0 | 0.2 | GO:0080170 | hydrogen peroxide transmembrane transport(GO:0080170) |
| 0.0 | 2.8 | GO:0006885 | regulation of pH(GO:0006885) |
| 0.0 | 0.1 | GO:0051973 | positive regulation of telomerase activity(GO:0051973) |
| 0.0 | 0.2 | GO:1901527 | abscisic acid-activated signaling pathway involved in stomatal movement(GO:1901527) |
| 0.0 | 0.1 | GO:0010455 | positive regulation of cell fate commitment(GO:0010455) |
| 0.0 | 0.1 | GO:0034067 | protein localization to Golgi apparatus(GO:0034067) |
| 0.0 | 0.7 | GO:0002183 | cytoplasmic translational initiation(GO:0002183) |
| 0.0 | 0.3 | GO:0009187 | cyclic nucleotide metabolic process(GO:0009187) |
| 0.0 | 1.1 | GO:0009691 | cytokinin biosynthetic process(GO:0009691) |
| 0.0 | 0.2 | GO:0044773 | intra-S DNA damage checkpoint(GO:0031573) mitotic DNA damage checkpoint(GO:0044773) |
| 0.0 | 0.2 | GO:0019408 | dolichol biosynthetic process(GO:0019408) |
| 0.0 | 0.2 | GO:0015697 | quaternary ammonium group transport(GO:0015697) |
| 0.0 | 0.8 | GO:0015706 | nitrate transport(GO:0015706) |
| 0.0 | 0.6 | GO:0010093 | specification of floral organ identity(GO:0010093) |
| 0.0 | 0.2 | GO:1904961 | quiescent center organization(GO:1904961) |
| 0.0 | 0.1 | GO:0040014 | regulation of multicellular organism growth(GO:0040014) |
| 0.0 | 1.2 | GO:0010252 | auxin homeostasis(GO:0010252) |
| 0.0 | 0.3 | GO:0019264 | L-serine catabolic process(GO:0006565) glycine biosynthetic process from serine(GO:0019264) response to tetrahydrofolate(GO:1904481) cellular response to tetrahydrofolate(GO:1904482) |
| 0.0 | 0.3 | GO:0046473 | phosphatidic acid metabolic process(GO:0046473) |
| 0.0 | 0.1 | GO:0010325 | raffinose family oligosaccharide biosynthetic process(GO:0010325) |
| 0.0 | 0.1 | GO:2000029 | regulation of proanthocyanidin biosynthetic process(GO:2000029) |
| 0.0 | 0.2 | GO:0006107 | oxaloacetate metabolic process(GO:0006107) |
| 0.0 | 0.1 | GO:0001736 | establishment of planar polarity(GO:0001736) morphogenesis of a polarized epithelium(GO:0001738) morphogenesis of an epithelium(GO:0002009) tissue morphogenesis(GO:0048729) |
| 0.0 | 0.4 | GO:0033619 | membrane protein proteolysis(GO:0033619) |
| 0.0 | 0.3 | GO:0010155 | regulation of proton transport(GO:0010155) |
| 0.0 | 0.1 | GO:0090603 | sieve element differentiation(GO:0090603) |
| 0.0 | 0.1 | GO:0051211 | anisotropic cell growth(GO:0051211) |
| 0.0 | 2.1 | GO:0009631 | cold acclimation(GO:0009631) |
| 0.0 | 0.4 | GO:0009088 | threonine biosynthetic process(GO:0009088) |
| 0.0 | 0.2 | GO:0050810 | regulation of brassinosteroid biosynthetic process(GO:0010422) regulation of steroid metabolic process(GO:0019218) regulation of steroid biosynthetic process(GO:0050810) regulation of steroid hormone biosynthetic process(GO:0090030) |
| 0.0 | 0.4 | GO:0017157 | regulation of exocytosis(GO:0017157) |
| 0.0 | 0.2 | GO:0072344 | rescue of stalled ribosome(GO:0072344) |
| 0.0 | 0.3 | GO:0010230 | alternative respiration(GO:0010230) |
| 0.0 | 0.3 | GO:0009942 | longitudinal axis specification(GO:0009942) |
| 0.0 | 0.4 | GO:0055062 | phosphate ion homeostasis(GO:0055062) trivalent inorganic anion homeostasis(GO:0072506) |
| 0.0 | 0.1 | GO:0000480 | endonucleolytic cleavage to generate mature 5'-end of SSU-rRNA from (SSU-rRNA, 5.8S rRNA, LSU-rRNA)(GO:0000472) endonucleolytic cleavage in 5'-ETS of tricistronic rRNA transcript (SSU-rRNA, 5.8S rRNA, LSU-rRNA)(GO:0000480) |
| 0.0 | 0.2 | GO:0048830 | adventitious root development(GO:0048830) |
| 0.0 | 0.1 | GO:1902457 | negative regulation of stomatal opening(GO:1902457) |
| 0.0 | 0.4 | GO:0010540 | basipetal auxin transport(GO:0010540) |
| 0.0 | 0.1 | GO:0055073 | cadmium ion homeostasis(GO:0055073) |
| 0.0 | 0.7 | GO:0010072 | primary shoot apical meristem specification(GO:0010072) |
| 0.0 | 0.1 | GO:0071421 | manganese ion transmembrane transport(GO:0071421) |
| 0.0 | 0.1 | GO:0090506 | axillary shoot meristem initiation(GO:0090506) |
| 0.0 | 0.1 | GO:0060211 | regulation of nuclear-transcribed mRNA poly(A) tail shortening(GO:0060211) regulation of nuclear-transcribed mRNA catabolic process, deadenylation-dependent decay(GO:1900151) |
| 0.0 | 0.1 | GO:0006427 | histidyl-tRNA aminoacylation(GO:0006427) |
| 0.0 | 0.1 | GO:0072505 | divalent inorganic anion homeostasis(GO:0072505) |
| 0.0 | 0.9 | GO:0010345 | suberin biosynthetic process(GO:0010345) |
| 0.0 | 0.1 | GO:0007000 | nucleolus organization(GO:0007000) |
| 0.0 | 0.3 | GO:0031204 | posttranslational protein targeting to membrane, translocation(GO:0031204) |
| 0.0 | 0.1 | GO:0060631 | regulation of meiosis I(GO:0060631) |
| 0.0 | 0.2 | GO:1901703 | protein localization involved in auxin polar transport(GO:1901703) |
| 0.0 | 0.6 | GO:0003333 | amino acid transmembrane transport(GO:0003333) |
| 0.0 | 0.2 | GO:0035627 | ceramide transport(GO:0035627) |
| 0.0 | 0.1 | GO:0015854 | adenine transport(GO:0015853) guanine transport(GO:0015854) |
| 0.0 | 0.4 | GO:0006360 | transcription from RNA polymerase I promoter(GO:0006360) |
| 0.0 | 0.5 | GO:0006833 | water transport(GO:0006833) fluid transport(GO:0042044) |
| 0.0 | 0.1 | GO:0036265 | RNA (guanine-N7)-methylation(GO:0036265) rRNA (guanine-N7)-methylation(GO:0070476) callus formation(GO:1990110) |
| 0.0 | 0.1 | GO:0046865 | isoprenoid transport(GO:0046864) terpenoid transport(GO:0046865) |
| 0.0 | 0.1 | GO:0006564 | L-serine biosynthetic process(GO:0006564) |
| 0.0 | 0.0 | GO:1901881 | positive regulation of protein depolymerization(GO:1901881) |
| 0.0 | 0.1 | GO:0006097 | glyoxylate cycle(GO:0006097) |
| 0.0 | 0.1 | GO:0010042 | response to manganese ion(GO:0010042) |
| 0.0 | 0.1 | GO:0006420 | arginyl-tRNA aminoacylation(GO:0006420) |
| 0.0 | 0.1 | GO:0033386 | geranylgeranyl diphosphate metabolic process(GO:0033385) geranylgeranyl diphosphate biosynthetic process(GO:0033386) |
| 0.0 | 0.1 | GO:0000098 | sulfur amino acid catabolic process(GO:0000098) |
| 0.0 | 0.1 | GO:1900459 | positive regulation of brassinosteroid mediated signaling pathway(GO:1900459) |
| 0.0 | 0.2 | GO:0048658 | anther wall tapetum development(GO:0048658) |
| 0.0 | 0.1 | GO:0097502 | mannosylation(GO:0097502) |
| 0.0 | 0.4 | GO:1902223 | L-phenylalanine biosynthetic process(GO:0009094) erythrose 4-phosphate/phosphoenolpyruvate family amino acid biosynthetic process(GO:1902223) |
| 0.0 | 0.2 | GO:0006195 | purine nucleotide catabolic process(GO:0006195) |
| 0.0 | 0.5 | GO:0010152 | pollen maturation(GO:0010152) |
| 0.0 | 0.1 | GO:0043157 | response to cation stress(GO:0043157) |
| 0.0 | 0.1 | GO:0034727 | lysosomal microautophagy(GO:0016237) piecemeal microautophagy of nucleus(GO:0034727) single-organism membrane invagination(GO:1902534) |
| 0.0 | 0.2 | GO:0010199 | organ boundary specification between lateral organs and the meristem(GO:0010199) |
| 0.0 | 0.1 | GO:0000187 | activation of MAPK activity(GO:0000187) positive regulation of MAP kinase activity(GO:0043406) |
| 0.0 | 0.1 | GO:0010482 | epidermal cell division(GO:0010481) regulation of epidermal cell division(GO:0010482) |
| 0.0 | 0.2 | GO:0044000 | movement in host(GO:0044000) transport of virus in multicellular host(GO:0046739) movement in other organism involved in symbiotic interaction(GO:0051814) movement in host environment(GO:0052126) movement in environment of other organism involved in symbiotic interaction(GO:0052192) |
| 0.0 | 0.4 | GO:0010052 | guard cell differentiation(GO:0010052) |
| 0.0 | 0.5 | GO:0010305 | leaf vascular tissue pattern formation(GO:0010305) |
| 0.0 | 0.1 | GO:0070150 | mitochondrial glycyl-tRNA aminoacylation(GO:0070150) |
| 0.0 | 0.1 | GO:2000580 | regulation of microtubule motor activity(GO:2000574) positive regulation of microtubule motor activity(GO:2000576) regulation of ATP-dependent microtubule motor activity, plus-end-directed(GO:2000580) positive regulation of ATP-dependent microtubule motor activity, plus-end-directed(GO:2000582) |
| 0.0 | 1.1 | GO:0042752 | regulation of circadian rhythm(GO:0042752) |
| 0.0 | 0.1 | GO:0043693 | monoterpene biosynthetic process(GO:0043693) |
| 0.0 | 0.1 | GO:0009823 | cytokinin catabolic process(GO:0009823) hormone catabolic process(GO:0042447) |
| 0.0 | 0.3 | GO:0010417 | glucuronoxylan metabolic process(GO:0010413) glucuronoxylan biosynthetic process(GO:0010417) |
| 0.0 | 0.1 | GO:0007266 | Rho protein signal transduction(GO:0007266) |
| 0.0 | 0.1 | GO:0016560 | protein import into peroxisome matrix, docking(GO:0016560) protein to membrane docking(GO:0022615) |
| 0.0 | 0.1 | GO:0010929 | positive regulation of auxin mediated signaling pathway(GO:0010929) |
| 0.0 | 0.1 | GO:0006152 | purine nucleoside catabolic process(GO:0006152) |
| 0.0 | 0.1 | GO:0044205 | 'de novo' UMP biosynthetic process(GO:0044205) |
| 0.0 | 1.2 | GO:0000381 | regulation of alternative mRNA splicing, via spliceosome(GO:0000381) |
| 0.0 | 0.0 | GO:1900378 | positive regulation of secondary metabolite biosynthetic process(GO:1900378) |
| 0.0 | 0.6 | GO:0010214 | seed coat development(GO:0010214) |
| 0.0 | 0.2 | GO:0009957 | epidermal cell fate specification(GO:0009957) |
| 0.0 | 0.4 | GO:0080154 | regulation of fertilization(GO:0080154) regulation of double fertilization forming a zygote and endosperm(GO:0080155) |
| 0.0 | 0.1 | GO:0070509 | calcium ion import(GO:0070509) |
| 0.0 | 1.0 | GO:0048825 | cotyledon development(GO:0048825) |
| 0.0 | 0.1 | GO:0045905 | positive regulation of protein complex disassembly(GO:0043243) positive regulation of translational elongation(GO:0045901) positive regulation of translational termination(GO:0045905) |
| 0.0 | 0.1 | GO:0001672 | regulation of chromatin assembly or disassembly(GO:0001672) |
| 0.0 | 0.4 | GO:0051762 | sesquiterpene biosynthetic process(GO:0051762) |
| 0.0 | 0.3 | GO:0019374 | galactolipid metabolic process(GO:0019374) |
| 0.0 | 0.0 | GO:1904062 | regulation of potassium ion transmembrane transport(GO:1901379) regulation of cation transmembrane transport(GO:1904062) |
| 0.0 | 0.2 | GO:0010100 | negative regulation of photomorphogenesis(GO:0010100) |
| 0.0 | 0.2 | GO:0006826 | iron ion transport(GO:0006826) |
| 0.0 | 0.2 | GO:0048829 | root cap development(GO:0048829) |
| 0.0 | 0.1 | GO:0042218 | 1-aminocyclopropane-1-carboxylate biosynthetic process(GO:0042218) |
| 0.0 | 0.1 | GO:0046622 | positive regulation of organ growth(GO:0046622) |
| 0.0 | 0.5 | GO:0010268 | brassinosteroid homeostasis(GO:0010268) |
| 0.0 | 0.2 | GO:0080110 | sporopollenin biosynthetic process(GO:0080110) |
| 0.0 | 0.8 | GO:1903364 | positive regulation of proteolysis involved in cellular protein catabolic process(GO:1903052) positive regulation of cellular protein catabolic process(GO:1903364) |
| 0.0 | 0.1 | GO:0000966 | RNA 5'-end processing(GO:0000966) |
| 0.0 | 0.1 | GO:0045723 | positive regulation of fatty acid biosynthetic process(GO:0045723) |
| 0.0 | 0.1 | GO:0034969 | peptidyl-arginine methylation, to asymmetrical-dimethyl arginine(GO:0019919) histone arginine methylation(GO:0034969) peptidyl-arginine N-methylation(GO:0035246) peptidyl-arginine omega-N-methylation(GO:0035247) |
| 0.0 | 0.1 | GO:0034227 | tRNA thio-modification(GO:0034227) |
| 0.0 | 0.3 | GO:0015693 | magnesium ion transport(GO:0015693) |
| 0.0 | 0.6 | GO:0032508 | DNA duplex unwinding(GO:0032508) |
| 0.0 | 0.1 | GO:0019499 | cyanide metabolic process(GO:0019499) |
| 0.0 | 0.2 | GO:0017183 | peptidyl-diphthamide metabolic process(GO:0017182) peptidyl-diphthamide biosynthetic process from peptidyl-histidine(GO:0017183) peptidyl-histidine modification(GO:0018202) |
| 0.0 | 0.1 | GO:0046621 | negative regulation of organ growth(GO:0046621) |
| 0.0 | 0.1 | GO:0042989 | sequestering of actin monomers(GO:0042989) |
| 0.0 | 0.4 | GO:0010227 | floral organ abscission(GO:0010227) |
| 0.0 | 0.1 | GO:0006971 | hypotonic response(GO:0006971) |
| 0.0 | 0.1 | GO:0000972 | transcription-dependent tethering of RNA polymerase II gene DNA at nuclear periphery(GO:0000972) |
| 0.0 | 0.1 | GO:0070125 | mitochondrial translational elongation(GO:0070125) |
| 0.0 | 0.1 | GO:0000379 | tRNA-type intron splice site recognition and cleavage(GO:0000379) |
| 0.0 | 0.1 | GO:0090059 | protoxylem development(GO:0090059) |
| 0.0 | 0.3 | GO:0006538 | glutamate catabolic process(GO:0006538) |
| 0.0 | 0.1 | GO:0033477 | S-methylmethionine metabolic process(GO:0033477) S-methylmethionine cycle(GO:0033528) |
| 0.0 | 0.1 | GO:0080112 | seed growth(GO:0080112) |
| 0.0 | 0.1 | GO:0001173 | DNA-templated transcriptional start site selection(GO:0001173) |
| 0.0 | 0.1 | GO:0007205 | protein kinase C-activating G-protein coupled receptor signaling pathway(GO:0007205) |
| 0.0 | 0.2 | GO:0006488 | dolichol-linked oligosaccharide biosynthetic process(GO:0006488) |
| 0.0 | 0.4 | GO:0006829 | zinc II ion transport(GO:0006829) |
| 0.0 | 0.5 | GO:0000462 | maturation of SSU-rRNA from tricistronic rRNA transcript (SSU-rRNA, 5.8S rRNA, LSU-rRNA)(GO:0000462) |
| 0.0 | 0.3 | GO:0033753 | ribosomal subunit export from nucleus(GO:0000054) ribosome localization(GO:0033750) establishment of ribosome localization(GO:0033753) rRNA-containing ribonucleoprotein complex export from nucleus(GO:0071428) |
| 0.0 | 0.2 | GO:0070973 | protein localization to endoplasmic reticulum exit site(GO:0070973) |
| 0.0 | 0.1 | GO:0046208 | spermine catabolic process(GO:0046208) |
| 0.0 | 0.3 | GO:0018231 | peptidyl-L-cysteine S-palmitoylation(GO:0018230) peptidyl-S-diacylglycerol-L-cysteine biosynthetic process from peptidyl-cysteine(GO:0018231) |
| 0.0 | 0.6 | GO:0009566 | fertilization(GO:0009566) double fertilization forming a zygote and endosperm(GO:0009567) |
| 0.0 | 0.1 | GO:0006346 | methylation-dependent chromatin silencing(GO:0006346) |
| 0.0 | 0.1 | GO:0071494 | cellular response to UV-C(GO:0071494) |
| 0.0 | 0.1 | GO:0000719 | photoreactive repair(GO:0000719) |
| 0.0 | 0.4 | GO:0009735 | response to cytokinin(GO:0009735) |
| 0.0 | 0.0 | GO:0010289 | homogalacturonan biosynthetic process(GO:0010289) homogalacturonan metabolic process(GO:0010394) |
| 0.0 | 0.2 | GO:0009299 | mRNA transcription(GO:0009299) |
| 0.0 | 0.4 | GO:0016106 | sesquiterpenoid biosynthetic process(GO:0016106) |
| 0.0 | 0.3 | GO:0051123 | RNA polymerase II transcriptional preinitiation complex assembly(GO:0051123) |
| 0.0 | 0.1 | GO:0007023 | post-chaperonin tubulin folding pathway(GO:0007023) |
| 0.0 | 0.3 | GO:1900865 | chloroplast RNA modification(GO:1900865) |
| 0.0 | 0.0 | GO:0042547 | cell wall modification involved in multidimensional cell growth(GO:0042547) |
| 0.0 | 0.0 | GO:0006651 | diacylglycerol biosynthetic process(GO:0006651) diacylglycerol metabolic process(GO:0046339) |
| 0.0 | 0.1 | GO:0006283 | transcription-coupled nucleotide-excision repair(GO:0006283) |
| 0.0 | 1.4 | GO:0010054 | trichoblast differentiation(GO:0010054) |
| 0.0 | 0.5 | GO:0045168 | cell-cell signaling involved in cell fate commitment(GO:0045168) |
| 0.0 | 0.1 | GO:0010273 | detoxification of copper ion(GO:0010273) stress response to copper ion(GO:1990169) |
| 0.0 | 0.1 | GO:0043484 | regulation of RNA splicing(GO:0043484) |
| 0.0 | 0.1 | GO:0048530 | fruit morphogenesis(GO:0048530) |
| 0.0 | 0.1 | GO:0006893 | Golgi to plasma membrane transport(GO:0006893) |
| 0.0 | 0.0 | GO:0000578 | embryonic axis specification(GO:0000578) |
| 0.0 | 0.1 | GO:0015689 | molybdate ion transport(GO:0015689) |
| 0.0 | 0.8 | GO:0009736 | cytokinin-activated signaling pathway(GO:0009736) |
| 0.0 | 0.1 | GO:0019745 | pentacyclic triterpenoid metabolic process(GO:0019742) pentacyclic triterpenoid biosynthetic process(GO:0019745) |
| 0.0 | 0.2 | GO:0006547 | histidine biosynthetic process(GO:0000105) histidine metabolic process(GO:0006547) imidazole-containing compound metabolic process(GO:0052803) |
| 0.0 | 0.1 | GO:0070940 | dephosphorylation of RNA polymerase II C-terminal domain(GO:0070940) |
| 0.0 | 0.5 | GO:0030244 | cellulose biosynthetic process(GO:0030244) |
| 0.0 | 0.1 | GO:0000188 | inactivation of MAPK activity(GO:0000188) |
| 0.0 | 0.4 | GO:0006506 | GPI anchor metabolic process(GO:0006505) GPI anchor biosynthetic process(GO:0006506) |
| 0.0 | 0.1 | GO:0090116 | C-5 methylation of cytosine(GO:0090116) |
| 0.0 | 0.2 | GO:0010208 | pollen wall assembly(GO:0010208) cellular component assembly involved in morphogenesis(GO:0010927) extracellular matrix assembly(GO:0085029) |
| 0.0 | 0.1 | GO:0015940 | pantothenate metabolic process(GO:0015939) pantothenate biosynthetic process(GO:0015940) |
| 0.0 | 0.1 | GO:0046168 | glycerol-3-phosphate catabolic process(GO:0046168) |
| 0.0 | 0.1 | GO:0005987 | sucrose catabolic process(GO:0005987) |
| 0.0 | 0.1 | GO:0048598 | embryonic morphogenesis(GO:0048598) |
| 0.0 | 0.1 | GO:2001289 | lipid X metabolic process(GO:2001289) |
| 0.0 | 0.2 | GO:1905177 | tracheary element differentiation(GO:1905177) |
| 0.0 | 1.1 | GO:0006869 | lipid transport(GO:0006869) |
| 0.0 | 0.1 | GO:0070072 | proton-transporting V-type ATPase complex assembly(GO:0070070) vacuolar proton-transporting V-type ATPase complex assembly(GO:0070072) |
| 0.0 | 0.0 | GO:0006661 | phosphatidylinositol biosynthetic process(GO:0006661) |
| 0.0 | 0.0 | GO:0046459 | short-chain fatty acid metabolic process(GO:0046459) |
| 0.0 | 0.1 | GO:0009786 | regulation of asymmetric cell division(GO:0009786) |
| 0.0 | 0.1 | GO:0045732 | positive regulation of protein catabolic process(GO:0045732) |
| 0.0 | 0.0 | GO:0035404 | histone-serine phosphorylation(GO:0035404) histone H3-S10 phosphorylation(GO:0043987) |
| 0.0 | 0.1 | GO:0046112 | nucleobase biosynthetic process(GO:0046112) |
| 0.0 | 0.4 | GO:0009846 | pollen germination(GO:0009846) |
| 0.0 | 0.1 | GO:0050665 | hydrogen peroxide biosynthetic process(GO:0050665) |
| 0.0 | 0.1 | GO:0043981 | histone H4-K5 acetylation(GO:0043981) |
| 0.0 | 0.0 | GO:2000014 | regulation of endosperm development(GO:2000014) |
| 0.0 | 0.1 | GO:0000710 | meiotic mismatch repair(GO:0000710) |
| 0.0 | 0.1 | GO:0010098 | suspensor development(GO:0010098) |
| 0.0 | 0.1 | GO:0031118 | rRNA pseudouridine synthesis(GO:0031118) |
| 0.0 | 0.2 | GO:0006301 | postreplication repair(GO:0006301) |
| 0.0 | 0.1 | GO:0043068 | positive regulation of programmed cell death(GO:0043068) |
| 0.0 | 0.0 | GO:1901672 | positive regulation of systemic acquired resistance(GO:1901672) |
| 0.0 | 0.1 | GO:0010047 | fruit dehiscence(GO:0010047) |
| 0.0 | 0.1 | GO:0045039 | protein import into mitochondrial inner membrane(GO:0045039) |
| 0.0 | 0.2 | GO:0010876 | lipid localization(GO:0010876) |
| 0.0 | 0.0 | GO:0001560 | regulation of cell growth by extracellular stimulus(GO:0001560) |
| 0.0 | 0.1 | GO:1900370 | positive regulation of RNA interference(GO:1900370) |
| 0.0 | 0.0 | GO:1902289 | negative regulation of defense response to oomycetes(GO:1902289) |
| 0.0 | 0.0 | GO:0043692 | monoterpene metabolic process(GO:0043692) |
| 0.0 | 0.0 | GO:0048533 | sporocyte differentiation(GO:0048533) |
| 0.0 | 1.0 | GO:0009664 | plant-type cell wall organization(GO:0009664) |
| 0.0 | 0.0 | GO:0000479 | endonucleolytic cleavage of tricistronic rRNA transcript (SSU-rRNA, 5.8S rRNA, LSU-rRNA)(GO:0000479) |
| 0.0 | 0.1 | GO:0019471 | protein hydroxylation(GO:0018126) peptidyl-proline hydroxylation to 4-hydroxy-L-proline(GO:0018401) 4-hydroxyproline metabolic process(GO:0019471) peptidyl-proline hydroxylation(GO:0019511) |
| 0.0 | 0.0 | GO:0002943 | tRNA dihydrouridine synthesis(GO:0002943) |
Gene overrepresentation in cellular component category:
| Log-likelihood per target | Total log-likelihood | Term | Description |
|---|---|---|---|
| 0.2 | 0.7 | GO:0031314 | extrinsic component of mitochondrial inner membrane(GO:0031314) |
| 0.1 | 0.5 | GO:0070505 | pollen coat(GO:0070505) |
| 0.1 | 0.3 | GO:0009925 | basal plasma membrane(GO:0009925) basolateral plasma membrane(GO:0016323) basal part of cell(GO:0045178) |
| 0.1 | 0.4 | GO:0042788 | polysomal ribosome(GO:0042788) |
| 0.1 | 0.3 | GO:0009514 | glyoxysome(GO:0009514) |
| 0.1 | 0.4 | GO:0005672 | transcription factor TFIIA complex(GO:0005672) |
| 0.1 | 1.6 | GO:0000148 | 1,3-beta-D-glucan synthase complex(GO:0000148) |
| 0.1 | 1.4 | GO:0031012 | extracellular matrix(GO:0031012) |
| 0.1 | 0.4 | GO:1990124 | messenger ribonucleoprotein complex(GO:1990124) |
| 0.1 | 0.3 | GO:0008622 | epsilon DNA polymerase complex(GO:0008622) |
| 0.1 | 0.8 | GO:0098827 | endoplasmic reticulum tubular network(GO:0071782) endoplasmic reticulum subcompartment(GO:0098827) |
| 0.1 | 0.4 | GO:0033588 | Elongator holoenzyme complex(GO:0033588) |
| 0.1 | 0.2 | GO:0034274 | Atg12-Atg5-Atg16 complex(GO:0034274) |
| 0.1 | 0.8 | GO:0005801 | cis-Golgi network(GO:0005801) |
| 0.1 | 0.4 | GO:0090395 | plant cell papilla(GO:0090395) |
| 0.1 | 0.3 | GO:0031205 | endoplasmic reticulum Sec complex(GO:0031205) |
| 0.1 | 0.2 | GO:0030870 | Mre11 complex(GO:0030870) |
| 0.1 | 0.2 | GO:0045334 | clathrin-coated endocytic vesicle(GO:0045334) |
| 0.1 | 0.2 | GO:0000835 | ER ubiquitin ligase complex(GO:0000835) Hrd1p ubiquitin ligase complex(GO:0000836) Hrd1p ubiquitin ligase ERAD-L complex(GO:0000839) |
| 0.0 | 0.1 | GO:0009501 | amyloplast(GO:0009501) |
| 0.0 | 0.1 | GO:1990429 | Pex17p-Pex14p docking complex(GO:1990415) peroxisomal importomer complex(GO:1990429) |
| 0.0 | 0.2 | GO:0005853 | eukaryotic translation elongation factor 1 complex(GO:0005853) |
| 0.0 | 0.1 | GO:0043240 | Fanconi anaemia nuclear complex(GO:0043240) |
| 0.0 | 0.1 | GO:0097196 | Shu complex(GO:0097196) |
| 0.0 | 0.3 | GO:0000813 | ESCRT I complex(GO:0000813) |
| 0.0 | 0.6 | GO:0030687 | preribosome, large subunit precursor(GO:0030687) |
| 0.0 | 0.1 | GO:0010330 | cellulose synthase complex(GO:0010330) |
| 0.0 | 0.2 | GO:0034388 | Pwp2p-containing subcomplex of 90S preribosome(GO:0034388) |
| 0.0 | 0.1 | GO:0042709 | succinate-CoA ligase complex(GO:0042709) |
| 0.0 | 0.3 | GO:0071458 | integral component of cytoplasmic side of endoplasmic reticulum membrane(GO:0071458) cytoplasmic side of endoplasmic reticulum membrane(GO:0098554) |
| 0.0 | 0.3 | GO:0017119 | Golgi transport complex(GO:0017119) |
| 0.0 | 0.2 | GO:0034098 | VCP-NPL4-UFD1 AAA ATPase complex(GO:0034098) |
| 0.0 | 0.2 | GO:0005776 | autophagosome(GO:0005776) |
| 0.0 | 0.2 | GO:0071541 | eukaryotic translation initiation factor 3 complex, eIF3m(GO:0071541) |
| 0.0 | 0.2 | GO:0035619 | root hair tip(GO:0035619) |
| 0.0 | 0.2 | GO:0005697 | telomerase holoenzyme complex(GO:0005697) |
| 0.0 | 0.8 | GO:0010494 | cytoplasmic stress granule(GO:0010494) |
| 0.0 | 0.2 | GO:0046695 | SLIK (SAGA-like) complex(GO:0046695) |
| 0.0 | 0.3 | GO:0005832 | chaperonin-containing T-complex(GO:0005832) |
| 0.0 | 0.1 | GO:0034703 | ion channel complex(GO:0034702) cation channel complex(GO:0034703) |
| 0.0 | 0.2 | GO:0031464 | Cul4A-RING E3 ubiquitin ligase complex(GO:0031464) |
| 0.0 | 0.1 | GO:0097344 | Rix1 complex(GO:0097344) |
| 0.0 | 0.4 | GO:0008541 | proteasome regulatory particle, lid subcomplex(GO:0008541) |
| 0.0 | 0.3 | GO:0031428 | box C/D snoRNP complex(GO:0031428) |
| 0.0 | 0.2 | GO:0030915 | Smc5-Smc6 complex(GO:0030915) |
| 0.0 | 0.1 | GO:0030286 | dynein complex(GO:0030286) |
| 0.0 | 0.2 | GO:0030139 | endocytic vesicle(GO:0030139) |
| 0.0 | 0.1 | GO:0031352 | intrinsic component of plastid inner membrane(GO:0031352) integral component of plastid inner membrane(GO:0031353) intrinsic component of chloroplast inner membrane(GO:0031356) integral component of chloroplast inner membrane(GO:0031357) |
| 0.0 | 0.1 | GO:0070993 | translation preinitiation complex(GO:0070993) |
| 0.0 | 0.2 | GO:0000275 | mitochondrial proton-transporting ATP synthase complex, catalytic core F(1)(GO:0000275) |
| 0.0 | 3.7 | GO:0046658 | anchored component of plasma membrane(GO:0046658) |
| 0.0 | 0.1 | GO:0055038 | recycling endosome membrane(GO:0055038) |
| 0.0 | 0.3 | GO:0005769 | early endosome(GO:0005769) |
| 0.0 | 0.5 | GO:0016324 | apical plasma membrane(GO:0016324) |
| 0.0 | 0.1 | GO:0098852 | lysosomal membrane(GO:0005765) lytic vacuole membrane(GO:0098852) |
| 0.0 | 0.1 | GO:0000220 | vacuolar proton-transporting V-type ATPase, V0 domain(GO:0000220) |
| 0.0 | 0.1 | GO:0000214 | tRNA-intron endonuclease complex(GO:0000214) |
| 0.0 | 0.6 | GO:0031228 | integral component of Golgi membrane(GO:0030173) intrinsic component of Golgi membrane(GO:0031228) |
| 0.0 | 0.1 | GO:0048476 | Holliday junction resolvase complex(GO:0048476) |
| 0.0 | 0.0 | GO:0005846 | nuclear cap binding complex(GO:0005846) |
| 0.0 | 0.1 | GO:0009346 | citrate lyase complex(GO:0009346) |
| 0.0 | 0.1 | GO:0034657 | GID complex(GO:0034657) |
| 0.0 | 2.1 | GO:0031225 | anchored component of membrane(GO:0031225) |
| 0.0 | 0.2 | GO:0019774 | proteasome core complex, beta-subunit complex(GO:0019774) |
| 0.0 | 1.3 | GO:0019005 | SCF ubiquitin ligase complex(GO:0019005) |
| 0.0 | 0.0 | GO:1990112 | RQC complex(GO:1990112) |
| 0.0 | 0.1 | GO:0030906 | retromer, cargo-selective complex(GO:0030906) |
| 0.0 | 0.1 | GO:0044613 | nuclear pore central transport channel(GO:0044613) |
| 0.0 | 0.8 | GO:0005811 | lipid particle(GO:0005811) |
| 0.0 | 0.3 | GO:0031350 | intrinsic component of plastid membrane(GO:0031350) integral component of plastid membrane(GO:0031351) |
| 0.0 | 0.1 | GO:0043078 | megasporocyte nucleus(GO:0043076) polar nucleus(GO:0043078) |
| 0.0 | 0.1 | GO:0070461 | SAGA-type complex(GO:0070461) |
| 0.0 | 0.1 | GO:0005673 | transcription factor TFIIE complex(GO:0005673) |
| 0.0 | 0.0 | GO:0005658 | alpha DNA polymerase:primase complex(GO:0005658) |
| 0.0 | 0.1 | GO:0010445 | nuclear dicing body(GO:0010445) |
| 0.0 | 0.2 | GO:0005885 | Arp2/3 protein complex(GO:0005885) |
| 0.0 | 0.1 | GO:0000445 | transcription export complex(GO:0000346) THO complex part of transcription export complex(GO:0000445) |
| 0.0 | 0.1 | GO:0070971 | endoplasmic reticulum exit site(GO:0070971) |
| 0.0 | 0.1 | GO:0000808 | origin recognition complex(GO:0000808) nuclear origin of replication recognition complex(GO:0005664) |
| 0.0 | 0.1 | GO:0009331 | glycerol-3-phosphate dehydrogenase complex(GO:0009331) |
| 0.0 | 0.1 | GO:0031083 | BLOC complex(GO:0031082) BLOC-1 complex(GO:0031083) |
| 0.0 | 1.0 | GO:0005615 | extracellular space(GO:0005615) |
Gene overrepresentation in molecular function category:
| Log-likelihood per target | Total log-likelihood | Term | Description |
|---|---|---|---|
| 0.2 | 2.2 | GO:0047216 | inositol 3-alpha-galactosyltransferase activity(GO:0047216) |
| 0.2 | 1.0 | GO:0008964 | phosphoenolpyruvate carboxylase activity(GO:0008964) |
| 0.2 | 0.6 | GO:0004034 | aldose 1-epimerase activity(GO:0004034) |
| 0.2 | 0.5 | GO:0016802 | adenosylhomocysteinase activity(GO:0004013) trialkylsulfonium hydrolase activity(GO:0016802) |
| 0.2 | 1.3 | GO:0090447 | glycerol-3-phosphate 2-O-acyltransferase activity(GO:0090447) |
| 0.2 | 0.6 | GO:0016707 | gibberellin 3-beta-dioxygenase activity(GO:0016707) |
| 0.2 | 0.5 | GO:0005046 | KDEL sequence binding(GO:0005046) |
| 0.2 | 0.8 | GO:0003680 | AT DNA binding(GO:0003680) |
| 0.1 | 1.0 | GO:0018685 | alkane 1-monooxygenase activity(GO:0018685) |
| 0.1 | 1.0 | GO:0047274 | galactinol-sucrose galactosyltransferase activity(GO:0047274) |
| 0.1 | 0.6 | GO:0050162 | oxalate oxidase activity(GO:0050162) |
| 0.1 | 0.4 | GO:0015173 | aromatic amino acid transmembrane transporter activity(GO:0015173) |
| 0.1 | 0.4 | GO:0008798 | beta-aspartyl-peptidase activity(GO:0008798) |
| 0.1 | 0.5 | GO:0030410 | nicotianamine synthase activity(GO:0030410) |
| 0.1 | 0.4 | GO:0052629 | phosphatidylinositol-3-phosphatase activity(GO:0004438) phosphatidylinositol-3,5-bisphosphate 3-phosphatase activity(GO:0052629) |
| 0.1 | 2.0 | GO:0016157 | sucrose synthase activity(GO:0016157) |
| 0.1 | 0.5 | GO:0015089 | high-affinity copper ion transmembrane transporter activity(GO:0015089) |
| 0.1 | 0.4 | GO:0004512 | inositol-3-phosphate synthase activity(GO:0004512) |
| 0.1 | 0.4 | GO:0015136 | sialic acid transmembrane transporter activity(GO:0015136) |
| 0.1 | 0.4 | GO:0052924 | trans-octaprenyltranstransferase activity(GO:0050347) all-trans-nonaprenyl-diphosphate synthase (geranylgeranyl-diphosphate specific) activity(GO:0052924) |
| 0.1 | 0.3 | GO:0016767 | geranylgeranyl-diphosphate geranylgeranyltransferase activity(GO:0016767) |
| 0.1 | 0.4 | GO:0004556 | alpha-amylase activity(GO:0004556) |
| 0.1 | 0.3 | GO:0097363 | protein O-GlcNAc transferase activity(GO:0097363) |
| 0.1 | 1.6 | GO:0003843 | 1,3-beta-D-glucan synthase activity(GO:0003843) |
| 0.1 | 0.3 | GO:0004352 | glutamate dehydrogenase (NAD+) activity(GO:0004352) |
| 0.1 | 0.2 | GO:0004044 | amidophosphoribosyltransferase activity(GO:0004044) |
| 0.1 | 0.7 | GO:0004869 | cysteine-type endopeptidase inhibitor activity(GO:0004869) |
| 0.1 | 0.3 | GO:0005460 | UDP-glucose transmembrane transporter activity(GO:0005460) |
| 0.1 | 0.3 | GO:0004113 | cyclic-nucleotide phosphodiesterase activity(GO:0004112) 2',3'-cyclic-nucleotide 3'-phosphodiesterase activity(GO:0004113) |
| 0.1 | 1.6 | GO:0005199 | structural constituent of cell wall(GO:0005199) |
| 0.1 | 0.4 | GO:0015186 | L-glutamine transmembrane transporter activity(GO:0015186) |
| 0.1 | 0.6 | GO:0004715 | non-membrane spanning protein tyrosine kinase activity(GO:0004715) |
| 0.1 | 0.2 | GO:0008517 | folic acid transporter activity(GO:0008517) |
| 0.1 | 0.2 | GO:0052640 | salicylic acid glucosyltransferase (glucoside-forming) activity(GO:0052640) |
| 0.1 | 0.2 | GO:0015165 | pyrimidine nucleotide-sugar transmembrane transporter activity(GO:0015165) |
| 0.1 | 0.3 | GO:0009784 | transmembrane receptor histidine kinase activity(GO:0009784) transmembrane histidine kinase cytokinin receptor activity(GO:0009885) |
| 0.1 | 0.1 | GO:0046409 | p-coumarate 3-hydroxylase activity(GO:0046409) |
| 0.1 | 0.2 | GO:0008519 | ammonium transmembrane transporter activity(GO:0008519) |
| 0.1 | 0.3 | GO:0008395 | steroid hydroxylase activity(GO:0008395) |
| 0.1 | 0.2 | GO:0031071 | cysteine desulfurase activity(GO:0031071) |
| 0.1 | 0.4 | GO:0045118 | azole transporter activity(GO:0045118) |
| 0.1 | 0.4 | GO:0003913 | DNA photolyase activity(GO:0003913) |
| 0.1 | 1.5 | GO:0052716 | hydroquinone:oxygen oxidoreductase activity(GO:0052716) |
| 0.1 | 0.3 | GO:0005354 | galactose transmembrane transporter activity(GO:0005354) |
| 0.1 | 0.5 | GO:0050105 | L-gulonolactone oxidase activity(GO:0050105) |
| 0.1 | 0.2 | GO:0000009 | alpha-1,6-mannosyltransferase activity(GO:0000009) |
| 0.1 | 0.3 | GO:0033836 | flavonol 7-O-beta-glucosyltransferase activity(GO:0033836) |
| 0.1 | 0.2 | GO:0001216 | bacterial-type RNA polymerase transcription factor activity, sequence-specific DNA binding(GO:0001130) bacterial-type RNA polymerase transcriptional activator activity, sequence-specific DNA binding(GO:0001216) |
| 0.1 | 0.7 | GO:0000293 | ferric-chelate reductase activity(GO:0000293) oxidoreductase activity, oxidizing metal ions, NAD or NADP as acceptor(GO:0016723) |
| 0.1 | 0.2 | GO:0035615 | clathrin adaptor activity(GO:0035615) endocytic adaptor activity(GO:0098748) |
| 0.1 | 0.2 | GO:0050284 | sinapate 1-glucosyltransferase activity(GO:0050284) |
| 0.1 | 0.2 | GO:0003861 | 3-isopropylmalate dehydratase activity(GO:0003861) |
| 0.1 | 1.1 | GO:0010329 | auxin efflux transmembrane transporter activity(GO:0010329) |
| 0.1 | 0.4 | GO:0004449 | isocitrate dehydrogenase (NAD+) activity(GO:0004449) |
| 0.1 | 0.3 | GO:0035197 | siRNA binding(GO:0035197) |
| 0.1 | 0.5 | GO:0010011 | auxin binding(GO:0010011) |
| 0.1 | 0.3 | GO:0009678 | hydrogen-translocating pyrophosphatase activity(GO:0009678) |
| 0.1 | 0.3 | GO:0015369 | calcium:proton antiporter activity(GO:0015369) |
| 0.1 | 1.7 | GO:0048029 | monosaccharide binding(GO:0048029) |
| 0.1 | 0.2 | GO:0035591 | MAP-kinase scaffold activity(GO:0005078) protein kinase C binding(GO:0005080) protein complex scaffold(GO:0032947) signaling adaptor activity(GO:0035591) |
| 0.1 | 0.2 | GO:0000403 | Y-form DNA binding(GO:0000403) flap-structured DNA binding(GO:0070336) |
| 0.1 | 0.2 | GO:0019172 | glyoxalase III activity(GO:0019172) |
| 0.1 | 0.3 | GO:0003979 | UDP-glucose 6-dehydrogenase activity(GO:0003979) |
| 0.1 | 1.0 | GO:0005381 | iron ion transmembrane transporter activity(GO:0005381) |
| 0.1 | 0.6 | GO:0103075 | indole-3-pyruvate monooxygenase activity(GO:0103075) |
| 0.1 | 0.2 | GO:1990381 | ubiquitin-specific protease binding(GO:1990381) |
| 0.1 | 0.6 | GO:0015112 | nitrate transmembrane transporter activity(GO:0015112) |
| 0.1 | 0.3 | GO:0045544 | gibberellin 20-oxidase activity(GO:0045544) |
| 0.0 | 0.6 | GO:0022821 | potassium ion antiporter activity(GO:0022821) |
| 0.0 | 0.1 | GO:0010331 | gibberellin binding(GO:0010331) |
| 0.0 | 0.7 | GO:0004144 | diacylglycerol O-acyltransferase activity(GO:0004144) |
| 0.0 | 0.7 | GO:0015562 | efflux transmembrane transporter activity(GO:0015562) |
| 0.0 | 0.2 | GO:0052739 | phosphatidylserine 1-acylhydrolase activity(GO:0052739) 1-acyl-2-lysophosphatidylserine acylhydrolase activity(GO:0052740) |
| 0.0 | 0.1 | GO:0030975 | thiamine diphosphokinase activity(GO:0004788) thiamine binding(GO:0030975) |
| 0.0 | 0.1 | GO:0052901 | spermine:oxygen oxidoreductase (spermidine-forming) activity(GO:0052901) |
| 0.0 | 0.3 | GO:0045549 | 9-cis-epoxycarotenoid dioxygenase activity(GO:0045549) |
| 0.0 | 0.3 | GO:0010279 | indole-3-acetic acid amido synthetase activity(GO:0010279) |
| 0.0 | 0.3 | GO:0050551 | myrcene synthase activity(GO:0050551) |
| 0.0 | 0.2 | GO:0033897 | ribonuclease T2 activity(GO:0033897) |
| 0.0 | 0.2 | GO:0015203 | polyamine transmembrane transporter activity(GO:0015203) |
| 0.0 | 0.2 | GO:0019784 | NEDD8-specific protease activity(GO:0019784) |
| 0.0 | 0.1 | GO:0019779 | Atg8 activating enzyme activity(GO:0019779) |
| 0.0 | 0.9 | GO:0005227 | calcium activated cation channel activity(GO:0005227) ion gated channel activity(GO:0022839) |
| 0.0 | 0.1 | GO:0003864 | 3-methyl-2-oxobutanoate hydroxymethyltransferase activity(GO:0003864) |
| 0.0 | 0.8 | GO:0015250 | water transmembrane transporter activity(GO:0005372) water channel activity(GO:0015250) |
| 0.0 | 0.2 | GO:0005451 | monovalent cation:proton antiporter activity(GO:0005451) |
| 0.0 | 0.4 | GO:0009922 | fatty acid elongase activity(GO:0009922) |
| 0.0 | 0.2 | GO:0015193 | L-proline transmembrane transporter activity(GO:0015193) |
| 0.0 | 0.2 | GO:0010296 | prenylcysteine methylesterase activity(GO:0010296) |
| 0.0 | 0.8 | GO:0016251 | obsolete general RNA polymerase II transcription factor activity(GO:0016251) |
| 0.0 | 0.2 | GO:0017057 | 6-phosphogluconolactonase activity(GO:0017057) |
| 0.0 | 0.2 | GO:0022840 | leak channel activity(GO:0022840) potassium ion leak channel activity(GO:0022841) narrow pore channel activity(GO:0022842) |
| 0.0 | 0.3 | GO:0001872 | (1->3)-beta-D-glucan binding(GO:0001872) |
| 0.0 | 0.1 | GO:0003986 | acetyl-CoA hydrolase activity(GO:0003986) |
| 0.0 | 0.3 | GO:0008381 | mechanically-gated ion channel activity(GO:0008381) mechanically gated channel activity(GO:0022833) |
| 0.0 | 0.1 | GO:0008490 | arsenite secondary active transmembrane transporter activity(GO:0008490) arsenite transmembrane transporter activity(GO:0015105) arsenite-transmembrane transporting ATPase activity(GO:0015446) anion transmembrane-transporting ATPase activity(GO:0043225) |
| 0.0 | 1.6 | GO:0015385 | sodium:proton antiporter activity(GO:0015385) |
| 0.0 | 0.2 | GO:0008905 | mannose-phosphate guanylyltransferase activity(GO:0008905) |
| 0.0 | 0.1 | GO:0016906 | sterol 3-beta-glucosyltransferase activity(GO:0016906) |
| 0.0 | 0.2 | GO:0016985 | mannan endo-1,4-beta-mannosidase activity(GO:0016985) |
| 0.0 | 0.1 | GO:0008265 | Mo-molybdopterin cofactor sulfurase activity(GO:0008265) |
| 0.0 | 0.2 | GO:0016768 | spermine synthase activity(GO:0016768) |
| 0.0 | 0.3 | GO:0009916 | alternative oxidase activity(GO:0009916) |
| 0.0 | 0.2 | GO:0045547 | dehydrodolichyl diphosphate synthase activity(GO:0045547) |
| 0.0 | 0.3 | GO:0035198 | miRNA binding(GO:0035198) |
| 0.0 | 0.2 | GO:0050734 | hydroxycinnamoyltransferase activity(GO:0050734) |
| 0.0 | 0.3 | GO:0004372 | glycine hydroxymethyltransferase activity(GO:0004372) serine binding(GO:0070905) |
| 0.0 | 0.1 | GO:0034513 | box H/ACA snoRNA binding(GO:0034513) |
| 0.0 | 0.1 | GO:0004617 | phosphoglycerate dehydrogenase activity(GO:0004617) |
| 0.0 | 0.3 | GO:0005384 | manganese ion transmembrane transporter activity(GO:0005384) |
| 0.0 | 0.1 | GO:0008963 | phospho-N-acetylmuramoyl-pentapeptide-transferase activity(GO:0008963) |
| 0.0 | 0.1 | GO:0045548 | phenylalanine ammonia-lyase activity(GO:0045548) |
| 0.0 | 0.1 | GO:0004774 | succinate-CoA ligase activity(GO:0004774) succinate-CoA ligase (ADP-forming) activity(GO:0004775) succinate-CoA ligase (GDP-forming) activity(GO:0004776) |
| 0.0 | 0.3 | GO:0042500 | aspartic endopeptidase activity, intramembrane cleaving(GO:0042500) |
| 0.0 | 0.4 | GO:0016160 | amylase activity(GO:0016160) |
| 0.0 | 1.3 | GO:0008553 | hydrogen-exporting ATPase activity, phosphorylative mechanism(GO:0008553) |
| 0.0 | 0.3 | GO:0008506 | sucrose:proton symporter activity(GO:0008506) |
| 0.0 | 0.5 | GO:0030955 | pyruvate kinase activity(GO:0004743) potassium ion binding(GO:0030955) alkali metal ion binding(GO:0031420) |
| 0.0 | 0.2 | GO:0017176 | phosphatidylinositol N-acetylglucosaminyltransferase activity(GO:0017176) |
| 0.0 | 0.1 | GO:0043812 | phosphatidylinositol phosphate 4-phosphatase activity(GO:0034596) phosphatidylinositol-4-phosphate phosphatase activity(GO:0043812) |
| 0.0 | 0.2 | GO:0003830 | beta-1,4-mannosylglycoprotein 4-beta-N-acetylglucosaminyltransferase activity(GO:0003830) |
| 0.0 | 0.1 | GO:0070034 | telomerase RNA binding(GO:0070034) |
| 0.0 | 0.2 | GO:0004028 | 3-chloroallyl aldehyde dehydrogenase activity(GO:0004028) |
| 0.0 | 0.1 | GO:0004821 | histidine-tRNA ligase activity(GO:0004821) |
| 0.0 | 0.1 | GO:0046537 | 2,3-bisphosphoglycerate-independent phosphoglycerate mutase activity(GO:0046537) |
| 0.0 | 0.1 | GO:0008661 | 1-deoxy-D-xylulose-5-phosphate synthase activity(GO:0008661) |
| 0.0 | 0.4 | GO:0004430 | 1-phosphatidylinositol 4-kinase activity(GO:0004430) |
| 0.0 | 0.2 | GO:0004605 | phosphatidate cytidylyltransferase activity(GO:0004605) |
| 0.0 | 0.1 | GO:0016882 | cyclo-ligase activity(GO:0016882) |
| 0.0 | 1.3 | GO:0000156 | phosphorelay response regulator activity(GO:0000156) |
| 0.0 | 0.1 | GO:0015292 | uniporter activity(GO:0015292) |
| 0.0 | 0.2 | GO:0052691 | UDP-arabinopyranose mutase activity(GO:0052691) |
| 0.0 | 0.2 | GO:1902388 | ceramide transporter activity(GO:0035620) sphingolipid transporter activity(GO:0046624) ceramide 1-phosphate binding(GO:1902387) ceramide 1-phosphate transporter activity(GO:1902388) |
| 0.0 | 0.1 | GO:0047724 | inosine nucleosidase activity(GO:0047724) |
| 0.0 | 0.3 | GO:0051184 | cofactor transporter activity(GO:0051184) |
| 0.0 | 0.1 | GO:0016435 | rRNA (guanine) methyltransferase activity(GO:0016435) |
| 0.0 | 0.5 | GO:0070290 | phospholipase D activity(GO:0004630) N-acylphosphatidylethanolamine-specific phospholipase D activity(GO:0070290) |
| 0.0 | 0.1 | GO:0010354 | homogentisate prenyltransferase activity(GO:0010354) |
| 0.0 | 0.1 | GO:0034511 | U3 snoRNA binding(GO:0034511) |
| 0.0 | 0.1 | GO:0008297 | single-stranded DNA exodeoxyribonuclease activity(GO:0008297) |
| 0.0 | 0.1 | GO:0004814 | arginine-tRNA ligase activity(GO:0004814) |
| 0.0 | 0.1 | GO:1990841 | promoter-specific chromatin binding(GO:1990841) |
| 0.0 | 0.2 | GO:0016621 | cinnamoyl-CoA reductase activity(GO:0016621) |
| 0.0 | 0.2 | GO:0004365 | glyceraldehyde-3-phosphate dehydrogenase (NAD+) (phosphorylating) activity(GO:0004365) glyceraldehyde-3-phosphate dehydrogenase (NAD(P)+) (phosphorylating) activity(GO:0043891) |
| 0.0 | 0.1 | GO:0004385 | guanylate kinase activity(GO:0004385) |
| 0.0 | 0.3 | GO:0000014 | single-stranded DNA endodeoxyribonuclease activity(GO:0000014) |
| 0.0 | 0.2 | GO:0003999 | adenine phosphoribosyltransferase activity(GO:0003999) |
| 0.0 | 0.7 | GO:0004568 | chitinase activity(GO:0004568) |
| 0.0 | 0.5 | GO:0004525 | ribonuclease III activity(GO:0004525) double-stranded RNA-specific ribonuclease activity(GO:0032296) |
| 0.0 | 0.7 | GO:0016838 | carbon-oxygen lyase activity, acting on phosphates(GO:0016838) |
| 0.0 | 0.1 | GO:0045502 | dynein binding(GO:0045502) dynein intermediate chain binding(GO:0045505) dynein light intermediate chain binding(GO:0051959) |
| 0.0 | 0.3 | GO:0016273 | arginine N-methyltransferase activity(GO:0016273) protein-arginine N-methyltransferase activity(GO:0016274) |
| 0.0 | 0.2 | GO:0017110 | nucleoside-diphosphatase activity(GO:0017110) |
| 0.0 | 0.2 | GO:0005086 | ARF guanyl-nucleotide exchange factor activity(GO:0005086) |
| 0.0 | 0.6 | GO:0008143 | poly(A) binding(GO:0008143) |
| 0.0 | 0.2 | GO:0008970 | phosphatidylcholine 1-acylhydrolase activity(GO:0008970) |
| 0.0 | 1.5 | GO:0001228 | transcriptional activator activity, RNA polymerase II transcription regulatory region sequence-specific binding(GO:0001228) |
| 0.0 | 0.1 | GO:0000179 | rRNA (adenine-N6,N6-)-dimethyltransferase activity(GO:0000179) |
| 0.0 | 0.2 | GO:0047196 | long-chain-alcohol O-fatty-acyltransferase activity(GO:0047196) |
| 0.0 | 0.3 | GO:0015145 | monosaccharide transmembrane transporter activity(GO:0015145) |
| 0.0 | 0.2 | GO:0048256 | flap endonuclease activity(GO:0048256) |
| 0.0 | 0.1 | GO:0051010 | microtubule plus-end binding(GO:0051010) |
| 0.0 | 0.2 | GO:0009011 | starch synthase activity(GO:0009011) alpha-1,4-glucan synthase activity(GO:0033201) |
| 0.0 | 0.1 | GO:0042085 | 5-methyltetrahydropteroyltriglutamate-homocysteine S-methyltransferase activity(GO:0003871) methionine synthase activity(GO:0008705) 5-methyltetrahydrofolate-dependent methyltransferase activity(GO:0042084) 5-methyltetrahydropteroyltri-L-glutamate-dependent methyltransferase activity(GO:0042085) |
| 0.0 | 0.1 | GO:0004106 | chorismate mutase activity(GO:0004106) |
| 0.0 | 0.1 | GO:0046923 | ER retention sequence binding(GO:0046923) |
| 0.0 | 0.2 | GO:0001046 | core promoter sequence-specific DNA binding(GO:0001046) core promoter binding(GO:0001047) |
| 0.0 | 0.2 | GO:0070035 | ATP-dependent DNA helicase activity(GO:0004003) ATP-dependent helicase activity(GO:0008026) single-stranded DNA-dependent ATP-dependent DNA helicase activity(GO:0017116) single-stranded DNA-dependent ATPase activity(GO:0043142) purine NTP-dependent helicase activity(GO:0070035) |
| 0.0 | 0.3 | GO:0004714 | transmembrane receptor protein tyrosine kinase activity(GO:0004714) |
| 0.0 | 0.3 | GO:0047259 | glucomannan 4-beta-mannosyltransferase activity(GO:0047259) |
| 0.0 | 0.2 | GO:0017025 | TBP-class protein binding(GO:0017025) |
| 0.0 | 0.6 | GO:0015293 | symporter activity(GO:0015293) |
| 0.0 | 0.0 | GO:0080161 | auxin transmembrane transporter activity(GO:0080161) |
| 0.0 | 0.1 | GO:0004416 | hydroxyacylglutathione hydrolase activity(GO:0004416) |
| 0.0 | 0.1 | GO:0050378 | UDP-glucuronate 4-epimerase activity(GO:0050378) |
| 0.0 | 0.1 | GO:0019139 | cytokinin dehydrogenase activity(GO:0019139) |
| 0.0 | 0.2 | GO:1990137 | plant seed peroxidase activity(GO:1990137) |
| 0.0 | 0.3 | GO:0015095 | magnesium ion transmembrane transporter activity(GO:0015095) |
| 0.0 | 0.0 | GO:0080146 | L-cysteine desulfhydrase activity(GO:0080146) |
| 0.0 | 0.1 | GO:0004839 | ubiquitin activating enzyme activity(GO:0004839) |
| 0.0 | 0.1 | GO:0004424 | imidazoleglycerol-phosphate dehydratase activity(GO:0004424) |
| 0.0 | 0.3 | GO:0009044 | xylan 1,4-beta-xylosidase activity(GO:0009044) alpha-L-arabinofuranosidase activity(GO:0046556) |
| 0.0 | 0.1 | GO:0035516 | oxidative DNA demethylase activity(GO:0035516) |
| 0.0 | 0.2 | GO:0032041 | NAD-dependent histone deacetylase activity(GO:0017136) histone deacetylase activity (H3-K14 specific)(GO:0031078) NAD-dependent histone deacetylase activity (H3-K14 specific)(GO:0032041) NAD-dependent protein deacetylase activity(GO:0034979) |
| 0.0 | 0.7 | GO:0046915 | transition metal ion transmembrane transporter activity(GO:0046915) |
| 0.0 | 1.3 | GO:0004650 | polygalacturonase activity(GO:0004650) |
| 0.0 | 0.1 | GO:0008330 | protein tyrosine/threonine phosphatase activity(GO:0008330) |
| 0.0 | 0.1 | GO:0004820 | glycine-tRNA ligase activity(GO:0004820) |
| 0.0 | 0.2 | GO:0030515 | snoRNA binding(GO:0030515) |
| 0.0 | 0.4 | GO:0004564 | beta-fructofuranosidase activity(GO:0004564) |
| 0.0 | 0.1 | GO:0004337 | geranyltranstransferase activity(GO:0004337) |
| 0.0 | 0.1 | GO:0016653 | oxidoreductase activity, acting on NAD(P)H, heme protein as acceptor(GO:0016653) |
| 0.0 | 0.6 | GO:0031624 | ubiquitin conjugating enzyme binding(GO:0031624) |
| 0.0 | 0.1 | GO:0051980 | iron chelate transmembrane transporter activity(GO:0015603) iron-nicotianamine transmembrane transporter activity(GO:0051980) |
| 0.0 | 0.2 | GO:0070181 | small ribosomal subunit rRNA binding(GO:0070181) |
| 0.0 | 0.1 | GO:0042299 | lupeol synthase activity(GO:0042299) |
| 0.0 | 1.0 | GO:0005319 | lipid transporter activity(GO:0005319) |
| 0.0 | 0.1 | GO:0003878 | ATP citrate synthase activity(GO:0003878) |
| 0.0 | 0.1 | GO:0005094 | Rho GDP-dissociation inhibitor activity(GO:0005094) |
| 0.0 | 0.1 | GO:0047150 | S-adenosylmethionine-homocysteine S-methyltransferase activity(GO:0008898) betaine-homocysteine S-methyltransferase activity(GO:0047150) |
| 0.0 | 0.2 | GO:0004806 | triglyceride lipase activity(GO:0004806) |
| 0.0 | 0.1 | GO:0047769 | prephenate dehydratase activity(GO:0004664) arogenate dehydratase activity(GO:0047769) |
| 0.0 | 1.9 | GO:0016684 | peroxidase activity(GO:0004601) oxidoreductase activity, acting on peroxide as acceptor(GO:0016684) |
| 0.0 | 0.1 | GO:0005452 | inorganic anion exchanger activity(GO:0005452) |
| 0.0 | 0.8 | GO:0004190 | aspartic-type endopeptidase activity(GO:0004190) |
| 0.0 | 0.1 | GO:0042392 | sphingosine-1-phosphate phosphatase activity(GO:0042392) lipid phosphatase activity(GO:0042577) |
| 0.0 | 0.1 | GO:0046027 | phospholipid:diacylglycerol acyltransferase activity(GO:0046027) |
| 0.0 | 0.1 | GO:0004143 | diacylglycerol kinase activity(GO:0004143) |
| 0.0 | 0.2 | GO:0052736 | beta-glucanase activity(GO:0052736) |
| 0.0 | 0.3 | GO:0001085 | RNA polymerase II transcription factor binding(GO:0001085) |
| 0.0 | 0.2 | GO:0045551 | cinnamyl-alcohol dehydrogenase activity(GO:0045551) |
| 0.0 | 0.0 | GO:0016713 | oxidoreductase activity, acting on paired donors, with incorporation or reduction of molecular oxygen, reduced iron-sulfur protein as one donor, and incorporation of one atom of oxygen(GO:0016713) |
| 0.0 | 0.1 | GO:0052852 | very-long-chain-(S)-2-hydroxy-acid oxidase activity(GO:0052852) long-chain-(S)-2-hydroxy-long-chain-acid oxidase activity(GO:0052853) medium-chain-(S)-2-hydroxy-acid oxidase activity(GO:0052854) |
| 0.0 | 0.1 | GO:0004142 | diacylglycerol cholinephosphotransferase activity(GO:0004142) |
| 0.0 | 0.1 | GO:0070259 | tyrosyl-DNA phosphodiesterase activity(GO:0070259) |
| 0.0 | 0.1 | GO:0046509 | 1,2-diacylglycerol 3-beta-galactosyltransferase activity(GO:0046509) |
| 0.0 | 0.1 | GO:0018708 | thiol S-methyltransferase activity(GO:0018708) |
| 0.0 | 0.0 | GO:0070003 | threonine-type endopeptidase activity(GO:0004298) threonine-type peptidase activity(GO:0070003) |
| 0.0 | 1.1 | GO:0016298 | lipase activity(GO:0016298) |
| 0.0 | 0.2 | GO:0047429 | nucleoside-triphosphate diphosphatase activity(GO:0047429) |
| 0.0 | 1.0 | GO:0015171 | amino acid transmembrane transporter activity(GO:0015171) |
| 0.0 | 0.1 | GO:0080097 | L-tryptophan:pyruvate aminotransferase activity(GO:0080097) |
| 0.0 | 0.3 | GO:0019707 | protein-cysteine S-palmitoyltransferase activity(GO:0019706) protein-cysteine S-acyltransferase activity(GO:0019707) |
| 0.0 | 0.2 | GO:0009378 | four-way junction helicase activity(GO:0009378) |
| 0.0 | 0.3 | GO:0003746 | translation elongation factor activity(GO:0003746) |
| 0.0 | 0.0 | GO:0047874 | dolichyldiphosphatase activity(GO:0047874) |
| 0.0 | 0.1 | GO:0080116 | glucuronoxylan glucuronosyltransferase activity(GO:0080116) |
| 0.0 | 0.1 | GO:0003785 | actin monomer binding(GO:0003785) |
| 0.0 | 0.1 | GO:0015098 | molybdate ion transmembrane transporter activity(GO:0015098) |
| 0.0 | 0.4 | GO:0016762 | xyloglucan:xyloglucosyl transferase activity(GO:0016762) |
| 0.0 | 0.1 | GO:0003862 | 3-isopropylmalate dehydrogenase activity(GO:0003862) |
| 0.0 | 0.1 | GO:0004849 | uridine kinase activity(GO:0004849) |
| 0.0 | 0.0 | GO:0015299 | solute:proton antiporter activity(GO:0015299) |
| 0.0 | 0.0 | GO:0080042 | ADP-glucose pyrophosphohydrolase activity(GO:0080042) |
| 0.0 | 0.2 | GO:0042389 | omega-3 fatty acid desaturase activity(GO:0042389) |
| 0.0 | 0.1 | GO:0004123 | cystathionine gamma-lyase activity(GO:0004123) |
| 0.0 | 0.1 | GO:0043023 | ribosomal large subunit binding(GO:0043023) |
| 0.0 | 0.2 | GO:0034485 | phosphatidylinositol-3,4,5-trisphosphate 5-phosphatase activity(GO:0034485) |
| 0.0 | 0.6 | GO:0015035 | protein disulfide oxidoreductase activity(GO:0015035) |
| 0.0 | 0.1 | GO:0004367 | glycerol-3-phosphate dehydrogenase [NAD+] activity(GO:0004367) |
| 0.0 | 0.4 | GO:0031593 | polyubiquitin binding(GO:0031593) |
| 0.0 | 0.2 | GO:0004017 | adenylate kinase activity(GO:0004017) |
| 0.0 | 0.2 | GO:0009927 | histidine phosphotransfer kinase activity(GO:0009927) |
| 0.0 | 0.2 | GO:0008308 | voltage-gated anion channel activity(GO:0008308) |
| 0.0 | 0.5 | GO:0003714 | transcription corepressor activity(GO:0003714) |
| 0.0 | 0.8 | GO:0008514 | organic anion transmembrane transporter activity(GO:0008514) |
| 0.0 | 1.0 | GO:0003724 | RNA helicase activity(GO:0003724) |
| 0.0 | 0.4 | GO:0004724 | magnesium-dependent protein serine/threonine phosphatase activity(GO:0004724) |
| 0.0 | 0.1 | GO:0004345 | glucose-6-phosphate dehydrogenase activity(GO:0004345) |
| 0.0 | 0.1 | GO:0019238 | cyclohydrolase activity(GO:0019238) |
| 0.0 | 0.1 | GO:0052622 | ATP dimethylallyltransferase activity(GO:0052622) ADP dimethylallyltransferase activity(GO:0052623) |
| 0.0 | 0.6 | GO:0019901 | protein kinase binding(GO:0019901) |
| 0.0 | 0.0 | GO:0047209 | coniferyl-alcohol glucosyltransferase activity(GO:0047209) |
| 0.0 | 0.2 | GO:0070122 | isopeptidase activity(GO:0070122) |
| 0.0 | 0.3 | GO:0008810 | cellulase activity(GO:0008810) |
| 0.0 | 0.3 | GO:0005179 | hormone activity(GO:0005179) |
| 0.0 | 1.6 | GO:0008134 | transcription factor binding(GO:0008134) |
Gene overrepresentation in curated gene sets: canonical pathways category:
| Log-likelihood per target | Total log-likelihood | Term | Description |
|---|---|---|---|
| 0.1 | 0.2 | PID ARF6 DOWNSTREAM PATHWAY | Arf6 downstream pathway |
| 0.1 | 0.3 | PID HDAC CLASSII PATHWAY | Signaling events mediated by HDAC Class II |
| 0.1 | 0.2 | SIG PIP3 SIGNALING IN CARDIAC MYOCTES | Genes related to PIP3 signaling in cardiac myocytes |
| 0.1 | 0.6 | PID MYC ACTIV PATHWAY | Validated targets of C-MYC transcriptional activation |
| 0.0 | 0.1 | PID LYMPH ANGIOGENESIS PATHWAY | VEGFR3 signaling in lymphatic endothelium |
| 0.0 | 0.2 | PID ERA GENOMIC PATHWAY | Validated nuclear estrogen receptor alpha network |
| 0.0 | 0.1 | PID MTOR 4PATHWAY | mTOR signaling pathway |
| 0.0 | 0.1 | PID A6B1 A6B4 INTEGRIN PATHWAY | a6b1 and a6b4 Integrin signaling |
| 0.0 | 0.1 | PID P73PATHWAY | p73 transcription factor network |
| 0.0 | 0.1 | PID INTEGRIN A9B1 PATHWAY | Alpha9 beta1 integrin signaling events |
| 0.0 | 0.1 | PID ATM PATHWAY | ATM pathway |
| 0.0 | 0.0 | PID PTP1B PATHWAY | Signaling events mediated by PTP1B |
| 0.0 | 0.1 | PID HES HEY PATHWAY | Notch-mediated HES/HEY network |
Gene overrepresentation in curated gene sets: REACTOME pathways category:
| Log-likelihood per target | Total log-likelihood | Term | Description |
|---|---|---|---|
| 0.3 | 0.8 | REACTOME GLYCOSPHINGOLIPID METABOLISM | Genes involved in Glycosphingolipid metabolism |
| 0.1 | 0.4 | REACTOME HDL MEDIATED LIPID TRANSPORT | Genes involved in HDL-mediated lipid transport |
| 0.1 | 0.3 | REACTOME PURINE METABOLISM | Genes involved in Purine metabolism |
| 0.1 | 0.3 | REACTOME PRE NOTCH EXPRESSION AND PROCESSING | Genes involved in Pre-NOTCH Expression and Processing |
| 0.1 | 0.2 | REACTOME CITRIC ACID CYCLE TCA CYCLE | Genes involved in Citric acid cycle (TCA cycle) |
| 0.1 | 0.2 | REACTOME GOLGI ASSOCIATED VESICLE BIOGENESIS | Genes involved in Golgi Associated Vesicle Biogenesis |
| 0.1 | 0.8 | REACTOME ABCA TRANSPORTERS IN LIPID HOMEOSTASIS | Genes involved in ABCA transporters in lipid homeostasis |
| 0.1 | 0.3 | REACTOME PI METABOLISM | Genes involved in PI Metabolism |
| 0.1 | 0.4 | REACTOME METABOLISM OF VITAMINS AND COFACTORS | Genes involved in Metabolism of vitamins and cofactors |
| 0.0 | 0.1 | REACTOME TELOMERE MAINTENANCE | Genes involved in Telomere Maintenance |
| 0.0 | 0.4 | REACTOME PLATELET ACTIVATION SIGNALING AND AGGREGATION | Genes involved in Platelet activation, signaling and aggregation |
| 0.0 | 0.4 | REACTOME ASPARAGINE N LINKED GLYCOSYLATION | Genes involved in Asparagine N-linked glycosylation |
| 0.0 | 0.7 | REACTOME HEMOSTASIS | Genes involved in Hemostasis |
| 0.0 | 0.1 | REACTOME AMINO ACID SYNTHESIS AND INTERCONVERSION TRANSAMINATION | Genes involved in Amino acid synthesis and interconversion (transamination) |
| 0.0 | 0.1 | REACTOME TRANSPORT OF MATURE MRNA DERIVED FROM AN INTRONLESS TRANSCRIPT | Genes involved in Transport of Mature mRNA Derived from an Intronless Transcript |
| 0.0 | 0.1 | REACTOME INTRINSIC PATHWAY FOR APOPTOSIS | Genes involved in Intrinsic Pathway for Apoptosis |
| 0.0 | 0.2 | REACTOME TRANSCRIPTIONAL REGULATION OF WHITE ADIPOCYTE DIFFERENTIATION | Genes involved in Transcriptional Regulation of White Adipocyte Differentiation |
| 0.0 | 0.2 | REACTOME POL SWITCHING | Genes involved in Polymerase switching |
| 0.0 | 0.1 | REACTOME METABOLISM OF LIPIDS AND LIPOPROTEINS | Genes involved in Metabolism of lipids and lipoproteins |
| 0.0 | 0.1 | REACTOME SIGNALING BY ERBB4 | Genes involved in Signaling by ERBB4 |
| 0.0 | 0.1 | REACTOME INTEGRIN CELL SURFACE INTERACTIONS | Genes involved in Integrin cell surface interactions |
| 0.0 | 0.1 | REACTOME E2F ENABLED INHIBITION OF PRE REPLICATION COMPLEX FORMATION | Genes involved in E2F-enabled inhibition of pre-replication complex formation |
| 0.0 | 0.0 | REACTOME PYRUVATE METABOLISM AND CITRIC ACID TCA CYCLE | Genes involved in Pyruvate metabolism and Citric Acid (TCA) cycle |