Project
GSE130291:vernalization in Arabidopsis thaliana
Navigation
Downloads
Results for AT3G10113
Z-value: 0.82
Transcription factors associated with AT3G10113
| Gene Symbol | Gene ID | Gene Info |
|---|---|---|
|
AT3G10113
|
AT3G10113 | Homeodomain-like superfamily protein |
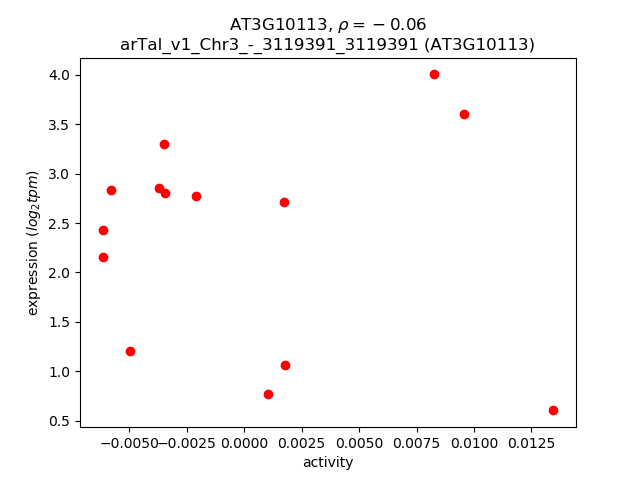
Activity-expression correlation:
| Gene | Promoter | Pearson corr. coef. | P-value | Plot |
|---|---|---|---|---|
| AT3G10113 | arTal_v1_Chr3_-_3119391_3119391 | -0.06 | 8.4e-01 | Click! |
Activity profile of AT3G10113 motif
Sorted Z-values of AT3G10113 motif
| Promoter | Log-likelihood | Transcript | Gene | Gene Info |
|---|---|---|---|---|
| arTal_v1_Chr4_-_12337599_12337599 | 1.28 |
AT4G23680.1
|
AT4G23680
|
Polyketide cyclase/dehydrase and lipid transport superfamily protein |
| arTal_v1_Chr5_-_15135169_15135169 | 1.26 |
AT5G37990.1
|
AT5G37990
|
S-adenosyl-L-methionine-dependent methyltransferase superfamily protein |
| arTal_v1_Chr4_+_2449434_2449434 | 1.17 |
AT4G04840.1
|
MSRB6
|
methionine sulfoxide reductase B6 |
| arTal_v1_Chr1_-_7553975_7553975 | 1.15 |
AT1G21550.1
|
AT1G21550
|
Calcium-binding EF-hand family protein |
| arTal_v1_Chr5_+_6833564_6833659 | 1.11 |
AT5G20250.2
AT5G20250.1 AT5G20250.4 AT5G20250.3 |
DIN10
|
Raffinose synthase family protein |
| arTal_v1_Chr5_+_16441808_16441808 | 1.11 |
AT5G41080.2
|
GDPD2
|
PLC-like phosphodiesterases superfamily protein |
| arTal_v1_Chr5_+_19434758_19434758 | 1.10 |
AT5G47990.1
|
CYP705A5
|
cytochrome P450, family 705, subfamily A, polypeptide 5 |
| arTal_v1_Chr5_+_16441655_16441655 | 1.09 |
AT5G41080.1
|
GDPD2
|
PLC-like phosphodiesterases superfamily protein |
| arTal_v1_Chr1_+_28053030_28053030 | 1.04 |
AT1G74670.1
|
GASA6
|
Gibberellin-regulated family protein |
| arTal_v1_Chr5_+_19183523_19183571 | 1.03 |
AT5G47240.2
AT5G47240.1 |
NUDT8
|
nudix hydrolase homolog 8 |
| arTal_v1_Chr3_-_11194897_11194993 | 1.02 |
AT3G29250.2
AT3G29250.1 |
SDR4
|
NAD(P)-binding Rossmann-fold superfamily protein |
| arTal_v1_Chr5_-_8181107_8181107 | 1.00 |
AT5G24155.2
AT5G24155.3 AT5G24155.1 |
AT5G24155
|
FAD/NAD(P)-binding oxidoreductase family protein |
| arTal_v1_Chr5_-_15167859_15167864 | 0.98 |
AT5G38020.2
AT5G38020.1 |
AT5G38020
|
S-adenosyl-L-methionine-dependent methyltransferases superfamily protein |
| arTal_v1_Chr1_-_9649323_9649323 | 0.97 |
AT1G27730.1
|
STZ
|
salt tolerance zinc finger |
| arTal_v1_Chr4_+_13391293_13391344 | 0.97 |
AT4G26530.2
AT4G26530.1 |
FBA5
|
Aldolase superfamily protein |
| arTal_v1_Chr5_+_9200271_9200271 | 0.96 |
AT5G26260.1
|
AT5G26260
|
TRAF-like family protein |
| arTal_v1_Chr4_+_13390754_13390754 | 0.95 |
AT4G26530.3
|
FBA5
|
Aldolase superfamily protein |
| arTal_v1_Chr1_-_7396773_7396823 | 0.95 |
AT1G21120.1
AT1G21120.2 |
IGMT2
|
O-methyltransferase family protein |
| arTal_v1_Chr1_+_29130375_29130375 | 0.93 |
AT1G77520.1
|
AT1G77520
|
O-methyltransferase family protein |
| arTal_v1_Chr4_+_12916926_12916926 | 0.92 |
AT4G25200.1
|
HSP23.6-MITO
|
mitochondrion-localized small heat shock protein 23.6 |
| arTal_v1_Chr1_+_28251626_28251626 | 0.92 |
AT1G75280.1
|
AT1G75280
|
NmrA-like negative transcriptional regulator family protein |
| arTal_v1_Chr4_+_6826587_6826587 | 0.92 |
AT4G11190.1
|
AT4G11190
|
Disease resistance-responsive (dirigent-like protein) family protein |
| arTal_v1_Chr5_-_19036938_19036938 | 0.92 |
AT5G46890.1
|
AT5G46890
|
Bifunctional inhibitor/lipid-transfer protein/seed storage 2S albumin superfamily protein |
| arTal_v1_Chr3_+_8703220_8703220 | 0.89 |
AT3G24100.1
|
AT3G24100
|
Uncharacterized protein family SERF |
| arTal_v1_Chr5_-_15378416_15378416 | 0.89 |
AT5G38410.3
AT5G38410.2 |
RBCS3B
|
Ribulose bisphosphate carboxylase (small chain) family protein |
| arTal_v1_Chr5_-_15378642_15378642 | 0.89 |
AT5G38410.1
|
RBCS3B
|
Ribulose bisphosphate carboxylase (small chain) family protein |
| arTal_v1_Chr2_-_1007186_1007186 | 0.88 |
AT2G03310.1
|
AT2G03310
|
transmembrane protein |
| arTal_v1_Chr1_-_5160179_5160179 | 0.88 |
AT1G14960.1
|
AT1G14960
|
Polyketide cyclase/dehydrase and lipid transport superfamily protein |
| arTal_v1_Chr3_+_17879542_17879542 | 0.88 |
AT3G48280.1
|
CYP71A25
|
cytochrome P450, family 71, subfamily A, polypeptide 25 |
| arTal_v1_Chr2_+_235925_235925 | 0.87 |
AT2G01520.1
|
MLP328
|
MLP-like protein 328 |
| arTal_v1_Chr5_+_1119937_1119937 | 0.86 |
AT5G04120.1
|
AT5G04120
|
Phosphoglycerate mutase family protein |
| arTal_v1_Chr2_-_14541617_14541617 | 0.84 |
AT2G34500.1
|
CYP710A1
|
cytochrome P450, family 710, subfamily A, polypeptide 1 |
| arTal_v1_Chr4_+_17852441_17852441 | 0.83 |
AT4G37980.2
AT4G37980.1 |
ELI3-1
|
cinnamyl alcohol dehydrogenase 7 |
| arTal_v1_Chr5_+_19428888_19428888 | 0.83 |
AT5G47980.1
|
AT5G47980
|
HXXXD-type acyl-transferase family protein |
| arTal_v1_Chr4_+_12686459_12686459 | 0.82 |
AT4G24570.1
|
DIC2
|
dicarboxylate carrier 2 |
| arTal_v1_Chr3_-_18375940_18375940 | 0.82 |
AT3G49580.1
|
LSU1
|
response to low sulfur 1 |
| arTal_v1_Chr3_-_18375784_18375784 | 0.81 |
AT3G49580.3
AT3G49580.2 |
LSU1
|
response to low sulfur 1 |
| arTal_v1_Chr1_-_19493122_19493122 | 0.81 |
AT1G52342.1
|
AT1G52342
|
hypothetical protein |
| arTal_v1_Chr3_+_10538005_10538105 | 0.80 |
AT3G28270.2
AT3G28270.1 |
AT3G28270
|
transmembrane protein, putative (DUF677) |
| arTal_v1_Chr4_+_9759203_9759203 | 0.79 |
AT4G17500.1
|
ERF-1
|
ethylene responsive element binding factor 1 |
| arTal_v1_Chr2_+_12589866_12590058 | 0.79 |
AT2G29310.3
AT2G29310.1 AT2G29310.2 AT2G29310.4 |
AT2G29310
|
NAD(P)-binding Rossmann-fold superfamily protein |
| arTal_v1_Chr3_-_11195171_11195171 | 0.79 |
AT3G29250.3
|
SDR4
|
NAD(P)-binding Rossmann-fold superfamily protein |
| arTal_v1_Chr4_-_9754161_9754161 | 0.79 |
AT4G17490.1
|
ERF6
|
ethylene responsive element binding factor 6 |
| arTal_v1_Chr4_-_5648727_5648868 | 0.78 |
AT4G08870.2
AT4G08870.1 |
ARGAH2
|
Arginase/deacetylase superfamily protein |
| arTal_v1_Chr5_-_9164816_9164884 | 0.78 |
AT5G26220.2
AT5G26220.1 |
AT5G26220
|
ChaC-like family protein |
| arTal_v1_Chr4_+_12607371_12607371 | 0.78 |
AT4G24340.1
|
AT4G24340
|
Phosphorylase superfamily protein |
| arTal_v1_Chr1_-_7388512_7388512 | 0.78 |
AT1G21100.1
|
IGMT1
|
O-methyltransferase family protein |
| arTal_v1_Chr2_+_7845923_7845999 | 0.77 |
AT2G18050.2
AT2G18050.1 |
HIS1-3
|
histone H1-3 |
| arTal_v1_Chr2_-_6960216_6960216 | 0.77 |
AT2G16005.1
|
AT2G16005
|
MD-2-related lipid recognition domain-containing protein |
| arTal_v1_Chr5_+_7664871_7664871 | 0.76 |
AT5G22920.2
AT5G22920.1 |
AT5G22920
|
CHY-type/CTCHY-type/RING-type Zinc finger protein |
| arTal_v1_Chr1_-_24558322_24558322 | 0.76 |
AT1G65970.1
|
TPX2
|
thioredoxin-dependent peroxidase 2 |
| arTal_v1_Chr4_-_8854706_8854706 | 0.76 |
AT4G15490.1
|
UGT84A3
|
UDP-Glycosyltransferase superfamily protein |
| arTal_v1_Chr1_+_30241452_30241452 | 0.75 |
AT1G80440.1
|
AT1G80440
|
Galactose oxidase/kelch repeat superfamily protein |
| arTal_v1_Chr1_-_23137254_23137254 | 0.74 |
AT1G62510.1
|
AT1G62510
|
Bifunctional inhibitor/lipid-transfer protein/seed storage 2S albumin superfamily protein |
| arTal_v1_Chr1_+_23128651_23128651 | 0.74 |
AT1G62480.1
|
AT1G62480
|
Vacuolar calcium-binding protein-like protein |
| arTal_v1_Chr3_-_12451556_12451556 | 0.74 |
AT3G30775.2
AT3G30775.1 |
ERD5
|
Methylenetetrahydrofolate reductase family protein |
| arTal_v1_Chr4_+_1931883_1931883 | 0.74 |
AT4G04020.1
|
FIB
|
fibrillin |
| arTal_v1_Chr5_+_4488476_4488476 | 0.74 |
AT5G13930.1
|
TT4
|
Chalcone and stilbene synthase family protein |
| arTal_v1_Chr1_+_27670626_27670626 | 0.73 |
AT1G73600.1
|
AT1G73600
|
S-adenosyl-L-methionine-dependent methyltransferases superfamily protein |
| arTal_v1_Chr4_-_16168711_16168711 | 0.73 |
AT4G33660.1
|
AT4G33660
|
cysteine-rich TM module stress tolerance protein |
| arTal_v1_Chr1_+_29135904_29135904 | 0.73 |
AT1G77530.1
AT1G77530.2 |
AT1G77530
|
O-methyltransferase family protein |
| arTal_v1_Chr1_-_4970311_4970311 | 0.72 |
AT1G14520.1
AT1G14520.3 AT1G14520.4 |
MIOX1
|
myo-inositol oxygenase 1 |
| arTal_v1_Chr5_-_19040456_19040456 | 0.72 |
AT5G46900.1
|
AT5G46900
|
Bifunctional inhibitor/lipid-transfer protein/seed storage 2S albumin superfamily protein |
| arTal_v1_Chr3_+_16789780_16789780 | 0.72 |
AT3G45730.1
|
AT3G45730
|
hypothetical protein |
| arTal_v1_Chr5_+_23187840_23187840 | 0.72 |
AT5G57220.1
|
CYP81F2
|
cytochrome P450, family 81, subfamily F, polypeptide 2 |
| arTal_v1_Chr3_-_21293158_21293171 | 0.72 |
AT3G57520.2
AT3G57520.3 AT3G57520.1 |
SIP2
|
seed imbibition 2 |
| arTal_v1_Chr1_+_17123785_17123821 | 0.72 |
AT1G45201.3
AT1G45201.1 AT1G45201.2 |
TLL1
|
triacylglycerol lipase-like 1 |
| arTal_v1_Chr5_-_7828724_7828724 | 0.71 |
AT5G23240.1
|
AT5G23240
|
DNAJ heat shock N-terminal domain-containing protein |
| arTal_v1_Chr3_+_22142856_22142856 | 0.71 |
AT3G59940.1
|
AT3G59940
|
Galactose oxidase/kelch repeat superfamily protein |
| arTal_v1_Chr5_+_8033665_8033738 | 0.71 |
AT5G23830.1
AT5G23830.2 |
AT5G23830
|
MD-2-related lipid recognition domain-containing protein |
| arTal_v1_Chr1_-_4975705_4975705 | 0.71 |
AT1G14540.1
|
PER4
|
Peroxidase superfamily protein |
| arTal_v1_Chr5_+_8436352_8436352 | 0.71 |
AT5G24640.1
|
AT5G24640
|
hypothetical protein |
| arTal_v1_Chr3_+_11005638_11005638 | 0.71 |
AT3G29000.1
|
AT3G29000
|
Calcium-binding EF-hand family protein |
| arTal_v1_Chr1_-_2190784_2190784 | 0.71 |
AT1G07135.1
|
AT1G07135
|
glycine-rich protein |
| arTal_v1_Chr2_+_15706285_15706285 | 0.71 |
AT2G37430.1
|
ZAT11
|
C2H2 and C2HC zinc fingers superfamily protein |
| arTal_v1_Chr1_+_16470872_16470872 | 0.71 |
AT1G43675.1
|
AT1G43675
|
|
| arTal_v1_Chr1_-_9128568_9128568 | 0.71 |
AT1G26380.1
|
AT1G26380
|
FAD-binding Berberine family protein |
| arTal_v1_Chr2_+_7606728_7606905 | 0.70 |
AT2G17500.2
AT2G17500.1 AT2G17500.3 AT2G17500.4 |
AT2G17500
|
Auxin efflux carrier family protein |
| arTal_v1_Chr2_+_18347765_18347765 | 0.70 |
AT2G44460.2
|
BGLU28
|
beta glucosidase 28 |
| arTal_v1_Chr4_-_14827211_14827211 | 0.70 |
AT4G30280.1
|
XTH18
|
xyloglucan endotransglucosylase/hydrolase 18 |
| arTal_v1_Chr1_+_5204312_5204433 | 0.70 |
AT1G15125.1
AT1G15125.2 |
AT1G15125
|
S-adenosyl-L-methionine-dependent methyltransferases superfamily protein |
| arTal_v1_Chr2_-_15412064_15412064 | 0.69 |
AT2G36750.1
|
UGT73C1
|
UDP-glucosyl transferase 73C1 |
| arTal_v1_Chr5_-_18954692_18954692 | 0.69 |
AT5G46710.1
AT5G46710.2 AT5G46710.3 |
AT5G46710
|
PLATZ transcription factor family protein |
| arTal_v1_Chr1_+_27669152_27669152 | 0.69 |
AT1G73600.2
|
AT1G73600
|
S-adenosyl-L-methionine-dependent methyltransferases superfamily protein |
| arTal_v1_Chr5_+_21009347_21009347 | 0.68 |
AT5G51720.1
|
NEET
|
2 iron, 2 sulfur cluster binding protein |
| arTal_v1_Chr1_+_22628264_22628409 | 0.68 |
AT1G61340.1
AT1G61340.2 |
FBS1
|
F-box family protein |
| arTal_v1_Chr1_+_26705420_26705428 | 0.67 |
AT1G70820.1
AT1G70820.2 |
AT1G70820
|
phosphoglucomutase, putative / glucose phosphomutase |
| arTal_v1_Chr5_-_26519242_26519242 | 0.67 |
AT5G66400.2
|
RAB18
|
Dehydrin family protein |
| arTal_v1_Chr1_-_28919764_28919764 | 0.67 |
AT1G76955.1
|
AT1G76955
|
Expressed protein |
| arTal_v1_Chr3_+_18465318_18465318 | 0.67 |
AT3G49780.1
|
PSK4
|
phytosulfokine 4 precursor |
| arTal_v1_Chr2_+_18346306_18346306 | 0.67 |
AT2G44460.1
|
BGLU28
|
beta glucosidase 28 |
| arTal_v1_Chr5_-_19447149_19447380 | 0.66 |
AT5G48000.7
AT5G48000.4 AT5G48000.2 AT5G48000.3 AT5G48000.5 AT5G48000.6 |
CYP708A2
|
cytochrome P450, family 708, subfamily A, polypeptide 2 |
| arTal_v1_Chr2_-_1339468_1339468 | 0.66 |
AT2G04050.1
|
AT2G04050
|
MATE efflux family protein |
| arTal_v1_Chr3_+_9827682_9827682 | 0.66 |
AT3G26740.1
|
CCL
|
CCR-like protein |
| arTal_v1_Chr1_+_3066674_3066753 | 0.66 |
AT1G09500.1
AT1G09500.2 AT1G09500.3 |
AT1G09500
|
NAD(P)-binding Rossmann-fold superfamily protein |
| arTal_v1_Chr2_+_8097420_8097420 | 0.66 |
AT2G18690.2
AT2G18690.1 |
AT2G18690
|
transmembrane protein |
| arTal_v1_Chr3_-_18649521_18649521 | 0.65 |
AT3G50310.1
|
MAPKKK20
|
mitogen-activated protein kinase kinase kinase 20 |
| arTal_v1_Chr1_+_6945695_6945695 | 0.65 |
AT1G20030.1
|
AT1G20030
|
Pathogenesis-related thaumatin superfamily protein |
| arTal_v1_Chr2_+_19605030_19605030 | 0.64 |
AT2G47880.1
|
AT2G47880
|
Glutaredoxin family protein |
| arTal_v1_Chr1_-_9973942_9973942 | 0.64 |
AT1G28400.1
|
AT1G28400
|
GATA zinc finger protein |
| arTal_v1_Chr5_+_6282881_6282881 | 0.64 |
AT5G18840.1
|
AT5G18840
|
Major facilitator superfamily protein |
| arTal_v1_Chr1_+_6945425_6945425 | 0.64 |
AT1G20030.2
|
AT1G20030
|
Pathogenesis-related thaumatin superfamily protein |
| arTal_v1_Chr5_-_20801437_20801437 | 0.63 |
AT5G51190.1
|
AT5G51190
|
Integrase-type DNA-binding superfamily protein |
| arTal_v1_Chr2_+_13036814_13036925 | 0.63 |
AT2G30600.4
AT2G30600.5 AT2G30600.1 AT2G30600.3 |
AT2G30600
|
BTB/POZ domain-containing protein |
| arTal_v1_Chr4_-_18275017_18275216 | 0.63 |
AT4G39260.4
AT4G39260.3 AT4G39260.2 AT4G39260.1 |
CCR1
|
cold, circadian rhythm, and RNA binding 1 |
| arTal_v1_Chr5_+_9683988_9683988 | 0.63 |
AT5G27420.1
|
CNI1
|
carbon/nitrogen insensitive 1 |
| arTal_v1_Chr4_-_9497313_9497313 | 0.63 |
AT4G16880.1
|
AT4G16880
|
Leucine-rich repeat (LRR) family protein |
| arTal_v1_Chr5_+_448092_448189 | 0.63 |
AT5G02230.1
AT5G02230.3 AT5G02230.2 |
AT5G02230
|
Haloacid dehalogenase-like hydrolase (HAD) superfamily protein |
| arTal_v1_Chr2_+_12326808_12326808 | 0.63 |
AT2G28720.1
|
AT2G28720
|
Histone superfamily protein |
| arTal_v1_Chr2_+_17409370_17409370 | 0.63 |
AT2G41730.1
|
AT2G41730
|
calcium-binding site protein |
| arTal_v1_Chr4_+_14026577_14026577 | 0.62 |
AT4G28350.1
|
AT4G28350
|
Concanavalin A-like lectin protein kinase family protein |
| arTal_v1_Chr5_-_26519447_26519447 | 0.62 |
AT5G66400.1
|
RAB18
|
Dehydrin family protein |
| arTal_v1_Chr1_+_20525654_20525654 | 0.62 |
AT1G55020.1
|
LOX1
|
lipoxygenase 1 |
| arTal_v1_Chr4_+_10481619_10481619 | 0.62 |
AT4G19170.1
|
NCED4
|
nine-cis-epoxycarotenoid dioxygenase 4 |
| arTal_v1_Chr2_+_13820909_13820909 | 0.62 |
AT2G32550.3
AT2G32550.1 |
AT2G32550
|
Cell differentiation, Rcd1-like protein |
| arTal_v1_Chr2_+_13037238_13037238 | 0.62 |
AT2G30600.6
AT2G30600.2 |
AT2G30600
|
BTB/POZ domain-containing protein |
| arTal_v1_Chr2_-_14399170_14399275 | 0.62 |
AT2G34090.5
AT2G34090.1 AT2G34090.2 AT2G34090.3 AT2G34090.4 |
MEE18
|
maternal effect embryo arrest 18 |
| arTal_v1_Chr1_+_9829261_9829261 | 0.62 |
AT1G28135.1
|
AT1G28135
|
hypothetical protein |
| arTal_v1_Chr1_-_28767517_28767517 | 0.61 |
AT1G76650.2
|
CML38
|
calmodulin-like 38 |
| arTal_v1_Chr5_-_25661007_25661007 | 0.61 |
AT5G64120.1
|
AT5G64120
|
Peroxidase superfamily protein |
| arTal_v1_Chr2_-_16545746_16545746 | 0.61 |
AT2G39700.1
|
EXPA4
|
expansin A4 |
| arTal_v1_Chr2_+_10559173_10559173 | 0.60 |
AT2G24762.1
|
GDU4
|
glutamine dumper 4 |
| arTal_v1_Chr5_-_17099595_17099595 | 0.60 |
AT5G42650.1
|
AOS
|
allene oxide synthase |
| arTal_v1_Chr3_+_5692607_5692607 | 0.60 |
AT3G16720.1
|
ATL2
|
TOXICOS EN LEVADURA 2 |
| arTal_v1_Chr2_-_8533779_8533779 | 0.60 |
AT2G19800.1
|
MIOX2
|
myo-inositol oxygenase 2 |
| arTal_v1_Chr3_+_1549667_1549667 | 0.60 |
AT3G05400.2
|
AT3G05400
|
Major facilitator superfamily protein |
| arTal_v1_Chr1_-_22589789_22589789 | 0.60 |
AT1G61255.1
|
AT1G61255
|
hypothetical protein |
| arTal_v1_Chr3_+_1549446_1549446 | 0.60 |
AT3G05400.1
|
AT3G05400
|
Major facilitator superfamily protein |
| arTal_v1_Chr4_-_17494279_17494279 | 0.60 |
AT4G37150.1
|
MES9
|
methyl esterase 9 |
| arTal_v1_Chr3_+_16379571_16379571 | 0.60 |
AT3G44860.1
|
FAMT
|
farnesoic acid carboxyl-O-methyltransferase |
| arTal_v1_Chr1_+_7094260_7094260 | 0.60 |
AT1G20470.1
|
AT1G20470
|
SAUR-like auxin-responsive protein family |
| arTal_v1_Chr2_-_8913747_8913747 | 0.59 |
AT2G20670.1
|
AT2G20670
|
sugar phosphate exchanger, putative (DUF506) |
| arTal_v1_Chr3_+_16770888_16770888 | 0.59 |
AT3G45680.1
|
AT3G45680
|
Major facilitator superfamily protein |
| arTal_v1_Chr4_+_14517393_14517393 | 0.59 |
AT4G29610.1
|
AT4G29610
|
Cytidine/deoxycytidylate deaminase family protein |
| arTal_v1_Chr4_-_17711031_17711031 | 0.59 |
AT4G37700.1
|
AT4G37700
|
hypothetical protein |
| arTal_v1_Chr5_+_2803833_2803957 | 0.59 |
AT5G08640.1
AT5G08640.2 |
FLS1
|
flavonol synthase 1 |
| arTal_v1_Chr5_-_216773_216773 | 0.59 |
AT5G01550.1
|
LECRKA4.2
|
lectin receptor kinase a4.1 |
| arTal_v1_Chr1_-_8912642_8912642 | 0.59 |
AT1G25400.2
|
AT1G25400
|
transmembrane protein |
| arTal_v1_Chr4_+_11150049_11150049 | 0.59 |
AT4G20820.1
|
AT4G20820
|
FAD-binding Berberine family protein |
| arTal_v1_Chr1_+_27736546_27736546 | 0.58 |
AT1G73750.2
AT1G73750.1 |
AT1G73750
|
alpha/beta hydrolase family protein |
| arTal_v1_Chr2_-_18306395_18306395 | 0.58 |
AT2G44290.1
|
AT2G44290
|
Bifunctional inhibitor/lipid-transfer protein/seed storage 2S albumin superfamily protein |
| arTal_v1_Chr1_-_28767712_28767712 | 0.58 |
AT1G76650.1
|
CML38
|
calmodulin-like 38 |
| arTal_v1_Chr1_-_8912822_8912822 | 0.58 |
AT1G25400.1
|
AT1G25400
|
transmembrane protein |
| arTal_v1_Chr1_+_26654768_26654768 | 0.58 |
AT1G70700.3
AT1G70700.2 |
TIFY7
|
TIFY domain/Divergent CCT motif family protein |
| arTal_v1_Chr5_-_23873691_23873849 | 0.58 |
AT5G59130.1
AT5G59130.2 AT5G59130.3 AT5G59130.4 |
AT5G59130
|
Subtilase family protein |
| arTal_v1_Chr1_+_6130025_6130025 | 0.58 |
AT1G17810.1
|
BETA-TIP
|
beta-tonoplast intrinsic protein |
| arTal_v1_Chr3_+_17051520_17051520 | 0.57 |
AT3G46370.1
AT3G46370.2 |
AT3G46370
|
Leucine-rich repeat protein kinase family protein |
| arTal_v1_Chr2_+_9254378_9254378 | 0.57 |
AT2G21640.1
|
AT2G21640
|
marker for oxidative stress response protein |
| arTal_v1_Chr1_+_24113109_24113109 | 0.56 |
AT1G64900.1
|
CYP89A2
|
cytochrome P450, family 89, subfamily A, polypeptide 2 |
| arTal_v1_Chr3_-_1261634_1261683 | 0.56 |
AT3G04640.2
AT3G04640.1 AT3G04640.3 |
AT3G04640
|
glycine-rich protein |
| arTal_v1_Chr3_+_5337475_5337475 | 0.56 |
AT3G15760.1
|
AT3G15760
|
cytochrome P450 family protein |
| arTal_v1_Chr4_+_11929359_11929359 | 0.56 |
AT4G22690.1
|
CYP706A1
|
cytochrome P450, family 706, subfamily A, polypeptide 1 |
| arTal_v1_Chr4_-_11592238_11592238 | 0.56 |
AT4G21850.2
|
MSRB9
|
methionine sulfoxide reductase B9 |
| arTal_v1_Chr1_+_27432178_27432178 | 0.56 |
AT1G72900.1
|
AT1G72900
|
Toll-Interleukin-Resistance (TIR) domain-containing protein |
| arTal_v1_Chr1_-_10055881_10055881 | 0.56 |
AT1G28610.2
AT1G28610.1 |
AT1G28610
|
GDSL-like Lipase/Acylhydrolase superfamily protein |
| arTal_v1_Chr4_+_16502532_16502532 | 0.56 |
AT4G34550.1
|
AT4G34550
|
F-box protein |
| arTal_v1_Chr1_-_4526204_4526204 | 0.56 |
AT1G13245.1
|
RTFL17
|
ROTUNDIFOLIA like 17 |
| arTal_v1_Chr5_-_19807853_19807853 | 0.56 |
AT5G48850.1
|
ATSDI1
|
Tetratricopeptide repeat (TPR)-like superfamily protein |
| arTal_v1_Chr1_+_28746833_28746833 | 0.55 |
AT1G76600.1
|
AT1G76600
|
poly polymerase |
| arTal_v1_Chr1_+_26654529_26654529 | 0.55 |
AT1G70700.1
|
TIFY7
|
TIFY domain/Divergent CCT motif family protein |
| arTal_v1_Chr1_-_21080423_21080423 | 0.55 |
AT1G56300.1
AT1G56300.2 |
AT1G56300
|
Chaperone DnaJ-domain superfamily protein |
| arTal_v1_Chr3_+_17905725_17905725 | 0.55 |
AT3G48350.2
AT3G48350.1 |
CEP3
|
Cysteine proteinases superfamily protein |
| arTal_v1_Chr3_-_826585_826585 | 0.55 |
AT3G03470.1
|
CYP89A9
|
cytochrome P450, family 87, subfamily A, polypeptide 9 |
| arTal_v1_Chr5_+_8856917_8856997 | 0.55 |
AT5G25450.1
AT5G25450.3 AT5G25450.2 |
AT5G25450
|
Cytochrome bd ubiquinol oxidase, 14kDa subunit |
| arTal_v1_Chr4_+_16502747_16502747 | 0.55 |
AT4G34550.2
|
AT4G34550
|
F-box protein |
| arTal_v1_Chr3_-_8890927_8890927 | 0.55 |
AT3G24460.1
|
AT3G24460
|
Serinc-domain containing serine and sphingolipid biosynthesis protein |
| arTal_v1_Chr5_-_5904380_5904380 | 0.55 |
AT5G17860.2
|
CAX7
|
calcium exchanger 7 |
| arTal_v1_Chr4_-_11592425_11592425 | 0.55 |
AT4G21850.1
|
MSRB9
|
methionine sulfoxide reductase B9 |
| arTal_v1_Chr5_-_5904532_5904532 | 0.55 |
AT5G17860.1
|
CAX7
|
calcium exchanger 7 |
| arTal_v1_Chr5_-_15175566_15175566 | 0.55 |
AT5G38030.1
|
AT5G38030
|
MATE efflux family protein |
| arTal_v1_Chr1_-_26796529_26796532 | 0.55 |
AT1G71030.1
AT1G71030.2 |
MYBL2
|
MYB-like 2 |
| arTal_v1_Chr5_+_21383979_21384017 | 0.54 |
AT5G52750.2
AT5G52750.1 |
AT5G52750
|
Heavy metal transport/detoxification superfamily protein |
| arTal_v1_Chr1_-_2747936_2747967 | 0.54 |
AT1G08630.6
AT1G08630.7 AT1G08630.5 AT1G08630.2 |
THA1
|
threonine aldolase 1 |
| arTal_v1_Chr1_-_4066344_4066344 | 0.54 |
AT1G12030.1
|
AT1G12030
|
phosphoenolpyruvate carboxylase, putative (DUF506) |
| arTal_v1_Chr1_-_9956960_9956980 | 0.54 |
AT1G28370.1
AT1G28370.2 |
ERF11
|
ERF domain protein 11 |
| arTal_v1_Chr5_+_22893151_22893151 | 0.54 |
AT5G56540.1
|
AGP14
|
arabinogalactan protein 14 |
| arTal_v1_Chr1_-_16838562_16838562 | 0.53 |
AT1G44350.1
|
ILL6
|
IAA-amino acid hydrolase ILR1-like 6 |
| arTal_v1_Chr4_+_7304323_7304323 | 0.53 |
AT4G12290.2
|
AT4G12290
|
Copper amine oxidase family protein |
| arTal_v1_Chr4_+_7439115_7439115 | 0.53 |
AT4G12550.1
|
AIR1
|
Auxin-Induced in Root cultures 1 |
| arTal_v1_Chr4_-_17550257_17550257 | 0.53 |
AT4G37290.1
|
AT4G37290
|
transmembrane protein |
| arTal_v1_Chr4_+_7740283_7740283 | 0.53 |
AT4G13290.1
|
CYP71A19
|
cytochrome P450, family 71, subfamily A, polypeptide 19 |
| arTal_v1_Chr5_-_19172956_19172956 | 0.53 |
AT5G47220.1
|
ERF2
|
ethylene responsive element binding factor 2 |
| arTal_v1_Chr2_+_16011233_16011233 | 0.53 |
AT2G38230.1
|
PDX1.1
|
pyridoxine biosynthesis 1.1 |
| arTal_v1_Chr5_-_26607012_26607012 | 0.53 |
AT5G66650.1
|
AT5G66650
|
calcium uniporter (DUF607) |
| arTal_v1_Chr4_+_7434199_7434199 | 0.53 |
AT4G12545.1
|
AT4G12545
|
Bifunctional inhibitor/lipid-transfer protein/seed storage 2S albumin superfamily protein |
| arTal_v1_Chr1_+_22824414_22824414 | 0.53 |
AT1G61800.2
AT1G61800.1 |
GPT2
|
glucose-6-phosphate/phosphate translocator 2 |
| arTal_v1_Chr1_-_27640643_27640643 | 0.52 |
AT1G73500.1
|
MKK9
|
MAP kinase kinase 9 |
| arTal_v1_Chr5_+_84474_84474 | 0.52 |
AT5G01210.1
|
AT5G01210
|
HXXXD-type acyl-transferase family protein |
| arTal_v1_Chr5_+_8217191_8217213 | 0.52 |
AT5G24210.1
AT5G24210.2 AT5G24210.3 |
AT5G24210
|
alpha/beta-Hydrolases superfamily protein |
| arTal_v1_Chr5_+_26772644_26772644 | 0.52 |
AT5G67080.1
|
MAPKKK19
|
mitogen-activated protein kinase kinase kinase 19 |
| arTal_v1_Chr3_-_18804731_18804731 | 0.52 |
AT3G50640.1
|
AT3G50640
|
hypothetical protein |
| arTal_v1_Chr4_-_468294_468294 | 0.52 |
AT4G01080.1
|
TBL26
|
TRICHOME BIREFRINGENCE-LIKE 26 |
| arTal_v1_Chr4_+_14920376_14920376 | 0.52 |
AT4G30530.1
|
GGP1
|
Class I glutamine amidotransferase-like superfamily protein |
| arTal_v1_Chr5_+_19456837_19456960 | 0.52 |
AT5G48010.2
AT5G48010.1 |
THAS1
|
thalianol synthase 1 |
| arTal_v1_Chr4_+_7303985_7303985 | 0.52 |
AT4G12290.1
|
AT4G12290
|
Copper amine oxidase family protein |
| arTal_v1_Chr3_+_5588459_5588486 | 0.52 |
AT3G16450.3
AT3G16450.1 |
JAL33
|
Mannose-binding lectin superfamily protein |
| arTal_v1_Chr1_+_25957823_25957823 | 0.51 |
AT1G69040.1
|
ACR4
|
ACT domain repeat 4 |
| arTal_v1_Chr3_-_1758807_1758807 | 0.51 |
AT3G05890.1
|
RCI2B
|
Low temperature and salt responsive protein family |
| arTal_v1_Chr1_-_7900335_7900335 | 0.51 |
AT1G22370.1
AT1G22370.2 |
UGT85A5
|
UDP-glucosyl transferase 85A5 |
| arTal_v1_Chr1_+_4084162_4084162 | 0.51 |
AT1G12080.1
AT1G12080.2 |
AT1G12080
|
Vacuolar calcium-binding protein-like protein |
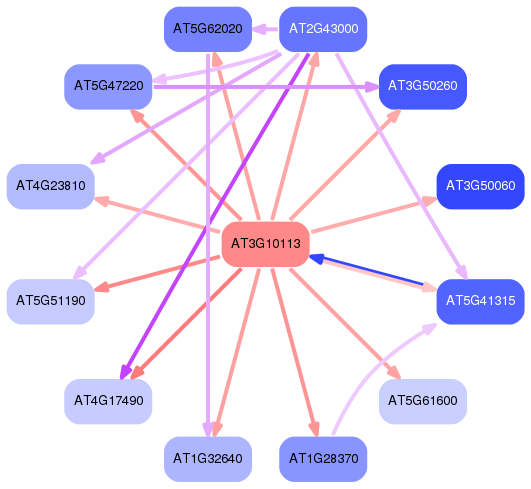
Network of associatons between targets according to the STRING database.

First level regulatory network of AT3G10113
Gene Ontology Analysis
Gene overrepresentation in biological process category:
| Log-likelihood per target | Total log-likelihood | Term | Description |
|---|---|---|---|
| 0.7 | 2.8 | GO:0080003 | thalianol metabolic process(GO:0080003) |
| 0.5 | 2.2 | GO:0046475 | glycerophospholipid catabolic process(GO:0046475) |
| 0.5 | 2.4 | GO:0019310 | inositol catabolic process(GO:0019310) |
| 0.4 | 0.7 | GO:0042436 | tryptophan catabolic process(GO:0006569) indole-containing compound catabolic process(GO:0042436) indolalkylamine catabolic process(GO:0046218) |
| 0.3 | 1.0 | GO:0010597 | green leaf volatile biosynthetic process(GO:0010597) |
| 0.3 | 2.2 | GO:0010438 | cellular response to sulfur starvation(GO:0010438) |
| 0.3 | 0.3 | GO:0048645 | organ formation(GO:0048645) |
| 0.3 | 0.6 | GO:1901568 | icosanoid metabolic process(GO:0006690) fatty acid derivative metabolic process(GO:1901568) |
| 0.3 | 0.9 | GO:0015709 | thiosulfate transport(GO:0015709) succinate transmembrane transport(GO:0071422) |
| 0.3 | 1.1 | GO:0080170 | hydrogen peroxide transmembrane transport(GO:0080170) |
| 0.3 | 0.8 | GO:0060236 | regulation of mitotic spindle organization(GO:0060236) regulation of spindle organization(GO:0090224) |
| 0.3 | 0.8 | GO:0000050 | urea cycle(GO:0000050) |
| 0.3 | 0.8 | GO:0017062 | respiratory chain complex III assembly(GO:0017062) mitochondrial respiratory chain complex III assembly(GO:0034551) mitochondrial respiratory chain complex III biogenesis(GO:0097033) |
| 0.3 | 1.3 | GO:0009759 | indole glucosinolate biosynthetic process(GO:0009759) |
| 0.2 | 0.7 | GO:0033530 | raffinose metabolic process(GO:0033530) |
| 0.2 | 0.7 | GO:0070584 | cell part morphogenesis(GO:0032990) mitochondrion morphogenesis(GO:0070584) |
| 0.2 | 1.4 | GO:0006567 | threonine catabolic process(GO:0006567) |
| 0.2 | 0.5 | GO:0051091 | positive regulation of sequence-specific DNA binding transcription factor activity(GO:0051091) |
| 0.2 | 0.8 | GO:0046416 | D-amino acid metabolic process(GO:0046416) |
| 0.2 | 0.8 | GO:0035264 | multicellular organism growth(GO:0035264) |
| 0.2 | 1.9 | GO:0009961 | response to 1-aminocyclopropane-1-carboxylic acid(GO:0009961) |
| 0.2 | 0.5 | GO:0010045 | response to nickel cation(GO:0010045) |
| 0.2 | 0.7 | GO:0043618 | regulation of transcription from RNA polymerase II promoter in response to stress(GO:0043618) |
| 0.2 | 0.5 | GO:0035436 | triose phosphate transport(GO:0015717) triose phosphate transmembrane transport(GO:0035436) |
| 0.2 | 3.1 | GO:0030388 | fructose 1,6-bisphosphate metabolic process(GO:0030388) |
| 0.2 | 0.2 | GO:2000142 | regulation of DNA-templated transcription, initiation(GO:2000142) |
| 0.2 | 0.7 | GO:0010322 | regulation of isopentenyl diphosphate biosynthetic process, methylerythritol 4-phosphate pathway(GO:0010322) |
| 0.2 | 2.6 | GO:0042343 | indole glucosinolate metabolic process(GO:0042343) |
| 0.2 | 0.5 | GO:0034486 | vacuolar transmembrane transport(GO:0034486) |
| 0.1 | 0.3 | GO:0060151 | peroxisome localization(GO:0060151) |
| 0.1 | 0.6 | GO:2000692 | negative regulation of seed maturation(GO:2000692) |
| 0.1 | 1.1 | GO:0031936 | negative regulation of chromatin silencing(GO:0031936) |
| 0.1 | 1.1 | GO:0042851 | alanine metabolic process(GO:0006522) alanine catabolic process(GO:0006524) pyruvate family amino acid metabolic process(GO:0009078) pyruvate family amino acid catabolic process(GO:0009080) L-alanine metabolic process(GO:0042851) L-alanine catabolic process(GO:0042853) |
| 0.1 | 0.7 | GO:0009807 | lignan metabolic process(GO:0009806) lignan biosynthetic process(GO:0009807) |
| 0.1 | 0.1 | GO:0042908 | xenobiotic transport(GO:0042908) |
| 0.1 | 0.5 | GO:0097298 | regulation of nucleus size(GO:0097298) |
| 0.1 | 1.0 | GO:0009061 | anaerobic respiration(GO:0009061) |
| 0.1 | 0.8 | GO:0009099 | valine biosynthetic process(GO:0009099) |
| 0.1 | 3.3 | GO:0030091 | protein repair(GO:0030091) |
| 0.1 | 1.2 | GO:0015749 | monosaccharide transport(GO:0015749) |
| 0.1 | 1.7 | GO:0015918 | sterol transport(GO:0015918) |
| 0.1 | 0.5 | GO:0015720 | allantoin transport(GO:0015720) |
| 0.1 | 1.2 | GO:1902025 | nitrate import(GO:1902025) |
| 0.1 | 0.4 | GO:0010184 | cytokinin transport(GO:0010184) |
| 0.1 | 0.5 | GO:0006097 | glyoxylate cycle(GO:0006097) |
| 0.1 | 0.3 | GO:0035445 | borate transmembrane transport(GO:0035445) |
| 0.1 | 0.6 | GO:0006788 | heme oxidation(GO:0006788) |
| 0.1 | 0.3 | GO:2000693 | positive regulation of seed maturation(GO:2000693) |
| 0.1 | 0.4 | GO:0000023 | maltose metabolic process(GO:0000023) |
| 0.1 | 0.3 | GO:0051639 | actin filament network formation(GO:0051639) |
| 0.1 | 0.2 | GO:0051176 | positive regulation of sulfur metabolic process(GO:0051176) |
| 0.1 | 0.3 | GO:0060776 | simple leaf morphogenesis(GO:0060776) |
| 0.1 | 0.5 | GO:0019419 | sulfate reduction(GO:0019419) |
| 0.1 | 0.7 | GO:0006597 | spermine biosynthetic process(GO:0006597) |
| 0.1 | 0.3 | GO:0080040 | positive regulation of cellular response to phosphate starvation(GO:0080040) |
| 0.1 | 0.5 | GO:0008615 | pyridoxine biosynthetic process(GO:0008615) |
| 0.1 | 2.0 | GO:0031408 | oxylipin biosynthetic process(GO:0031408) |
| 0.1 | 0.7 | GO:0046135 | pyrimidine ribonucleoside catabolic process(GO:0046133) pyrimidine nucleoside catabolic process(GO:0046135) |
| 0.1 | 0.3 | GO:0033120 | positive regulation of RNA splicing(GO:0033120) |
| 0.1 | 0.2 | GO:0010581 | regulation of starch biosynthetic process(GO:0010581) |
| 0.1 | 0.3 | GO:0010198 | synergid death(GO:0010198) |
| 0.1 | 0.4 | GO:0051938 | L-amino acid import(GO:0043092) L-glutamate import(GO:0051938) |
| 0.1 | 0.2 | GO:0043570 | maintenance of DNA repeat elements(GO:0043570) |
| 0.1 | 0.4 | GO:0009305 | protein biotinylation(GO:0009305) |
| 0.1 | 13.7 | GO:0010200 | response to chitin(GO:0010200) |
| 0.1 | 0.6 | GO:0043290 | sesquiterpenoid catabolic process(GO:0016107) apocarotenoid catabolic process(GO:0043290) abscisic acid catabolic process(GO:0046345) |
| 0.1 | 0.9 | GO:0010023 | proanthocyanidin biosynthetic process(GO:0010023) |
| 0.1 | 1.2 | GO:0010262 | somatic embryogenesis(GO:0010262) |
| 0.1 | 0.2 | GO:0045827 | negative regulation of isoprenoid metabolic process(GO:0045827) |
| 0.1 | 0.3 | GO:0010446 | response to alkaline pH(GO:0010446) |
| 0.1 | 1.3 | GO:0010076 | maintenance of floral meristem identity(GO:0010076) |
| 0.1 | 0.2 | GO:0071242 | cellular response to ammonium ion(GO:0071242) |
| 0.1 | 0.4 | GO:0048533 | sporocyte differentiation(GO:0048533) |
| 0.1 | 0.5 | GO:0016444 | somatic cell DNA recombination(GO:0016444) |
| 0.1 | 0.6 | GO:0032890 | amine transport(GO:0015837) regulation of organic acid transport(GO:0032890) regulation of amine transport(GO:0051952) regulation of amino acid transport(GO:0051955) regulation of amino acid export(GO:0080143) |
| 0.1 | 0.3 | GO:0006768 | biotin metabolic process(GO:0006768) biotin biosynthetic process(GO:0009102) |
| 0.1 | 0.4 | GO:1902418 | (+)-abscisic acid D-glucopyranosyl ester transmembrane transport(GO:1902418) |
| 0.1 | 0.4 | GO:0042218 | 1-aminocyclopropane-1-carboxylate biosynthetic process(GO:0042218) |
| 0.1 | 0.3 | GO:0080119 | ER body organization(GO:0080119) |
| 0.1 | 0.7 | GO:0009939 | positive regulation of gibberellic acid mediated signaling pathway(GO:0009939) |
| 0.1 | 0.2 | GO:0043617 | cellular response to sucrose starvation(GO:0043617) |
| 0.1 | 0.6 | GO:0016103 | diterpenoid catabolic process(GO:0016103) gibberellin catabolic process(GO:0045487) |
| 0.1 | 0.4 | GO:0007043 | cell-cell junction assembly(GO:0007043) |
| 0.1 | 0.2 | GO:0060862 | regulation of floral organ abscission(GO:0060860) negative regulation of floral organ abscission(GO:0060862) |
| 0.1 | 0.1 | GO:0018871 | 1-aminocyclopropane-1-carboxylate metabolic process(GO:0018871) |
| 0.1 | 0.2 | GO:0006883 | cellular sodium ion homeostasis(GO:0006883) |
| 0.1 | 0.3 | GO:0007063 | regulation of sister chromatid cohesion(GO:0007063) |
| 0.1 | 0.2 | GO:0033353 | S-adenosylmethionine cycle(GO:0033353) S-adenosylhomocysteine metabolic process(GO:0046498) |
| 0.1 | 1.3 | GO:0046348 | aminoglycan catabolic process(GO:0006026) chitin metabolic process(GO:0006030) chitin catabolic process(GO:0006032) amino sugar catabolic process(GO:0046348) glucosamine-containing compound catabolic process(GO:1901072) |
| 0.1 | 0.2 | GO:0010213 | non-photoreactive DNA repair(GO:0010213) |
| 0.1 | 1.2 | GO:0002238 | response to molecule of fungal origin(GO:0002238) |
| 0.1 | 0.3 | GO:0099636 | cytoplasmic streaming(GO:0099636) |
| 0.1 | 0.7 | GO:0052317 | camalexin biosynthetic process(GO:0010120) camalexin metabolic process(GO:0052317) |
| 0.1 | 1.2 | GO:0080163 | regulation of protein serine/threonine phosphatase activity(GO:0080163) |
| 0.1 | 0.2 | GO:0033477 | S-methylmethionine metabolic process(GO:0033477) S-methylmethionine cycle(GO:0033528) |
| 0.1 | 0.3 | GO:0090065 | regulation of production of siRNA involved in RNA interference(GO:0090065) |
| 0.1 | 0.7 | GO:0080086 | stamen filament development(GO:0080086) |
| 0.1 | 0.6 | GO:0032876 | negative regulation of DNA endoreduplication(GO:0032876) |
| 0.1 | 0.6 | GO:0080028 | nitrile metabolic process(GO:0050898) nitrile biosynthetic process(GO:0080028) |
| 0.1 | 0.1 | GO:0006750 | glutathione biosynthetic process(GO:0006750) nonribosomal peptide biosynthetic process(GO:0019184) |
| 0.1 | 0.2 | GO:0010124 | phenylacetate catabolic process(GO:0010124) |
| 0.1 | 0.1 | GO:0032963 | collagen metabolic process(GO:0032963) multicellular organism metabolic process(GO:0044236) multicellular organismal macromolecule metabolic process(GO:0044259) |
| 0.1 | 0.4 | GO:0070212 | protein ADP-ribosylation(GO:0006471) protein poly-ADP-ribosylation(GO:0070212) |
| 0.1 | 0.1 | GO:0009268 | response to pH(GO:0009268) |
| 0.1 | 1.1 | GO:0009750 | response to fructose(GO:0009750) |
| 0.1 | 0.3 | GO:0080065 | 4-alpha-methyl-delta7-sterol oxidation(GO:0080065) |
| 0.1 | 0.1 | GO:0010116 | positive regulation of abscisic acid biosynthetic process(GO:0010116) |
| 0.1 | 0.3 | GO:0042759 | long-chain fatty acid biosynthetic process(GO:0042759) |
| 0.1 | 0.7 | GO:0032042 | mitochondrial DNA metabolic process(GO:0032042) |
| 0.1 | 0.4 | GO:0034227 | tRNA thio-modification(GO:0034227) |
| 0.1 | 0.1 | GO:0098849 | phytochelatin metabolic process(GO:0046937) phytochelatin biosynthetic process(GO:0046938) cellular response to cadmium ion(GO:0071276) cellular detoxification of cadmium ion(GO:0098849) |
| 0.1 | 0.1 | GO:0040019 | positive regulation of embryonic development(GO:0040019) |
| 0.1 | 0.8 | GO:0009094 | L-phenylalanine biosynthetic process(GO:0009094) erythrose 4-phosphate/phosphoenolpyruvate family amino acid biosynthetic process(GO:1902223) |
| 0.1 | 0.5 | GO:0043446 | cellular alkane metabolic process(GO:0043446) |
| 0.1 | 0.3 | GO:0032260 | response to jasmonic acid stimulus involved in jasmonic acid and ethylene-dependent systemic resistance(GO:0032260) |
| 0.1 | 0.3 | GO:0010351 | lithium ion transport(GO:0010351) |
| 0.1 | 0.3 | GO:0010507 | negative regulation of autophagy(GO:0010507) |
| 0.1 | 0.3 | GO:0097054 | L-glutamate biosynthetic process(GO:0097054) |
| 0.1 | 0.1 | GO:0090615 | mitochondrial mRNA processing(GO:0090615) |
| 0.1 | 0.4 | GO:2000779 | regulation of double-strand break repair(GO:2000779) |
| 0.1 | 0.4 | GO:0019464 | glycine decarboxylation via glycine cleavage system(GO:0019464) |
| 0.1 | 0.2 | GO:0010063 | atrichoblast differentiation(GO:0010055) positive regulation of trichoblast fate specification(GO:0010063) positive regulation of cell fate specification(GO:0042660) positive regulation of plant epidermal cell differentiation(GO:1903890) |
| 0.1 | 0.4 | GO:0000395 | mRNA 5'-splice site recognition(GO:0000395) |
| 0.1 | 0.2 | GO:0090207 | regulation of triglyceride metabolic process(GO:0090207) |
| 0.1 | 0.2 | GO:0046417 | chorismate metabolic process(GO:0046417) |
| 0.1 | 0.2 | GO:0015800 | acidic amino acid transport(GO:0015800) |
| 0.1 | 0.4 | GO:0046621 | negative regulation of organ growth(GO:0046621) |
| 0.1 | 0.1 | GO:0048832 | specification of organ number(GO:0048832) specification of floral organ number(GO:0048833) |
| 0.1 | 0.2 | GO:1902065 | response to L-glutamate(GO:1902065) |
| 0.1 | 0.2 | GO:1900378 | positive regulation of secondary metabolite biosynthetic process(GO:1900378) |
| 0.1 | 0.7 | GO:0071712 | ER-associated misfolded protein catabolic process(GO:0071712) |
| 0.1 | 1.6 | GO:0009718 | anthocyanin-containing compound biosynthetic process(GO:0009718) |
| 0.1 | 0.3 | GO:0080190 | lateral growth(GO:0080190) |
| 0.1 | 0.6 | GO:0009423 | chorismate biosynthetic process(GO:0009423) |
| 0.1 | 0.4 | GO:0043066 | apoptotic process(GO:0006915) regulation of apoptotic process(GO:0042981) negative regulation of apoptotic process(GO:0043066) |
| 0.1 | 0.4 | GO:0010439 | regulation of glucosinolate biosynthetic process(GO:0010439) |
| 0.1 | 0.3 | GO:0006106 | fumarate metabolic process(GO:0006106) |
| 0.1 | 0.2 | GO:0071423 | malate transmembrane transport(GO:0071423) |
| 0.1 | 0.7 | GO:0042372 | phylloquinone biosynthetic process(GO:0042372) phylloquinone metabolic process(GO:0042374) |
| 0.1 | 1.0 | GO:0033238 | regulation of cellular amino acid metabolic process(GO:0006521) regulation of cellular amine metabolic process(GO:0033238) |
| 0.1 | 0.7 | GO:0010160 | formation of organ boundary(GO:0010160) formation of anatomical boundary(GO:0048859) |
| 0.1 | 0.1 | GO:0019695 | choline metabolic process(GO:0019695) |
| 0.1 | 0.2 | GO:0035404 | histone-serine phosphorylation(GO:0035404) histone H3-S10 phosphorylation(GO:0043987) |
| 0.1 | 0.1 | GO:2000037 | regulation of stomatal complex patterning(GO:2000037) |
| 0.1 | 0.4 | GO:0046482 | para-aminobenzoic acid metabolic process(GO:0046482) |
| 0.1 | 0.4 | GO:0010304 | PSII associated light-harvesting complex II catabolic process(GO:0010304) |
| 0.1 | 0.2 | GO:1902457 | negative regulation of stomatal opening(GO:1902457) |
| 0.1 | 0.4 | GO:0001676 | long-chain fatty acid metabolic process(GO:0001676) |
| 0.1 | 0.9 | GO:0006857 | oligopeptide transport(GO:0006857) peptide transport(GO:0015833) |
| 0.1 | 0.5 | GO:0010230 | alternative respiration(GO:0010230) |
| 0.1 | 0.9 | GO:0005983 | starch catabolic process(GO:0005983) |
| 0.1 | 0.3 | GO:0010077 | maintenance of inflorescence meristem identity(GO:0010077) |
| 0.1 | 0.4 | GO:0006552 | leucine catabolic process(GO:0006552) |
| 0.1 | 0.2 | GO:0051973 | positive regulation of telomerase activity(GO:0051973) |
| 0.1 | 0.7 | GO:0009970 | cellular response to sulfate starvation(GO:0009970) |
| 0.1 | 0.4 | GO:0043266 | regulation of potassium ion transport(GO:0043266) |
| 0.1 | 1.0 | GO:2000032 | regulation of morphogenesis of a branching structure(GO:0060688) regulation of secondary shoot formation(GO:2000032) |
| 0.1 | 9.9 | GO:0071456 | cellular response to hypoxia(GO:0071456) |
| 0.1 | 0.2 | GO:0006210 | thymine catabolic process(GO:0006210) thymine metabolic process(GO:0019859) |
| 0.1 | 1.5 | GO:0099518 | vesicle transport along actin filament(GO:0030050) vesicle cytoskeletal trafficking(GO:0099518) |
| 0.1 | 0.6 | GO:1900057 | positive regulation of leaf senescence(GO:1900057) |
| 0.1 | 0.2 | GO:0006425 | glutaminyl-tRNA aminoacylation(GO:0006425) |
| 0.0 | 0.3 | GO:0080186 | developmental vegetative growth(GO:0080186) |
| 0.0 | 0.2 | GO:0042989 | sequestering of actin monomers(GO:0042989) |
| 0.0 | 0.3 | GO:0034087 | establishment of mitotic sister chromatid cohesion(GO:0034087) establishment of protein localization to chromosome(GO:0070199) rDNA condensation(GO:0070550) establishment of protein localization to chromatin(GO:0071169) transcriptional activation by promoter-enhancer looping(GO:0071733) gene looping(GO:0090202) dsDNA loop formation(GO:0090579) |
| 0.0 | 0.2 | GO:0050792 | regulation of viral process(GO:0050792) |
| 0.0 | 1.6 | GO:2000022 | regulation of jasmonic acid mediated signaling pathway(GO:2000022) |
| 0.0 | 0.2 | GO:0016320 | endoplasmic reticulum membrane fusion(GO:0016320) |
| 0.0 | 0.3 | GO:0046900 | tetrahydrofolylpolyglutamate metabolic process(GO:0046900) |
| 0.0 | 0.2 | GO:0045912 | negative regulation of carbohydrate metabolic process(GO:0045912) |
| 0.0 | 0.2 | GO:0034367 | DNA-templated transcriptional open complex formation(GO:0001112) transcriptional open complex formation at RNA polymerase II promoter(GO:0001113) protein-DNA complex remodeling(GO:0001120) macromolecular complex remodeling(GO:0034367) |
| 0.0 | 0.0 | GO:1903321 | negative regulation of protein modification by small protein conjugation or removal(GO:1903321) |
| 0.0 | 0.6 | GO:0019685 | photosynthesis, dark reaction(GO:0019685) |
| 0.0 | 0.2 | GO:0090646 | mitochondrial tRNA processing(GO:0090646) |
| 0.0 | 0.5 | GO:0009405 | pathogenesis(GO:0009405) |
| 0.0 | 0.2 | GO:0010226 | response to lithium ion(GO:0010226) |
| 0.0 | 0.1 | GO:0006751 | glutathione catabolic process(GO:0006751) |
| 0.0 | 0.2 | GO:0050878 | regulation of body fluid levels(GO:0050878) multicellular organismal water homeostasis(GO:0050891) |
| 0.0 | 0.3 | GO:0010344 | seed oilbody biogenesis(GO:0010344) |
| 0.0 | 0.0 | GO:0017145 | stem cell division(GO:0017145) |
| 0.0 | 0.5 | GO:0007143 | female meiotic division(GO:0007143) |
| 0.0 | 0.1 | GO:1902475 | L-alpha-amino acid transmembrane transport(GO:1902475) |
| 0.0 | 0.1 | GO:0046521 | sphingoid catabolic process(GO:0046521) |
| 0.0 | 0.2 | GO:1900034 | regulation of cellular response to heat(GO:1900034) |
| 0.0 | 0.3 | GO:0071398 | response to fatty acid(GO:0070542) cellular response to fatty acid(GO:0071398) |
| 0.0 | 0.7 | GO:0035336 | long-chain fatty-acyl-CoA metabolic process(GO:0035336) |
| 0.0 | 0.3 | GO:0043155 | photoinhibition(GO:0010205) negative regulation of photosynthesis, light reaction(GO:0043155) negative regulation of photosynthesis(GO:1905156) |
| 0.0 | 0.3 | GO:2000114 | regulation of establishment of cell polarity(GO:2000114) |
| 0.0 | 0.1 | GO:0090143 | nucleoid organization(GO:0090143) |
| 0.0 | 0.2 | GO:0019499 | cyanide metabolic process(GO:0019499) |
| 0.0 | 0.8 | GO:0009773 | photosynthetic electron transport in photosystem I(GO:0009773) |
| 0.0 | 0.8 | GO:0009695 | jasmonic acid biosynthetic process(GO:0009695) |
| 0.0 | 0.2 | GO:0031930 | mitochondria-nucleus signaling pathway(GO:0031930) |
| 0.0 | 0.2 | GO:0019745 | pentacyclic triterpenoid metabolic process(GO:0019742) pentacyclic triterpenoid biosynthetic process(GO:0019745) |
| 0.0 | 0.1 | GO:0072337 | modified amino acid transport(GO:0072337) |
| 0.0 | 0.2 | GO:0016120 | carotene biosynthetic process(GO:0016120) |
| 0.0 | 0.1 | GO:0072388 | FAD biosynthetic process(GO:0006747) flavin adenine dinucleotide biosynthetic process(GO:0072388) |
| 0.0 | 0.3 | GO:0009187 | cyclic nucleotide metabolic process(GO:0009187) |
| 0.0 | 1.6 | GO:0045292 | mRNA cis splicing, via spliceosome(GO:0045292) |
| 0.0 | 0.2 | GO:0048479 | style development(GO:0048479) |
| 0.0 | 0.1 | GO:0032878 | regulation of establishment or maintenance of cell polarity(GO:0032878) |
| 0.0 | 0.1 | GO:1901656 | glycoside transport(GO:1901656) |
| 0.0 | 0.3 | GO:0046294 | formaldehyde catabolic process(GO:0046294) |
| 0.0 | 0.2 | GO:0010321 | regulation of vegetative phase change(GO:0010321) |
| 0.0 | 0.6 | GO:0070897 | DNA-templated transcriptional preinitiation complex assembly(GO:0070897) |
| 0.0 | 0.5 | GO:2000122 | negative regulation of stomatal complex development(GO:2000122) |
| 0.0 | 0.1 | GO:0046386 | deoxyribonucleoside triphosphate catabolic process(GO:0009204) deoxyribose phosphate catabolic process(GO:0046386) |
| 0.0 | 0.1 | GO:2000039 | regulation of trichome morphogenesis(GO:2000039) |
| 0.0 | 0.1 | GO:0015669 | gas transport(GO:0015669) |
| 0.0 | 0.4 | GO:0007050 | cell cycle arrest(GO:0007050) |
| 0.0 | 0.4 | GO:0015740 | C4-dicarboxylate transport(GO:0015740) |
| 0.0 | 0.1 | GO:0000730 | DNA recombinase assembly(GO:0000730) |
| 0.0 | 0.2 | GO:0034755 | iron ion transmembrane transport(GO:0034755) |
| 0.0 | 0.1 | GO:0002100 | tRNA wobble adenosine to inosine editing(GO:0002100) |
| 0.0 | 0.1 | GO:1901522 | positive regulation of transcription from RNA polymerase II promoter involved in unfolded protein response(GO:0006990) positive regulation of transcription from RNA polymerase II promoter involved in cellular response to chemical stimulus(GO:1901522) |
| 0.0 | 0.1 | GO:0006651 | diacylglycerol biosynthetic process(GO:0006651) |
| 0.0 | 0.2 | GO:0010390 | histone monoubiquitination(GO:0010390) |
| 0.0 | 0.2 | GO:0090116 | C-5 methylation of cytosine(GO:0090116) |
| 0.0 | 0.2 | GO:0051014 | actin filament severing(GO:0051014) |
| 0.0 | 0.3 | GO:0009854 | oxidative photosynthetic carbon pathway(GO:0009854) |
| 0.0 | 0.1 | GO:0006110 | regulation of glycolytic process(GO:0006110) regulation of nucleotide catabolic process(GO:0030811) regulation of carbohydrate catabolic process(GO:0043470) regulation of cellular carbohydrate catabolic process(GO:0043471) |
| 0.0 | 0.6 | GO:0010215 | cellulose microfibril organization(GO:0010215) |
| 0.0 | 1.0 | GO:0010584 | pollen exine formation(GO:0010584) |
| 0.0 | 0.2 | GO:1900384 | regulation of flavonol biosynthetic process(GO:1900384) |
| 0.0 | 0.2 | GO:0010115 | regulation of abscisic acid biosynthetic process(GO:0010115) |
| 0.0 | 0.7 | GO:0045493 | xylan catabolic process(GO:0045493) |
| 0.0 | 0.1 | GO:0051055 | negative regulation of lipid biosynthetic process(GO:0051055) |
| 0.0 | 0.1 | GO:0006517 | protein deglycosylation(GO:0006517) |
| 0.0 | 0.1 | GO:0010501 | RNA secondary structure unwinding(GO:0010501) |
| 0.0 | 0.2 | GO:0009823 | cytokinin catabolic process(GO:0009823) hormone catabolic process(GO:0042447) |
| 0.0 | 0.1 | GO:1902289 | negative regulation of defense response to oomycetes(GO:1902289) |
| 0.0 | 0.2 | GO:0016123 | xanthophyll biosynthetic process(GO:0016123) |
| 0.0 | 0.1 | GO:0042548 | regulation of photosynthesis, light reaction(GO:0042548) |
| 0.0 | 0.3 | GO:0036065 | fucosylation(GO:0036065) |
| 0.0 | 0.2 | GO:0010731 | protein glutathionylation(GO:0010731) |
| 0.0 | 0.2 | GO:0015940 | pantothenate metabolic process(GO:0015939) pantothenate biosynthetic process(GO:0015940) |
| 0.0 | 0.5 | GO:0030497 | fatty acid elongation(GO:0030497) |
| 0.0 | 0.3 | GO:0006787 | porphyrin-containing compound catabolic process(GO:0006787) chlorophyll catabolic process(GO:0015996) tetrapyrrole catabolic process(GO:0033015) |
| 0.0 | 0.3 | GO:0015914 | phospholipid transport(GO:0015914) |
| 0.0 | 0.1 | GO:0045901 | positive regulation of translational elongation(GO:0045901) positive regulation of translational termination(GO:0045905) |
| 0.0 | 0.1 | GO:0006361 | transcription initiation from RNA polymerase I promoter(GO:0006361) |
| 0.0 | 0.7 | GO:0009694 | jasmonic acid metabolic process(GO:0009694) |
| 0.0 | 0.7 | GO:0010193 | response to ozone(GO:0010193) |
| 0.0 | 0.1 | GO:0007266 | Rho protein signal transduction(GO:0007266) |
| 0.0 | 0.1 | GO:0000965 | mitochondrial RNA 3'-end processing(GO:0000965) |
| 0.0 | 0.3 | GO:0010196 | nonphotochemical quenching(GO:0010196) energy quenching(GO:1990066) |
| 0.0 | 0.1 | GO:0098795 | mRNA cleavage involved in gene silencing by miRNA(GO:0035279) mRNA cleavage involved in gene silencing(GO:0098795) |
| 0.0 | 0.3 | GO:0005978 | glycogen biosynthetic process(GO:0005978) |
| 0.0 | 0.1 | GO:1901002 | positive regulation of response to salt stress(GO:1901002) |
| 0.0 | 0.3 | GO:0098869 | cellular oxidant detoxification(GO:0098869) |
| 0.0 | 0.1 | GO:0006741 | NADP biosynthetic process(GO:0006741) |
| 0.0 | 0.2 | GO:0015804 | neutral amino acid transport(GO:0015804) |
| 0.0 | 0.6 | GO:0042744 | hydrogen peroxide catabolic process(GO:0042744) |
| 0.0 | 0.1 | GO:0044208 | 'de novo' AMP biosynthetic process(GO:0044208) |
| 0.0 | 0.5 | GO:0019252 | starch biosynthetic process(GO:0019252) |
| 0.0 | 0.4 | GO:0010207 | photosystem II assembly(GO:0010207) |
| 0.0 | 0.1 | GO:0046037 | GMP biosynthetic process(GO:0006177) GMP metabolic process(GO:0046037) |
| 0.0 | 0.5 | GO:0010048 | vernalization response(GO:0010048) |
| 0.0 | 0.1 | GO:0080187 | floral organ senescence(GO:0080187) |
| 0.0 | 0.1 | GO:0006297 | nucleotide-excision repair, DNA gap filling(GO:0006297) |
| 0.0 | 0.4 | GO:0009862 | systemic acquired resistance, salicylic acid mediated signaling pathway(GO:0009862) |
| 0.0 | 0.2 | GO:0015976 | carbon utilization(GO:0015976) |
| 0.0 | 0.1 | GO:0010185 | regulation of cellular defense response(GO:0010185) |
| 0.0 | 0.1 | GO:0010395 | rhamnogalacturonan I metabolic process(GO:0010395) |
| 0.0 | 0.1 | GO:1990428 | miRNA transport(GO:1990428) |
| 0.0 | 0.1 | GO:0010275 | NAD(P)H dehydrogenase complex assembly(GO:0010275) |
| 0.0 | 0.3 | GO:0080027 | response to herbivore(GO:0080027) |
| 0.0 | 0.6 | GO:0005992 | trehalose biosynthetic process(GO:0005992) |
| 0.0 | 0.0 | GO:0006376 | mRNA splice site selection(GO:0006376) |
| 0.0 | 0.1 | GO:0045962 | positive regulation of development, heterochronic(GO:0045962) |
| 0.0 | 0.1 | GO:1904961 | quiescent center organization(GO:1904961) |
| 0.0 | 0.1 | GO:0060919 | auxin influx(GO:0060919) |
| 0.0 | 0.2 | GO:0019288 | isopentenyl diphosphate biosynthetic process, methylerythritol 4-phosphate pathway(GO:0019288) |
| 0.0 | 0.1 | GO:0042149 | cellular response to glucose starvation(GO:0042149) |
| 0.0 | 0.0 | GO:0050000 | chromosome localization(GO:0050000) |
| 0.0 | 0.1 | GO:0051103 | DNA ligation involved in DNA repair(GO:0051103) |
| 0.0 | 0.3 | GO:0046379 | UDP-L-arabinose biosynthetic process(GO:0033358) extracellular polysaccharide biosynthetic process(GO:0045226) capsule polysaccharide biosynthetic process(GO:0045227) capsule organization(GO:0045230) extracellular polysaccharide metabolic process(GO:0046379) |
| 0.0 | 0.0 | GO:0006427 | histidyl-tRNA aminoacylation(GO:0006427) |
| 0.0 | 0.1 | GO:0071031 | nuclear mRNA surveillance of mRNA 3'-end processing(GO:0071031) CUT catabolic process(GO:0071034) CUT metabolic process(GO:0071043) nuclear retention of pre-mRNA with aberrant 3'-ends at the site of transcription(GO:0071049) |
| 0.0 | 0.1 | GO:0006419 | alanyl-tRNA aminoacylation(GO:0006419) |
| 0.0 | 0.1 | GO:0010269 | response to selenium ion(GO:0010269) |
| 0.0 | 0.0 | GO:0055064 | chloride ion homeostasis(GO:0055064) |
| 0.0 | 0.4 | GO:0051761 | sesquiterpene metabolic process(GO:0051761) |
| 0.0 | 0.2 | GO:0016233 | telomere capping(GO:0016233) |
| 0.0 | 0.1 | GO:0009410 | response to xenobiotic stimulus(GO:0009410) |
| 0.0 | 0.1 | GO:2000067 | regulation of root morphogenesis(GO:2000067) |
| 0.0 | 0.1 | GO:0048830 | adventitious root development(GO:0048830) |
| 0.0 | 0.2 | GO:0043068 | positive regulation of programmed cell death(GO:0043068) |
| 0.0 | 0.1 | GO:0000492 | box C/D snoRNP assembly(GO:0000492) |
| 0.0 | 0.5 | GO:0050918 | chemotaxis(GO:0006935) pollen tube guidance(GO:0010183) taxis(GO:0042330) positive chemotaxis(GO:0050918) |
| 0.0 | 0.8 | GO:0048235 | pollen sperm cell differentiation(GO:0048235) |
| 0.0 | 0.1 | GO:0006285 | base-excision repair, AP site formation(GO:0006285) |
| 0.0 | 0.1 | GO:0009957 | epidermal cell fate specification(GO:0009957) |
| 0.0 | 0.1 | GO:0043467 | regulation of generation of precursor metabolites and energy(GO:0043467) |
| 0.0 | 0.1 | GO:1901537 | positive regulation of DNA demethylation(GO:1901537) |
| 0.0 | 0.2 | GO:0006573 | valine metabolic process(GO:0006573) |
| 0.0 | 0.6 | GO:0016575 | histone deacetylation(GO:0016575) |
| 0.0 | 0.8 | GO:0045491 | xylan metabolic process(GO:0045491) |
| 0.0 | 0.0 | GO:0008295 | spermidine biosynthetic process(GO:0008295) |
| 0.0 | 0.3 | GO:0010093 | specification of floral organ identity(GO:0010093) |
| 0.0 | 0.0 | GO:0090322 | regulation of superoxide metabolic process(GO:0090322) |
| 0.0 | 0.0 | GO:0010069 | zygote asymmetric cytokinesis in embryo sac(GO:0010069) |
| 0.0 | 0.0 | GO:0034243 | regulation of transcription elongation from RNA polymerase II promoter(GO:0034243) |
| 0.0 | 0.1 | GO:0046443 | FAD metabolic process(GO:0046443) |
| 0.0 | 0.1 | GO:0046825 | regulation of protein export from nucleus(GO:0046825) |
| 0.0 | 0.2 | GO:0009901 | anther dehiscence(GO:0009901) |
| 0.0 | 0.1 | GO:0001578 | microtubule bundle formation(GO:0001578) |
| 0.0 | 0.3 | GO:0006298 | mismatch repair(GO:0006298) |
| 0.0 | 0.1 | GO:0015969 | guanosine tetraphosphate metabolic process(GO:0015969) purine ribonucleoside bisphosphate metabolic process(GO:0034035) |
| 0.0 | 0.0 | GO:0006971 | hypotonic response(GO:0006971) |
| 0.0 | 0.1 | GO:0072583 | clathrin-mediated endocytosis(GO:0072583) |
| 0.0 | 0.5 | GO:0016126 | sterol biosynthetic process(GO:0016126) |
| 0.0 | 0.1 | GO:0034720 | histone H3-K4 demethylation(GO:0034720) |
| 0.0 | 0.2 | GO:0046513 | ceramide biosynthetic process(GO:0046513) |
| 0.0 | 0.3 | GO:0019915 | lipid storage(GO:0019915) |
| 0.0 | 2.6 | GO:0045944 | positive regulation of transcription from RNA polymerase II promoter(GO:0045944) |
| 0.0 | 0.0 | GO:0019632 | shikimate metabolic process(GO:0019632) |
| 0.0 | 0.0 | GO:0000963 | mitochondrial RNA processing(GO:0000963) |
| 0.0 | 0.1 | GO:0019348 | dolichol metabolic process(GO:0019348) |
| 0.0 | 0.2 | GO:0002213 | defense response to insect(GO:0002213) |
| 0.0 | 0.1 | GO:0009303 | rRNA transcription(GO:0009303) |
| 0.0 | 0.1 | GO:0019509 | L-methionine biosynthetic process from methylthioadenosine(GO:0019509) amino acid salvage(GO:0043102) L-methionine salvage(GO:0071267) |
| 0.0 | 0.1 | GO:0010165 | response to X-ray(GO:0010165) |
| 0.0 | 0.1 | GO:0006624 | vacuolar protein processing(GO:0006624) |
| 0.0 | 0.3 | GO:0048768 | root hair cell tip growth(GO:0048768) |
| 0.0 | 0.2 | GO:0006547 | histidine biosynthetic process(GO:0000105) histidine metabolic process(GO:0006547) imidazole-containing compound metabolic process(GO:0052803) |
| 0.0 | 0.1 | GO:0009052 | pentose-phosphate shunt, non-oxidative branch(GO:0009052) |
| 0.0 | 0.2 | GO:0006722 | triterpenoid metabolic process(GO:0006722) |
| 0.0 | 0.2 | GO:0006535 | cysteine biosynthetic process from serine(GO:0006535) |
| 0.0 | 0.4 | GO:0009833 | plant-type primary cell wall biogenesis(GO:0009833) |
| 0.0 | 1.2 | GO:0043086 | negative regulation of catalytic activity(GO:0043086) |
| 0.0 | 0.1 | GO:0046786 | viral replication complex formation and maintenance(GO:0046786) |
| 0.0 | 0.4 | GO:0043622 | cortical microtubule organization(GO:0043622) |
| 0.0 | 0.0 | GO:0034080 | CENP-A containing nucleosome assembly(GO:0034080) CENP-A containing chromatin organization(GO:0061641) |
| 0.0 | 0.1 | GO:0019427 | acetate metabolic process(GO:0006083) acetyl-CoA biosynthetic process from acetate(GO:0019427) |
| 0.0 | 0.5 | GO:0009809 | lignin biosynthetic process(GO:0009809) |
| 0.0 | 0.0 | GO:0046373 | L-arabinose metabolic process(GO:0046373) |
| 0.0 | 0.2 | GO:0070940 | dephosphorylation of RNA polymerase II C-terminal domain(GO:0070940) |
| 0.0 | 0.1 | GO:0048658 | anther wall tapetum development(GO:0048658) |
| 0.0 | 1.0 | GO:0045490 | pectin catabolic process(GO:0045490) |
| 0.0 | 0.2 | GO:0031048 | chromatin silencing by small RNA(GO:0031048) |
| 0.0 | 0.0 | GO:0009871 | jasmonic acid and ethylene-dependent systemic resistance, ethylene mediated signaling pathway(GO:0009871) |
| 0.0 | 0.0 | GO:0031573 | intra-S DNA damage checkpoint(GO:0031573) |
| 0.0 | 0.0 | GO:0006336 | DNA replication-independent nucleosome assembly(GO:0006336) DNA replication-independent nucleosome organization(GO:0034724) |
| 0.0 | 0.0 | GO:0019323 | pentose catabolic process(GO:0019323) |
| 0.0 | 0.0 | GO:0070676 | intralumenal vesicle formation(GO:0070676) |
| 0.0 | 0.1 | GO:0009969 | xyloglucan biosynthetic process(GO:0009969) |
| 0.0 | 0.0 | GO:0042450 | arginine biosynthetic process via ornithine(GO:0042450) |
| 0.0 | 0.1 | GO:0000463 | maturation of LSU-rRNA from tricistronic rRNA transcript (SSU-rRNA, 5.8S rRNA, LSU-rRNA)(GO:0000463) |
Gene overrepresentation in cellular component category:
| Log-likelihood per target | Total log-likelihood | Term | Description |
|---|---|---|---|
| 0.3 | 1.3 | GO:0035061 | interchromatin granule(GO:0035061) |
| 0.1 | 0.3 | GO:0032432 | actin filament bundle(GO:0032432) |
| 0.1 | 0.5 | GO:0001673 | male germ cell nucleus(GO:0001673) |
| 0.1 | 0.3 | GO:0009317 | acetyl-CoA carboxylase complex(GO:0009317) |
| 0.1 | 0.4 | GO:0042645 | mitochondrial nucleoid(GO:0042645) |
| 0.1 | 0.4 | GO:0005960 | glycine cleavage complex(GO:0005960) |
| 0.1 | 1.4 | GO:0016602 | CCAAT-binding factor complex(GO:0016602) |
| 0.1 | 0.2 | GO:0009514 | glyoxysome(GO:0009514) |
| 0.1 | 0.3 | GO:0035102 | PRC1 complex(GO:0035102) |
| 0.1 | 0.2 | GO:0005652 | nuclear lamina(GO:0005652) |
| 0.1 | 0.4 | GO:0005947 | mitochondrial alpha-ketoglutarate dehydrogenase complex(GO:0005947) mitochondrial tricarboxylic acid cycle enzyme complex(GO:0030062) |
| 0.1 | 0.3 | GO:0005640 | nuclear outer membrane(GO:0005640) |
| 0.1 | 0.4 | GO:0031931 | TORC1 complex(GO:0031931) TOR complex(GO:0038201) |
| 0.1 | 0.6 | GO:0000243 | commitment complex(GO:0000243) |
| 0.1 | 0.2 | GO:0016461 | unconventional myosin complex(GO:0016461) |
| 0.1 | 1.0 | GO:0072686 | mitotic spindle(GO:0072686) |
| 0.1 | 0.6 | GO:0048226 | Casparian strip(GO:0048226) |
| 0.1 | 0.1 | GO:0043073 | germ cell nucleus(GO:0043073) |
| 0.1 | 0.3 | GO:0071818 | BAT3 complex(GO:0071818) |
| 0.1 | 0.6 | GO:0000127 | transcription factor TFIIIC complex(GO:0000127) |
| 0.1 | 0.4 | GO:0032541 | cortical endoplasmic reticulum(GO:0032541) |
| 0.0 | 0.2 | GO:0090397 | stigma papilla(GO:0090397) |
| 0.0 | 0.6 | GO:0000786 | nucleosome(GO:0000786) |
| 0.0 | 1.9 | GO:0010319 | stromule(GO:0010319) |
| 0.0 | 0.5 | GO:0016459 | myosin complex(GO:0016459) |
| 0.0 | 0.4 | GO:0043189 | NuA4 histone acetyltransferase complex(GO:0035267) H4/H2A histone acetyltransferase complex(GO:0043189) H4 histone acetyltransferase complex(GO:1902562) |
| 0.0 | 0.2 | GO:0032044 | DSIF complex(GO:0032044) |
| 0.0 | 0.0 | GO:0031021 | interphase microtubule organizing center(GO:0031021) |
| 0.0 | 0.9 | GO:0012511 | monolayer-surrounded lipid storage body(GO:0012511) |
| 0.0 | 0.1 | GO:0008622 | epsilon DNA polymerase complex(GO:0008622) |
| 0.0 | 0.2 | GO:0046695 | SLIK (SAGA-like) complex(GO:0046695) |
| 0.0 | 0.6 | GO:0010598 | NAD(P)H dehydrogenase complex (plastoquinone)(GO:0010598) |
| 0.0 | 0.1 | GO:0000110 | nucleotide-excision repair factor 1 complex(GO:0000110) |
| 0.0 | 0.2 | GO:0005673 | transcription factor TFIIE complex(GO:0005673) |
| 0.0 | 0.5 | GO:0034399 | nuclear periphery(GO:0034399) |
| 0.0 | 0.2 | GO:0009538 | photosystem I reaction center(GO:0009538) |
| 0.0 | 0.7 | GO:0071004 | U2-type prespliceosome(GO:0071004) prespliceosome(GO:0071010) |
| 0.0 | 0.3 | GO:0005788 | endoplasmic reticulum lumen(GO:0005788) |
| 0.0 | 0.6 | GO:0016324 | apical plasma membrane(GO:0016324) |
| 0.0 | 0.3 | GO:0032300 | mismatch repair complex(GO:0032300) |
| 0.0 | 0.5 | GO:0098807 | chloroplast thylakoid membrane protein complex(GO:0098807) |
| 0.0 | 0.1 | GO:0032133 | chromosome passenger complex(GO:0032133) |
| 0.0 | 0.4 | GO:0005669 | transcription factor TFIID complex(GO:0005669) |
| 0.0 | 0.2 | GO:0000326 | storage vacuole(GO:0000322) protein storage vacuole(GO:0000326) |
| 0.0 | 0.3 | GO:1902495 | transmembrane transporter complex(GO:1902495) |
| 0.0 | 0.1 | GO:0034702 | ion channel complex(GO:0034702) cation channel complex(GO:0034703) |
| 0.0 | 0.1 | GO:0070069 | cytochrome complex(GO:0070069) |
| 0.0 | 1.0 | GO:0031201 | SNARE complex(GO:0031201) |
| 0.0 | 0.1 | GO:0010316 | pyrophosphate-dependent phosphofructokinase complex(GO:0010316) |
| 0.0 | 0.2 | GO:0010005 | cortical microtubule, transverse to long axis(GO:0010005) |
| 0.0 | 4.8 | GO:0031225 | anchored component of membrane(GO:0031225) |
| 0.0 | 0.1 | GO:0031501 | mannosyltransferase complex(GO:0031501) dolichol-phosphate-mannose synthase complex(GO:0033185) |
| 0.0 | 0.2 | GO:0005801 | cis-Golgi network(GO:0005801) |
| 0.0 | 0.1 | GO:0030915 | Smc5-Smc6 complex(GO:0030915) |
| 0.0 | 0.2 | GO:0005689 | U12-type spliceosomal complex(GO:0005689) |
| 0.0 | 0.0 | GO:0009522 | photosystem I(GO:0009522) |
| 0.0 | 0.8 | GO:0090406 | pollen tube(GO:0090406) |
| 0.0 | 0.1 | GO:0048476 | Holliday junction resolvase complex(GO:0048476) |
| 0.0 | 0.1 | GO:0071339 | MLL1/2 complex(GO:0044665) MLL1 complex(GO:0071339) |
| 0.0 | 0.5 | GO:0005764 | lysosome(GO:0005764) |
| 0.0 | 0.1 | GO:0031588 | nucleotide-activated protein kinase complex(GO:0031588) |
| 0.0 | 0.1 | GO:0098590 | plasma membrane region(GO:0098590) |
| 0.0 | 0.0 | GO:0030874 | nucleolar chromatin(GO:0030874) |
| 0.0 | 0.0 | GO:0005674 | transcription factor TFIIF complex(GO:0005674) |
| 0.0 | 0.0 | GO:0010330 | cellulose synthase complex(GO:0010330) |
| 0.0 | 0.1 | GO:0000164 | protein phosphatase type 1 complex(GO:0000164) |
| 0.0 | 0.1 | GO:0005834 | heterotrimeric G-protein complex(GO:0005834) |
Gene overrepresentation in molecular function category:
| Log-likelihood per target | Total log-likelihood | Term | Description |
|---|---|---|---|
| 0.5 | 2.4 | GO:0050113 | inositol oxygenase activity(GO:0050113) |
| 0.4 | 1.2 | GO:0050736 | O-malonyltransferase activity(GO:0050736) |
| 0.3 | 1.0 | GO:0000249 | C-22 sterol desaturase activity(GO:0000249) |
| 0.3 | 1.0 | GO:0050403 | trans-zeatin O-beta-D-glucosyltransferase activity(GO:0050403) cis-zeatin O-beta-D-glucosyltransferase activity(GO:0050502) |
| 0.3 | 1.2 | GO:0005432 | calcium:sodium antiporter activity(GO:0005432) |
| 0.3 | 3.2 | GO:0033743 | peptide-methionine (R)-S-oxide reductase activity(GO:0033743) |
| 0.3 | 0.3 | GO:0005353 | fructose transmembrane transporter activity(GO:0005353) |
| 0.3 | 0.9 | GO:0015117 | thiosulfate transmembrane transporter activity(GO:0015117) |
| 0.3 | 0.9 | GO:0050412 | cinnamate beta-D-glucosyltransferase activity(GO:0050412) |
| 0.3 | 0.9 | GO:0008909 | isochorismate synthase activity(GO:0008909) |
| 0.3 | 1.4 | GO:0004793 | threonine aldolase activity(GO:0004793) L-allo-threonine aldolase activity(GO:0008732) |
| 0.2 | 1.0 | GO:0046423 | allene-oxide cyclase activity(GO:0046423) |
| 0.2 | 1.1 | GO:0031492 | nucleosomal DNA binding(GO:0031492) |
| 0.2 | 0.7 | GO:0004353 | glutamate dehydrogenase [NAD(P)+] activity(GO:0004353) |
| 0.2 | 0.9 | GO:0034722 | gamma-glutamyl-peptidase activity(GO:0034722) |
| 0.2 | 1.6 | GO:0033946 | xyloglucan-specific endo-beta-1,4-glucanase activity(GO:0033946) |
| 0.2 | 0.6 | GO:0003849 | 3-deoxy-7-phosphoheptulonate synthase activity(GO:0003849) |
| 0.2 | 2.8 | GO:0004332 | fructose-bisphosphate aldolase activity(GO:0004332) |
| 0.2 | 1.1 | GO:0016984 | ribulose-bisphosphate carboxylase activity(GO:0016984) |
| 0.2 | 0.8 | GO:0004647 | phosphoserine phosphatase activity(GO:0004647) |
| 0.2 | 0.5 | GO:0015119 | hexose phosphate transmembrane transporter activity(GO:0015119) glucose-6-phosphate transmembrane transporter activity(GO:0015152) |
| 0.2 | 0.5 | GO:0036381 | pyridoxal 5'-phosphate synthase (glutamine hydrolysing) activity(GO:0036381) |
| 0.2 | 0.8 | GO:0016629 | 12-oxophytodienoate reductase activity(GO:0016629) |
| 0.2 | 2.3 | GO:0008889 | glycerophosphodiester phosphodiesterase activity(GO:0008889) |
| 0.2 | 0.5 | GO:0071771 | octadecanal decarbonylase activity(GO:0009924) aldehyde decarbonylase activity(GO:0071771) aldehyde oxygenase (deformylating) activity(GO:1990465) |
| 0.2 | 1.3 | GO:0045543 | gibberellin 2-beta-dioxygenase activity(GO:0045543) C-19 gibberellin 2-beta-dioxygenase activity(GO:0052634) |
| 0.2 | 0.5 | GO:0046027 | phospholipid:diacylglycerol acyltransferase activity(GO:0046027) |
| 0.2 | 1.2 | GO:0004506 | squalene monooxygenase activity(GO:0004506) |
| 0.1 | 0.7 | GO:0005355 | glucose transmembrane transporter activity(GO:0005355) |
| 0.1 | 0.4 | GO:0004134 | 4-alpha-glucanotransferase activity(GO:0004134) |
| 0.1 | 0.7 | GO:0016801 | hydrolase activity, acting on ether bonds(GO:0016801) |
| 0.1 | 0.4 | GO:0016642 | glycine dehydrogenase (decarboxylating) activity(GO:0004375) oxidoreductase activity, acting on the CH-NH2 group of donors, disulfide as acceptor(GO:0016642) |
| 0.1 | 0.4 | GO:0015204 | urea transmembrane transporter activity(GO:0015204) |
| 0.1 | 0.5 | GO:0080118 | brassinosteroid sulfotransferase activity(GO:0080118) |
| 0.1 | 0.4 | GO:0010283 | pinoresinol reductase activity(GO:0010283) |
| 0.1 | 0.5 | GO:0047158 | sinapoylglucose-sinapoylglucose O-sinapoyltransferase activity(GO:0047158) |
| 0.1 | 0.5 | GO:0080042 | ADP-glucose pyrophosphohydrolase activity(GO:0080042) |
| 0.1 | 0.7 | GO:0022835 | ionotropic glutamate receptor activity(GO:0004970) extracellular ligand-gated ion channel activity(GO:0005230) transmitter-gated ion channel activity(GO:0022824) transmitter-gated channel activity(GO:0022835) neurotransmitter receptor activity(GO:0030594) |
| 0.1 | 0.7 | GO:0047958 | glycine:2-oxoglutarate aminotransferase activity(GO:0047958) |
| 0.1 | 0.5 | GO:0004737 | pyruvate decarboxylase activity(GO:0004737) |
| 0.1 | 0.3 | GO:0047100 | glyceraldehyde-3-phosphate dehydrogenase (NADP+) (phosphorylating) activity(GO:0047100) |
| 0.1 | 0.3 | GO:0009374 | biotin binding(GO:0009374) |
| 0.1 | 0.4 | GO:0009973 | adenylyl-sulfate reductase activity(GO:0009973) adenylyl-sulfate reductase (glutathione) activity(GO:0033741) |
| 0.1 | 4.8 | GO:0008171 | O-methyltransferase activity(GO:0008171) |
| 0.1 | 0.8 | GO:0016781 | phosphotransferase activity, paired acceptors(GO:0016781) |
| 0.1 | 0.6 | GO:0047769 | prephenate dehydratase activity(GO:0004664) arogenate dehydratase activity(GO:0047769) |
| 0.1 | 0.3 | GO:0046409 | p-coumarate 3-hydroxylase activity(GO:0046409) |
| 0.1 | 1.0 | GO:0008379 | thioredoxin peroxidase activity(GO:0008379) peroxiredoxin activity(GO:0051920) |
| 0.1 | 0.4 | GO:0015105 | arsenite transmembrane transporter activity(GO:0015105) |
| 0.1 | 0.3 | GO:0010331 | gibberellin binding(GO:0010331) |
| 0.1 | 0.4 | GO:0052578 | alpha-farnesene synthase activity(GO:0052578) |
| 0.1 | 0.7 | GO:0016621 | cinnamoyl-CoA reductase activity(GO:0016621) |
| 0.1 | 0.4 | GO:0047215 | indole-3-acetate beta-glucosyltransferase activity(GO:0047215) |
| 0.1 | 0.4 | GO:0018271 | biotin-[acetyl-CoA-carboxylase] ligase activity(GO:0004077) biotin-protein ligase activity(GO:0018271) |
| 0.1 | 0.6 | GO:0004126 | cytidine deaminase activity(GO:0004126) |
| 0.1 | 0.4 | GO:0043916 | DNA-7-methylguanine glycosylase activity(GO:0043916) |
| 0.1 | 0.3 | GO:0030275 | LRR domain binding(GO:0030275) |
| 0.1 | 0.3 | GO:0004014 | adenosylmethionine decarboxylase activity(GO:0004014) |
| 0.1 | 0.3 | GO:0035671 | enone reductase activity(GO:0035671) |
| 0.1 | 0.4 | GO:0042132 | fructose 1,6-bisphosphate 1-phosphatase activity(GO:0042132) |
| 0.1 | 1.1 | GO:0015145 | monosaccharide transmembrane transporter activity(GO:0015145) |
| 0.1 | 0.4 | GO:0010309 | acireductone dioxygenase [iron(II)-requiring] activity(GO:0010309) |
| 0.1 | 0.6 | GO:0008200 | ion channel inhibitor activity(GO:0008200) channel inhibitor activity(GO:0016248) sodium channel regulator activity(GO:0017080) sodium channel inhibitor activity(GO:0019871) |
| 0.1 | 0.7 | GO:0004392 | heme oxygenase (decyclizing) activity(GO:0004392) |
| 0.1 | 1.0 | GO:0032440 | 2-alkenal reductase [NAD(P)] activity(GO:0032440) |
| 0.1 | 0.5 | GO:0052655 | L-leucine transaminase activity(GO:0052654) L-valine transaminase activity(GO:0052655) L-isoleucine transaminase activity(GO:0052656) |
| 0.1 | 0.4 | GO:0010295 | (+)-abscisic acid 8'-hydroxylase activity(GO:0010295) |
| 0.1 | 0.3 | GO:0016041 | glutamate synthase (ferredoxin) activity(GO:0016041) oxidoreductase activity, acting on the CH-NH2 group of donors, iron-sulfur protein as acceptor(GO:0016643) |
| 0.1 | 0.4 | GO:1902417 | (+)-abscisic acid D-glucopyranosyl ester transmembrane transporter activity(GO:1902417) |
| 0.1 | 0.5 | GO:0004766 | spermidine synthase activity(GO:0004766) |
| 0.1 | 0.3 | GO:0004133 | glycogen debranching enzyme activity(GO:0004133) isoamylase activity(GO:0019156) |
| 0.1 | 0.3 | GO:0080116 | glucuronoxylan glucuronosyltransferase activity(GO:0080116) |
| 0.1 | 0.2 | GO:0045430 | chalcone isomerase activity(GO:0045430) |
| 0.1 | 0.6 | GO:1990538 | xylan O-acetyltransferase activity(GO:1990538) |
| 0.1 | 0.5 | GO:0015563 | allantoin uptake transmembrane transporter activity(GO:0005274) uracil:cation symporter activity(GO:0015505) uptake transmembrane transporter activity(GO:0015563) |
| 0.1 | 0.3 | GO:0016165 | linoleate 13S-lipoxygenase activity(GO:0016165) |
| 0.1 | 1.1 | GO:0004708 | MAP kinase kinase activity(GO:0004708) |
| 0.1 | 0.6 | GO:0047274 | galactinol-sucrose galactosyltransferase activity(GO:0047274) |
| 0.1 | 0.3 | GO:0047782 | coniferin beta-glucosidase activity(GO:0047782) |
| 0.1 | 2.2 | GO:0032934 | sterol binding(GO:0032934) |
| 0.1 | 1.0 | GO:0008061 | chitin binding(GO:0008061) |
| 0.1 | 0.2 | GO:0004424 | imidazoleglycerol-phosphate dehydratase activity(GO:0004424) |
| 0.1 | 1.3 | GO:0005372 | water transmembrane transporter activity(GO:0005372) water channel activity(GO:0015250) |
| 0.1 | 0.9 | GO:0031176 | endo-1,4-beta-xylanase activity(GO:0031176) |
| 0.1 | 0.3 | GO:0070818 | oxygen-dependent protoporphyrinogen oxidase activity(GO:0004729) protoporphyrinogen oxidase activity(GO:0070818) |
| 0.1 | 0.2 | GO:0047150 | S-adenosylmethionine-homocysteine S-methyltransferase activity(GO:0008898) betaine-homocysteine S-methyltransferase activity(GO:0047150) |
| 0.1 | 0.2 | GO:0070405 | phosphatidylcholine binding(GO:0031210) quaternary ammonium group binding(GO:0050997) ammonium ion binding(GO:0070405) |
| 0.1 | 0.3 | GO:0046577 | long-chain-alcohol oxidase activity(GO:0046577) |
| 0.1 | 0.5 | GO:0008239 | dipeptidyl-peptidase activity(GO:0008239) |
| 0.1 | 0.3 | GO:0015928 | fucosidase activity(GO:0015928) |
| 0.1 | 0.4 | GO:0003826 | alpha-ketoacid dehydrogenase activity(GO:0003826) |
| 0.1 | 0.4 | GO:0015189 | arginine transmembrane transporter activity(GO:0015181) L-lysine transmembrane transporter activity(GO:0015189) |
| 0.1 | 0.2 | GO:0003844 | 1,4-alpha-glucan branching enzyme activity(GO:0003844) |
| 0.1 | 1.7 | GO:0010427 | abscisic acid binding(GO:0010427) |
| 0.1 | 0.3 | GO:0047780 | citrate dehydratase activity(GO:0047780) |
| 0.1 | 0.4 | GO:0010178 | IAA-amino acid conjugate hydrolase activity(GO:0010178) |
| 0.1 | 1.9 | GO:0005179 | hormone activity(GO:0005179) |
| 0.1 | 0.2 | GO:0080132 | fatty acid alpha-hydroxylase activity(GO:0080132) |
| 0.1 | 0.7 | GO:0047631 | ADP-ribose diphosphatase activity(GO:0047631) |
| 0.1 | 0.2 | GO:0004106 | chorismate mutase activity(GO:0004106) |
| 0.1 | 0.2 | GO:0047443 | ribonuclease inhibitor activity(GO:0008428) 4-hydroxy-4-methyl-2-oxoglutarate aldolase activity(GO:0047443) |
| 0.1 | 0.2 | GO:0045140 | inositol phosphoceramide synthase activity(GO:0045140) |
| 0.1 | 1.3 | GO:0052716 | hydroquinone:oxygen oxidoreductase activity(GO:0052716) |
| 0.1 | 0.7 | GO:0016813 | hydrolase activity, acting on carbon-nitrogen (but not peptide) bonds, in linear amidines(GO:0016813) |
| 0.1 | 0.1 | GO:0005315 | inorganic phosphate transmembrane transporter activity(GO:0005315) |
| 0.1 | 0.3 | GO:0004333 | fumarate hydratase activity(GO:0004333) |
| 0.1 | 0.2 | GO:0004113 | cyclic-nucleotide phosphodiesterase activity(GO:0004112) 2',3'-cyclic-nucleotide 3'-phosphodiesterase activity(GO:0004113) |
| 0.1 | 0.5 | GO:0016713 | oxidoreductase activity, acting on paired donors, with incorporation or reduction of molecular oxygen, reduced iron-sulfur protein as one donor, and incorporation of one atom of oxygen(GO:0016713) |
| 0.1 | 0.2 | GO:0010354 | homogentisate prenyltransferase activity(GO:0010354) |
| 0.1 | 0.2 | GO:0103075 | indole-3-pyruvate monooxygenase activity(GO:0103075) |
| 0.1 | 0.4 | GO:0004383 | guanylate cyclase activity(GO:0004383) |
| 0.1 | 0.2 | GO:0047209 | coniferyl-alcohol glucosyltransferase activity(GO:0047209) |
| 0.1 | 0.2 | GO:0045485 | omega-6 fatty acid desaturase activity(GO:0045485) |
| 0.1 | 0.6 | GO:0045551 | cinnamyl-alcohol dehydrogenase activity(GO:0045551) |
| 0.1 | 0.5 | GO:0016833 | oxo-acid-lyase activity(GO:0016833) |
| 0.1 | 0.4 | GO:0016815 | nitrilase activity(GO:0000257) hydrolase activity, acting on carbon-nitrogen (but not peptide) bonds, in nitriles(GO:0016815) nitrile hydratase activity(GO:0018822) indole-3-acetonitrile nitrilase activity(GO:0080061) |
| 0.1 | 1.5 | GO:0000146 | microfilament motor activity(GO:0000146) actin-dependent ATPase activity(GO:0030898) |
| 0.1 | 1.3 | GO:0004565 | beta-galactosidase activity(GO:0004565) |
| 0.1 | 0.2 | GO:0052901 | spermine:oxygen oxidoreductase (spermidine-forming) activity(GO:0052901) |
| 0.1 | 0.2 | GO:0004819 | glutamine-tRNA ligase activity(GO:0004819) |
| 0.1 | 0.3 | GO:0003825 | alpha,alpha-trehalose-phosphate synthase (UDP-forming) activity(GO:0003825) |
| 0.0 | 0.2 | GO:0052740 | phosphatidylserine 1-acylhydrolase activity(GO:0052739) 1-acyl-2-lysophosphatidylserine acylhydrolase activity(GO:0052740) |
| 0.0 | 0.2 | GO:0052743 | inositol-polyphosphate 5-phosphatase activity(GO:0004445) inositol-1,3,4,5-tetrakisphosphate 5-phosphatase activity(GO:0052659) inositol tetrakisphosphate phosphatase activity(GO:0052743) |
| 0.0 | 0.2 | GO:0010285 | L,L-diaminopimelate aminotransferase activity(GO:0010285) |
| 0.0 | 0.1 | GO:0050263 | uridine nucleosidase activity(GO:0045437) ribosylpyrimidine nucleosidase activity(GO:0050263) |
| 0.0 | 0.5 | GO:0000990 | transcription factor activity, core RNA polymerase binding(GO:0000990) |
| 0.0 | 0.2 | GO:0004127 | cytidylate kinase activity(GO:0004127) |
| 0.0 | 0.1 | GO:0005094 | Rho GDP-dissociation inhibitor activity(GO:0005094) |
| 0.0 | 0.1 | GO:0033984 | indole-3-glycerol-phosphate lyase activity(GO:0033984) |
| 0.0 | 0.8 | GO:0017025 | TBP-class protein binding(GO:0017025) |
| 0.0 | 0.1 | GO:0080104 | 3-methylthiopropyl glucosinolate S-oxygenase activity(GO:0080102) 5-methylthiopropyl glucosinolate S-oxygenase activity(GO:0080104) 7-methylthiopropyl glucosinolate S-oxygenase activity(GO:0080106) |
| 0.0 | 0.6 | GO:0080019 | fatty-acyl-CoA reductase (alcohol-forming) activity(GO:0080019) |
| 0.0 | 0.5 | GO:0016730 | oxidoreductase activity, acting on iron-sulfur proteins as donors(GO:0016730) |
| 0.0 | 0.2 | GO:0016756 | glutathione gamma-glutamylcysteinyltransferase activity(GO:0016756) |
| 0.0 | 0.2 | GO:0008113 | peptide-methionine (S)-S-oxide reductase activity(GO:0008113) L-methionine:thioredoxin-disulfide S-oxidoreductase activity(GO:0033744) L-methionine-(S)-S-oxide reductase activity(GO:0036456) |
| 0.0 | 0.2 | GO:0003871 | 5-methyltetrahydropteroyltriglutamate-homocysteine S-methyltransferase activity(GO:0003871) methionine synthase activity(GO:0008705) 5-methyltetrahydrofolate-dependent methyltransferase activity(GO:0042084) 5-methyltetrahydropteroyltri-L-glutamate-dependent methyltransferase activity(GO:0042085) |
| 0.0 | 0.7 | GO:0016702 | oxidoreductase activity, acting on single donors with incorporation of molecular oxygen, incorporation of two atoms of oxygen(GO:0016702) |
| 0.0 | 0.3 | GO:0030527 | structural constituent of chromatin(GO:0030527) |
| 0.0 | 0.2 | GO:0030371 | translation repressor activity(GO:0030371) |
| 0.0 | 0.4 | GO:0004806 | triglyceride lipase activity(GO:0004806) |
| 0.0 | 0.3 | GO:0017108 | 5'-flap endonuclease activity(GO:0017108) |
| 0.0 | 0.3 | GO:0016421 | CoA carboxylase activity(GO:0016421) ligase activity, forming carbon-carbon bonds(GO:0016885) |
| 0.0 | 1.1 | GO:0010333 | terpene synthase activity(GO:0010333) |
| 0.0 | 0.2 | GO:0015172 | acidic amino acid transmembrane transporter activity(GO:0015172) |
| 0.0 | 0.2 | GO:0005365 | myo-inositol transmembrane transporter activity(GO:0005365) myo-inositol:proton symporter activity(GO:0005366) polyol transmembrane transporter activity(GO:0015166) |
| 0.0 | 0.1 | GO:0047364 | desulfoglucosinolate sulfotransferase activity(GO:0047364) |
| 0.0 | 0.4 | GO:0047134 | protein-disulfide reductase activity(GO:0047134) |
| 0.0 | 0.1 | GO:0008534 | oxidized purine nucleobase lesion DNA N-glycosylase activity(GO:0008534) |
| 0.0 | 0.7 | GO:0008417 | fucosyltransferase activity(GO:0008417) |
| 0.0 | 0.7 | GO:0015174 | basic amino acid transmembrane transporter activity(GO:0015174) |
| 0.0 | 0.1 | GO:0008821 | crossover junction endodeoxyribonuclease activity(GO:0008821) |
| 0.0 | 0.1 | GO:0004044 | amidophosphoribosyltransferase activity(GO:0004044) |
| 0.0 | 0.3 | GO:0052853 | very-long-chain-(S)-2-hydroxy-acid oxidase activity(GO:0052852) long-chain-(S)-2-hydroxy-long-chain-acid oxidase activity(GO:0052853) medium-chain-(S)-2-hydroxy-acid oxidase activity(GO:0052854) |
| 0.0 | 0.9 | GO:0000250 | lanosterol synthase activity(GO:0000250) oxidosqualene cyclase activity(GO:0031559) |
| 0.0 | 0.1 | GO:0015292 | uniporter activity(GO:0015292) |
| 0.0 | 0.7 | GO:0008106 | alcohol dehydrogenase (NADP+) activity(GO:0008106) |
| 0.0 | 0.1 | GO:0008661 | 1-deoxy-D-xylulose-5-phosphate synthase activity(GO:0008661) |
| 0.0 | 0.1 | GO:0000225 | N-acetylglucosaminylphosphatidylinositol deacetylase activity(GO:0000225) |
| 0.0 | 0.4 | GO:0003886 | DNA (cytosine-5-)-methyltransferase activity(GO:0003886) |
| 0.0 | 0.7 | GO:0043295 | glutathione binding(GO:0043295) oligopeptide binding(GO:1900750) |
| 0.0 | 0.3 | GO:0042887 | amide transmembrane transporter activity(GO:0042887) |
| 0.0 | 0.6 | GO:0047196 | long-chain-alcohol O-fatty-acyltransferase activity(GO:0047196) |
| 0.0 | 0.3 | GO:0003906 | DNA-(apurinic or apyrimidinic site) lyase activity(GO:0003906) |
| 0.0 | 0.2 | GO:0045544 | gibberellin 20-oxidase activity(GO:0045544) |
| 0.0 | 0.1 | GO:0047874 | dolichyldiphosphatase activity(GO:0047874) |
| 0.0 | 0.4 | GO:0016832 | aldehyde-lyase activity(GO:0016832) |
| 0.0 | 0.4 | GO:0016847 | 1-aminocyclopropane-1-carboxylate synthase activity(GO:0016847) |
| 0.0 | 0.3 | GO:0004020 | adenylylsulfate kinase activity(GO:0004020) |
| 0.0 | 0.1 | GO:0043812 | phosphatidylinositol phosphate 4-phosphatase activity(GO:0034596) phosphatidylinositol-4-phosphate phosphatase activity(GO:0043812) |
| 0.0 | 2.3 | GO:0015144 | carbohydrate transmembrane transporter activity(GO:0015144) |
| 0.0 | 0.2 | GO:0017057 | 6-phosphogluconolactonase activity(GO:0017057) |
| 0.0 | 0.2 | GO:0019825 | oxygen binding(GO:0019825) |
| 0.0 | 0.5 | GO:0015020 | glucuronosyltransferase activity(GO:0015020) |
| 0.0 | 0.1 | GO:0033925 | mannosyl-glycoprotein endo-beta-N-acetylglucosaminidase activity(GO:0033925) |
| 0.0 | 0.1 | GO:0004484 | mRNA guanylyltransferase activity(GO:0004484) polynucleotide 5'-phosphatase activity(GO:0004651) RNA guanylyltransferase activity(GO:0008192) polynucleotide phosphatase activity(GO:0098518) |
| 0.0 | 0.7 | GO:0042973 | glucan endo-1,3-beta-D-glucosidase activity(GO:0042973) |
| 0.0 | 0.1 | GO:0008297 | single-stranded DNA exodeoxyribonuclease activity(GO:0008297) |
| 0.0 | 0.1 | GO:0016842 | amidine-lyase activity(GO:0016842) |
| 0.0 | 0.2 | GO:0031956 | medium-chain fatty acid-CoA ligase activity(GO:0031956) |
| 0.0 | 0.3 | GO:0003955 | NAD(P)H dehydrogenase (quinone) activity(GO:0003955) |
| 0.0 | 0.1 | GO:0003919 | FMN adenylyltransferase activity(GO:0003919) |
| 0.0 | 0.1 | GO:0008963 | phospho-N-acetylmuramoyl-pentapeptide-transferase activity(GO:0008963) |
| 0.0 | 0.2 | GO:0009916 | alternative oxidase activity(GO:0009916) |
| 0.0 | 0.1 | GO:0004473 | malate dehydrogenase (decarboxylating) (NADP+) activity(GO:0004473) |
| 0.0 | 2.0 | GO:0046910 | pectinesterase inhibitor activity(GO:0046910) |
| 0.0 | 0.6 | GO:0004499 | N,N-dimethylaniline monooxygenase activity(GO:0004499) |
| 0.0 | 0.2 | GO:0005483 | soluble NSF attachment protein activity(GO:0005483) |
| 0.0 | 0.8 | GO:0008810 | cellulase activity(GO:0008810) |
| 0.0 | 0.5 | GO:0005504 | fatty acid binding(GO:0005504) |
| 0.0 | 0.3 | GO:0017136 | NAD-dependent histone deacetylase activity(GO:0017136) histone deacetylase activity (H3-K14 specific)(GO:0031078) NAD-dependent histone deacetylase activity (H3-K14 specific)(GO:0032041) NAD-dependent protein deacetylase activity(GO:0034979) |
| 0.0 | 0.2 | GO:0003909 | DNA ligase activity(GO:0003909) DNA ligase (ATP) activity(GO:0003910) ligase activity, forming phosphoric ester bonds(GO:0016886) |
| 0.0 | 0.2 | GO:0019139 | cytokinin dehydrogenase activity(GO:0019139) |
| 0.0 | 1.0 | GO:0044390 | ubiquitin-like protein conjugating enzyme binding(GO:0044390) |
| 0.0 | 0.2 | GO:0030332 | cyclin binding(GO:0030332) |
| 0.0 | 0.3 | GO:0016161 | beta-amylase activity(GO:0016161) |
| 0.0 | 0.2 | GO:0010294 | abscisic acid glucosyltransferase activity(GO:0010294) |
| 0.0 | 0.1 | GO:0015116 | sulfate transmembrane transporter activity(GO:0015116) |
| 0.0 | 0.6 | GO:0005345 | purine nucleobase transmembrane transporter activity(GO:0005345) |
| 0.0 | 0.2 | GO:0000254 | C-4 methylsterol oxidase activity(GO:0000254) |
| 0.0 | 1.1 | GO:0004364 | glutathione transferase activity(GO:0004364) |
| 0.0 | 0.1 | GO:0019166 | trans-2-enoyl-CoA reductase (NADPH) activity(GO:0019166) |
| 0.0 | 2.7 | GO:0000977 | RNA polymerase II regulatory region sequence-specific DNA binding(GO:0000977) RNA polymerase II regulatory region DNA binding(GO:0001012) |
| 0.0 | 0.1 | GO:0000009 | alpha-1,6-mannosyltransferase activity(GO:0000009) |
| 0.0 | 4.0 | GO:0001159 | core promoter proximal region sequence-specific DNA binding(GO:0000987) core promoter proximal region DNA binding(GO:0001159) |
| 0.0 | 0.3 | GO:0050373 | UDP-arabinose 4-epimerase activity(GO:0050373) |
| 0.0 | 0.1 | GO:0030742 | GTP-dependent protein binding(GO:0030742) |
| 0.0 | 0.0 | GO:0048256 | flap endonuclease activity(GO:0048256) |
| 0.0 | 0.1 | GO:0008442 | 3-hydroxyisobutyrate dehydrogenase activity(GO:0008442) |
| 0.0 | 0.5 | GO:0008327 | methyl-CpG binding(GO:0008327) |
| 0.0 | 0.1 | GO:0004813 | alanine-tRNA ligase activity(GO:0004813) |
| 0.0 | 0.2 | GO:0003988 | acetyl-CoA C-acyltransferase activity(GO:0003988) |
| 0.0 | 0.1 | GO:0031071 | cysteine desulfurase activity(GO:0031071) |
| 0.0 | 0.0 | GO:0015377 | cation:chloride symporter activity(GO:0015377) |
| 0.0 | 0.1 | GO:0035175 | histone serine kinase activity(GO:0035174) histone kinase activity (H3-S10 specific)(GO:0035175) |
| 0.0 | 0.1 | GO:0003848 | 2-amino-4-hydroxy-6-hydroxymethyldihydropteridine diphosphokinase activity(GO:0003848) dihydropteroate synthase activity(GO:0004156) |
| 0.0 | 0.8 | GO:0016413 | O-acetyltransferase activity(GO:0016413) |
| 0.0 | 0.2 | GO:0004715 | non-membrane spanning protein tyrosine kinase activity(GO:0004715) |
| 0.0 | 0.1 | GO:0016855 | racemase and epimerase activity, acting on amino acids and derivatives(GO:0016855) racemase activity, acting on amino acids and derivatives(GO:0036361) amino-acid racemase activity(GO:0047661) |
| 0.0 | 0.1 | GO:0016767 | geranylgeranyl-diphosphate geranylgeranyltransferase activity(GO:0016767) |
| 0.0 | 0.4 | GO:0030599 | pectinesterase activity(GO:0030599) |
| 0.0 | 0.1 | GO:0004679 | AMP-activated protein kinase activity(GO:0004679) |
| 0.0 | 0.1 | GO:0015140 | malate transmembrane transporter activity(GO:0015140) |
| 0.0 | 0.1 | GO:0008703 | 5-amino-6-(5-phosphoribosylamino)uracil reductase activity(GO:0008703) |
| 0.0 | 0.1 | GO:0047334 | diphosphate-fructose-6-phosphate 1-phosphotransferase activity(GO:0047334) |
| 0.0 | 0.3 | GO:0008420 | CTD phosphatase activity(GO:0008420) |
| 0.0 | 0.2 | GO:0003950 | NAD+ ADP-ribosyltransferase activity(GO:0003950) |
| 0.0 | 0.1 | GO:0008728 | GTP diphosphokinase activity(GO:0008728) |
| 0.0 | 0.2 | GO:0002094 | polyprenyltransferase activity(GO:0002094) |
| 0.0 | 0.1 | GO:0016744 | transferase activity, transferring aldehyde or ketonic groups(GO:0016744) |
| 0.0 | 0.2 | GO:0008146 | sulfotransferase activity(GO:0008146) |
| 0.0 | 0.1 | GO:0004582 | dolichyl-phosphate beta-D-mannosyltransferase activity(GO:0004582) |
| 0.0 | 0.3 | GO:0004805 | trehalose-phosphatase activity(GO:0004805) |
| 0.0 | 0.1 | GO:0010313 | phytochrome binding(GO:0010313) |
| 0.0 | 0.0 | GO:0008948 | malic enzyme activity(GO:0004470) malate dehydrogenase (decarboxylating) (NAD+) activity(GO:0004471) oxaloacetate decarboxylase activity(GO:0008948) |
| 0.0 | 0.0 | GO:0036310 | annealing helicase activity(GO:0036310) |
| 0.0 | 0.1 | GO:0019534 | tetracycline transporter activity(GO:0008493) toxin transporter activity(GO:0019534) antibiotic transporter activity(GO:0042895) |
| 0.0 | 1.4 | GO:0016709 | oxidoreductase activity, acting on paired donors, with incorporation or reduction of molecular oxygen, NAD(P)H as one donor, and incorporation of one atom of oxygen(GO:0016709) |
| 0.0 | 0.1 | GO:0016436 | rRNA (uridine) methyltransferase activity(GO:0016436) rRNA (uridine-N3-)-methyltransferase activity(GO:0070042) |
| 0.0 | 0.2 | GO:0030983 | mismatched DNA binding(GO:0030983) |
| 0.0 | 0.1 | GO:0016782 | transferase activity, transferring sulfur-containing groups(GO:0016782) |
| 0.0 | 0.1 | GO:0016688 | L-ascorbate peroxidase activity(GO:0016688) |
| 0.0 | 0.6 | GO:0003714 | transcription corepressor activity(GO:0003714) |
| 0.0 | 0.3 | GO:0016645 | oxidoreductase activity, acting on the CH-NH group of donors(GO:0016645) |
| 0.0 | 0.1 | GO:0004605 | phosphatidate cytidylyltransferase activity(GO:0004605) |
| 0.0 | 0.1 | GO:0003860 | 3-hydroxyisobutyryl-CoA hydrolase activity(GO:0003860) |
| 0.0 | 0.1 | GO:0051747 | cytosine C-5 DNA demethylase activity(GO:0051747) |
| 0.0 | 0.7 | GO:0005484 | SNAP receptor activity(GO:0005484) |
| 0.0 | 0.2 | GO:0008138 | protein tyrosine/serine/threonine phosphatase activity(GO:0008138) |
| 0.0 | 0.1 | GO:0033836 | flavonol 7-O-beta-glucosyltransferase activity(GO:0033836) |
| 0.0 | 0.1 | GO:0008878 | glucose-1-phosphate adenylyltransferase activity(GO:0008878) |
| 0.0 | 0.1 | GO:0046509 | 1,2-diacylglycerol 3-beta-galactosyltransferase activity(GO:0046509) |
| 0.0 | 0.1 | GO:0047372 | acylglycerol lipase activity(GO:0047372) |
| 0.0 | 0.0 | GO:0004834 | tryptophan synthase activity(GO:0004834) |
| 0.0 | 0.3 | GO:0017069 | snRNA binding(GO:0017069) |
| 0.0 | 0.2 | GO:0004124 | cysteine synthase activity(GO:0004124) |
| 0.0 | 0.3 | GO:0097602 | cullin family protein binding(GO:0097602) |
| 0.0 | 0.6 | GO:0070001 | aspartic-type peptidase activity(GO:0070001) |
| 0.0 | 0.1 | GO:0004765 | shikimate kinase activity(GO:0004765) |
| 0.0 | 0.2 | GO:0070063 | RNA polymerase binding(GO:0070063) |
| 0.0 | 0.1 | GO:0017112 | Rab guanyl-nucleotide exchange factor activity(GO:0017112) |
| 0.0 | 0.0 | GO:0016618 | hydroxypyruvate reductase activity(GO:0016618) |
| 0.0 | 0.1 | GO:0005049 | nuclear export signal receptor activity(GO:0005049) |
| 0.0 | 0.1 | GO:0003987 | acetate-CoA ligase activity(GO:0003987) |
| 0.0 | 0.0 | GO:0002151 | G-quadruplex RNA binding(GO:0002151) |
Gene overrepresentation in curated gene sets: canonical pathways category:
| Log-likelihood per target | Total log-likelihood | Term | Description |
|---|---|---|---|
| 0.3 | 0.8 | PID AURORA A PATHWAY | Aurora A signaling |
| 0.2 | 0.5 | SA CASPASE CASCADE | Apoptosis is mediated by caspases, cysteine proteases arranged in a proteolytic cascade. |
| 0.1 | 0.6 | PID VEGF VEGFR PATHWAY | VEGF and VEGFR signaling network |
| 0.1 | 0.8 | NABA MATRISOME ASSOCIATED | Ensemble of genes encoding ECM-associated proteins including ECM-affilaited proteins, ECM regulators and secreted factors |
| 0.1 | 0.2 | PID IL12 2PATHWAY | IL12-mediated signaling events |
| 0.1 | 0.1 | PID AMB2 NEUTROPHILS PATHWAY | amb2 Integrin signaling |
| 0.1 | 0.1 | PID MTOR 4PATHWAY | mTOR signaling pathway |
| 0.1 | 0.1 | PID NOTCH PATHWAY | Notch signaling pathway |
| 0.1 | 0.1 | PID IL8 CXCR2 PATHWAY | IL8- and CXCR2-mediated signaling events |
| 0.0 | 0.2 | PID HIF1A PATHWAY | Hypoxic and oxygen homeostasis regulation of HIF-1-alpha |
| 0.0 | 0.2 | PID ATM PATHWAY | ATM pathway |
| 0.0 | 0.3 | PID E2F PATHWAY | E2F transcription factor network |
| 0.0 | 0.1 | SA G1 AND S PHASES | Cdk2, 4, and 6 bind cyclin D in G1, while cdk2/cyclin E promotes the G1/S transition. |
| 0.0 | 0.1 | PID P38 ALPHA BETA DOWNSTREAM PATHWAY | Signaling mediated by p38-alpha and p38-beta |
| 0.0 | 0.0 | PID TAP63 PATHWAY | Validated transcriptional targets of TAp63 isoforms |
| 0.0 | 0.1 | ST WNT BETA CATENIN PATHWAY | Wnt/beta-catenin Pathway |
| 0.0 | 0.0 | PID ARF 3PATHWAY | Arf1 pathway |
Gene overrepresentation in curated gene sets: REACTOME pathways category:
| Log-likelihood per target | Total log-likelihood | Term | Description |
|---|---|---|---|
| 0.2 | 0.5 | REACTOME SEMAPHORIN INTERACTIONS | Genes involved in Semaphorin interactions |
| 0.1 | 0.4 | REACTOME APOPTOTIC EXECUTION PHASE | Genes involved in Apoptotic execution phase |
| 0.1 | 0.4 | REACTOME FORMATION OF TUBULIN FOLDING INTERMEDIATES BY CCT TRIC | Genes involved in Formation of tubulin folding intermediates by CCT/TriC |
| 0.1 | 0.1 | REACTOME SIGNALING BY NOTCH1 | Genes involved in Signaling by NOTCH1 |
| 0.1 | 0.3 | REACTOME AMINO ACID SYNTHESIS AND INTERCONVERSION TRANSAMINATION | Genes involved in Amino acid synthesis and interconversion (transamination) |
| 0.1 | 0.7 | REACTOME G0 AND EARLY G1 | Genes involved in G0 and Early G1 |
| 0.1 | 0.8 | REACTOME CHEMOKINE RECEPTORS BIND CHEMOKINES | Genes involved in Chemokine receptors bind chemokines |
| 0.1 | 0.2 | REACTOME OXYGEN DEPENDENT PROLINE HYDROXYLATION OF HYPOXIA INDUCIBLE FACTOR ALPHA | Genes involved in Oxygen-dependent Proline Hydroxylation of Hypoxia-inducible Factor Alpha |
| 0.1 | 0.1 | REACTOME SYNTHESIS OF PIPS AT THE GOLGI MEMBRANE | Genes involved in Synthesis of PIPs at the Golgi membrane |
| 0.0 | 0.6 | REACTOME MEIOTIC RECOMBINATION | Genes involved in Meiotic Recombination |
| 0.0 | 0.3 | REACTOME GENERIC TRANSCRIPTION PATHWAY | Genes involved in Generic Transcription Pathway |
| 0.0 | 0.2 | REACTOME INNATE IMMUNE SYSTEM | Genes involved in Innate Immune System |
| 0.0 | 0.1 | REACTOME MITOTIC PROMETAPHASE | Genes involved in Mitotic Prometaphase |
| 0.0 | 0.1 | REACTOME VEGF LIGAND RECEPTOR INTERACTIONS | Genes involved in VEGF ligand-receptor interactions |
| 0.0 | 0.2 | REACTOME E2F ENABLED INHIBITION OF PRE REPLICATION COMPLEX FORMATION | Genes involved in E2F-enabled inhibition of pre-replication complex formation |
| 0.0 | 0.1 | REACTOME GLYCEROPHOSPHOLIPID BIOSYNTHESIS | Genes involved in Glycerophospholipid biosynthesis |
| 0.0 | 0.0 | REACTOME COPI MEDIATED TRANSPORT | Genes involved in COPI Mediated Transport |