Project
GSE130291:vernalization in Arabidopsis thaliana
Navigation
Downloads
Results for AT3G04030
Z-value: 2.01
Transcription factors associated with AT3G04030
| Gene Symbol | Gene ID | Gene Info |
|---|---|---|
|
AT3G04030
|
AT3G04030 | Homeodomain-like superfamily protein |
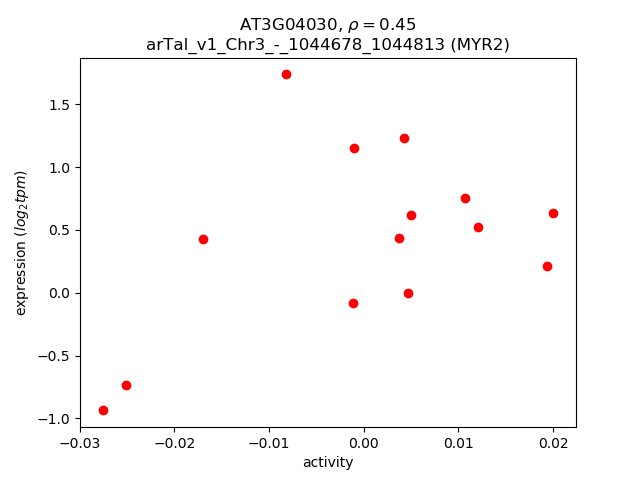
Activity-expression correlation:
| Gene | Promoter | Pearson corr. coef. | P-value | Plot |
|---|---|---|---|---|
| MYR2 | arTal_v1_Chr3_-_1044678_1044813 | 0.45 | 1.0e-01 | Click! |
Activity profile of AT3G04030 motif
Sorted Z-values of AT3G04030 motif
| Promoter | Log-likelihood | Transcript | Gene | Gene Info |
|---|---|---|---|---|
| arTal_v1_Chr1_+_28975255_28975255 | 4.26 |
AT1G77120.1
|
ADH1
|
alcohol dehydrogenase 1 |
| arTal_v1_Chr3_+_4104463_4104463 | 3.66 |
AT3G12900.1
|
AT3G12900
|
2-oxoglutarate (2OG) and Fe(II)-dependent oxygenase superfamily protein |
| arTal_v1_Chr5_-_14753088_14753088 | 3.45 |
AT5G37260.1
|
RVE2
|
Homeodomain-like superfamily protein |
| arTal_v1_Chr5_+_21240717_21240717 | 3.27 |
AT5G52310.1
|
LTI78
|
low-temperature-responsive protein 78 (LTI78) / desiccation-responsive protein 29A (RD29A) |
| arTal_v1_Chr4_+_10707344_10707378 | 3.23 |
AT4G19690.2
AT4G19690.1 |
IRT1
|
iron-regulated transporter 1 |
| arTal_v1_Chr1_+_3019639_3019639 | 3.21 |
AT1G09350.1
|
GolS3
|
galactinol synthase 3 |
| arTal_v1_Chr5_+_5206156_5206156 | 3.19 |
AT5G15950.2
|
AT5G15950
|
Adenosylmethionine decarboxylase family protein |
| arTal_v1_Chr5_+_5205869_5205869 | 3.19 |
AT5G15950.1
|
AT5G15950
|
Adenosylmethionine decarboxylase family protein |
| arTal_v1_Chr5_-_22712441_22712441 | 3.18 |
AT5G56080.1
|
NAS2
|
nicotianamine synthase 2 |
| arTal_v1_Chr1_+_3020221_3020221 | 2.98 |
AT1G09350.2
|
GolS3
|
galactinol synthase 3 |
| arTal_v1_Chr4_-_15954803_15954803 | 2.96 |
AT4G33070.1
|
AT4G33070
|
Thiamine pyrophosphate dependent pyruvate decarboxylase family protein |
| arTal_v1_Chr3_-_82182_82182 | 2.57 |
AT3G01260.1
|
AT3G01260
|
Galactose mutarotase-like superfamily protein |
| arTal_v1_Chr3_+_20612693_20612693 | 2.54 |
AT3G55580.1
|
AT3G55580
|
Regulator of chromosome condensation (RCC1) family protein |
| arTal_v1_Chr1_-_10164452_10164452 | 2.53 |
AT1G29090.1
|
AT1G29090
|
Cysteine proteinases superfamily protein |
| arTal_v1_Chr2_+_12004658_12004700 | 2.52 |
AT2G28160.1
AT2G28160.2 |
FRU
|
FER-like regulator of iron uptake |
| arTal_v1_Chr4_-_18472048_18472048 | 2.43 |
AT4G39800.1
|
MIPS1
|
myo-inositol-1-phosphate synthase 1 |
| arTal_v1_Chr5_-_18189523_18189523 | 2.40 |
AT5G45070.1
|
PP2-A8
|
phloem protein 2-A8 |
| arTal_v1_Chr3_-_21085245_21085245 | 2.38 |
AT3G56970.1
|
bHLH38
|
basic helix-loop-helix (bHLH) DNA-binding superfamily protein |
| arTal_v1_Chr3_+_2465235_2465235 | 2.37 |
AT3G07720.1
|
AT3G07720
|
Galactose oxidase/kelch repeat superfamily protein |
| arTal_v1_Chr4_+_8827600_8827710 | 2.33 |
AT4G15430.2
AT4G15430.1 |
AT4G15430
|
ERD (early-responsive to dehydration stress) family protein |
| arTal_v1_Chr1_-_9275193_9275193 | 2.31 |
AT1G26790.1
|
AT1G26790
|
Dof-type zinc finger DNA-binding family protein |
| arTal_v1_Chr1_-_37757_37871 | 2.20 |
AT1G01060.3
AT1G01060.2 AT1G01060.4 AT1G01060.1 AT1G01060.6 AT1G01060.7 AT1G01060.5 |
LHY
|
Homeodomain-like superfamily protein |
| arTal_v1_Chr3_+_5025383_5025383 | 2.20 |
AT3G14940.2
|
PPC3
|
phosphoenolpyruvate carboxylase 3 |
| arTal_v1_Chr3_+_5025184_5025184 | 2.17 |
AT3G14940.1
|
PPC3
|
phosphoenolpyruvate carboxylase 3 |
| arTal_v1_Chr2_+_19245591_19245684 | 2.12 |
AT2G46830.1
AT2G46830.2 |
CCA1
|
circadian clock associated 1 |
| arTal_v1_Chr1_-_1248826_1248876 | 2.04 |
AT1G04570.2
AT1G04570.1 |
AT1G04570
|
Major facilitator superfamily protein |
| arTal_v1_Chr3_-_8085669_8085669 | 1.95 |
AT3G22840.1
|
ELIP1
|
Chlorophyll A-B binding family protein |
| arTal_v1_Chr2_+_19246681_19246681 | 1.94 |
AT2G46830.3
|
CCA1
|
circadian clock associated 1 |
| arTal_v1_Chr5_-_7054281_7054281 | 1.94 |
AT5G20830.3
|
SUS1
|
sucrose synthase 1 |
| arTal_v1_Chr5_-_4620551_4620551 | 1.93 |
AT5G14330.1
|
AT5G14330
|
transmembrane protein |
| arTal_v1_Chr5_-_7054713_7054713 | 1.90 |
AT5G20830.1
|
SUS1
|
sucrose synthase 1 |
| arTal_v1_Chr2_-_12343443_12343443 | 1.88 |
AT2G28780.1
|
AT2G28780
|
P-hydroxybenzoic acid efflux pump subunit |
| arTal_v1_Chr3_+_19825267_19825267 | 1.87 |
AT3G53480.1
|
ABCG37
|
pleiotropic drug resistance 9 |
| arTal_v1_Chr3_+_4449259_4449259 | 1.87 |
AT3G13610.1
|
AT3G13610
|
2-oxoglutarate (2OG) and Fe(II)-dependent oxygenase superfamily protein |
| arTal_v1_Chr5_-_7055398_7055398 | 1.85 |
AT5G20830.2
|
SUS1
|
sucrose synthase 1 |
| arTal_v1_Chr5_+_15878698_15878726 | 1.83 |
AT5G39660.1
AT5G39660.3 AT5G39660.2 |
CDF2
|
cycling DOF factor 2 |
| arTal_v1_Chr2_+_13987669_13987669 | 1.81 |
AT2G32960.1
|
PFA-DSP2
|
Phosphotyrosine protein phosphatases superfamily protein |
| arTal_v1_Chr1_-_26163715_26163715 | 1.80 |
AT1G69570.1
|
AT1G69570
|
Dof-type zinc finger DNA-binding family protein |
| arTal_v1_Chr5_+_20151163_20151163 | 1.79 |
AT5G49640.1
|
AT5G49640
|
hypothetical protein |
| arTal_v1_Chr5_+_3347381_3347437 | 1.78 |
AT5G10580.3
AT5G10580.4 AT5G10580.1 AT5G10580.2 |
AT5G10580
|
plant/protein (Protein of unknown function, DUF599) |
| arTal_v1_Chr2_+_13381767_13381767 | 1.73 |
AT2G31380.1
|
STH
|
salt tolerance homologue |
| arTal_v1_Chr4_-_9844290_9844334 | 1.73 |
AT4G17680.3
AT4G17680.2 AT4G17680.1 |
AT4G17680
|
SBP (S-ribonuclease binding protein) family protein |
| arTal_v1_Chr1_-_3167924_3167924 | 1.72 |
AT1G09780.1
|
iPGAM1
|
Phosphoglycerate mutase, 2,3-bisphosphoglycerate-independent |
| arTal_v1_Chr4_-_18551183_18551183 | 1.69 |
AT4G40010.1
|
SNRK2.7
|
SNF1-related protein kinase 2.7 |
| arTal_v1_Chr1_-_28094915_28094956 | 1.69 |
AT1G74770.2
AT1G74770.1 |
AT1G74770
|
zinc ion binding protein |
| arTal_v1_Chr1_-_18238497_18238497 | 1.67 |
AT1G49310.1
|
AT1G49310
|
transmembrane protein |
| arTal_v1_Chr5_-_6976036_6976036 | 1.67 |
AT5G20630.1
|
GER3
|
germin 3 |
| arTal_v1_Chr4_-_7406994_7406994 | 1.66 |
AT4G12480.1
|
EARLI1
|
Bifunctional inhibitor/lipid-transfer protein/seed storage 2S albumin superfamily protein |
| arTal_v1_Chr3_-_2569700_2569700 | 1.66 |
AT3G08040.2
AT3G08040.1 |
FRD3
|
MATE efflux family protein |
| arTal_v1_Chr2_-_19370478_19370478 | 1.65 |
AT2G47180.1
|
GolS1
|
galactinol synthase 1 |
| arTal_v1_Chr4_+_8646150_8646150 | 1.64 |
AT4G15160.2
AT4G15160.1 |
AT4G15160
|
Bifunctional inhibitor/lipid-transfer protein/seed storage 2S albumin superfamily protein |
| arTal_v1_Chr4_+_11182092_11182092 | 1.64 |
AT4G20890.1
|
TUB9
|
tubulin beta-9 chain |
| arTal_v1_Chr2_-_12415661_12415661 | 1.62 |
AT2G28900.1
|
OEP16-1
|
outer plastid envelope protein 16-1 |
| arTal_v1_Chr5_+_630748_630876 | 1.61 |
AT5G02780.1
AT5G02780.3 AT5G02780.2 |
GSTL1
|
glutathione transferase lambda 1 |
| arTal_v1_Chr3_+_8172479_8172479 | 1.60 |
AT3G23000.1
|
CIPK7
|
CBL-interacting protein kinase 7 |
| arTal_v1_Chr5_+_2866222_2866222 | 1.59 |
AT5G09220.1
|
AAP2
|
amino acid permease 2 |
| arTal_v1_Chr1_+_28498821_28498821 | 1.58 |
AT1G75900.1
|
AT1G75900
|
GDSL-like Lipase/Acylhydrolase superfamily protein |
| arTal_v1_Chr3_+_7673276_7673276 | 1.58 |
AT3G21770.1
|
AT3G21770
|
Peroxidase superfamily protein |
| arTal_v1_Chr1_-_30186716_30186716 | 1.57 |
AT1G80280.1
|
AT1G80280
|
alpha/beta-Hydrolases superfamily protein |
| arTal_v1_Chr4_-_810574_810611 | 1.56 |
AT4G01870.1
AT4G01870.2 |
AT4G01870
|
tolB protein-like protein |
| arTal_v1_Chr3_-_23195917_23195917 | 1.56 |
AT3G62700.1
|
ABCC14
|
multidrug resistance-associated protein 10 |
| arTal_v1_Chr5_-_17755742_17755768 | 1.54 |
AT5G44110.2
AT5G44110.4 AT5G44110.3 AT5G44110.1 |
ABCI21
|
P-loop containing nucleoside triphosphate hydrolases superfamily protein |
| arTal_v1_Chr5_+_17937622_17937622 | 1.54 |
AT5G44530.3
AT5G44530.2 AT5G44530.1 |
AT5G44530
|
Subtilase family protein |
| arTal_v1_Chr5_+_18791575_18791575 | 1.53 |
AT5G46330.1
AT5G46330.2 |
FLS2
|
Leucine-rich receptor-like protein kinase family protein |
| arTal_v1_Chr2_+_10244745_10244745 | 1.52 |
AT2G24100.1
|
ASG1
|
ATP-dependent DNA helicase |
| arTal_v1_Chr3_-_17475274_17475274 | 1.51 |
AT3G47420.3
AT3G47420.1 AT3G47420.2 |
G3Pp1
|
putative glycerol-3-phosphate transporter 1 |
| arTal_v1_Chr4_-_9583290_9583290 | 1.51 |
AT4G17030.1
|
EXLB1
|
expansin-like B1 |
| arTal_v1_Chr5_+_22721373_22721373 | 1.51 |
AT5G56120.1
|
AT5G56120
|
RNA polymerase II elongation factor |
| arTal_v1_Chr1_-_507268_507268 | 1.50 |
AT1G02460.1
|
AT1G02460
|
Pectin lyase-like superfamily protein |
| arTal_v1_Chr1_+_18035967_18035967 | 1.48 |
AT1G48750.1
|
AT1G48750
|
Bifunctional inhibitor/lipid-transfer protein/seed storage 2S albumin superfamily protein |
| arTal_v1_Chr1_+_7404328_7404328 | 1.48 |
AT1G21140.1
|
AT1G21140
|
Vacuolar iron transporter (VIT) family protein |
| arTal_v1_Chr5_-_5177897_5177897 | 1.48 |
AT5G15850.1
|
COL1
|
CONSTANS-like 1 |
| arTal_v1_Chr4_-_13019400_13019400 | 1.47 |
AT4G25480.1
|
DREB1A
|
dehydration response element B1A |
| arTal_v1_Chr1_-_8189220_8189234 | 1.46 |
AT1G23090.4
AT1G23090.1 AT1G23090.3 AT1G23090.2 |
AST91
|
sulfate transporter 91 |
| arTal_v1_Chr1_+_25508639_25508639 | 1.45 |
AT1G68050.1
|
FKF1
|
flavin-binding, kelch repeat, f box 1 |
| arTal_v1_Chr5_+_21771811_21771811 | 1.45 |
AT5G53590.1
|
AT5G53590
|
SAUR-like auxin-responsive protein family |
| arTal_v1_Chr5_+_25756272_25756272 | 1.44 |
AT5G64420.1
|
AT5G64420
|
DNA polymerase V family |
| arTal_v1_Chr2_+_9293261_9293261 | 1.43 |
AT2G21790.1
|
RNR1
|
ribonucleotide reductase 1 |
| arTal_v1_Chr5_+_3536189_3536189 | 1.43 |
AT5G11110.1
|
SPS2F
|
sucrose phosphate synthase 2F |
| arTal_v1_Chr5_-_22115539_22115539 | 1.43 |
AT5G54470.1
|
BBX29
|
B-box type zinc finger family protein |
| arTal_v1_Chr1_-_22363854_22363854 | 1.43 |
AT1G60750.1
|
AT1G60750
|
NAD(P)-linked oxidoreductase superfamily protein |
| arTal_v1_Chr3_+_880988_880988 | 1.42 |
AT3G03640.1
|
BGLU25
|
beta glucosidase 25 |
| arTal_v1_Chr2_+_17057388_17057388 | 1.42 |
AT2G40880.1
|
CYSA
|
cystatin A |
| arTal_v1_Chr1_+_23168767_23168767 | 1.42 |
AT1G62570.1
|
FMO GS-OX4
|
flavin-monooxygenase glucosinolate S-oxygenase 4 |
| arTal_v1_Chr4_-_12345652_12345652 | 1.41 |
AT4G23700.2
|
CHX17
|
cation/H+ exchanger 17 |
| arTal_v1_Chr3_+_5720941_5721030 | 1.41 |
AT3G16800.5
AT3G16800.4 AT3G16800.2 AT3G16800.6 AT3G16800.1 |
AT3G16800
|
Protein phosphatase 2C family protein |
| arTal_v1_Chr5_+_8687188_8687188 | 1.40 |
AT5G25160.1
|
ZFP3
|
zinc finger protein 3 |
| arTal_v1_Chr1_+_17382998_17382998 | 1.40 |
AT1G47395.1
|
AT1G47395
|
hypothetical protein |
| arTal_v1_Chr1_+_25701770_25701770 | 1.40 |
AT1G68500.1
|
AT1G68500
|
hypothetical protein |
| arTal_v1_Chr5_+_5092140_5092140 | 1.40 |
AT5G15650.1
|
RGP2
|
reversibly glycosylated polypeptide 2 |
| arTal_v1_Chr1_+_28829243_28829243 | 1.40 |
AT1G76800.1
|
AT1G76800
|
Vacuolar iron transporter (VIT) family protein |
| arTal_v1_Chr5_-_7385833_7385833 | 1.39 |
AT5G22310.1
|
AT5G22310
|
trichohyalin-like protein |
| arTal_v1_Chr3_-_23046153_23046153 | 1.39 |
AT3G62270.1
|
AT3G62270
|
HCO3- transporter family |
| arTal_v1_Chr1_-_18753941_18753941 | 1.39 |
AT1G50630.1
AT1G50630.2 |
AT1G50630
|
extracellular ligand-gated ion channel protein (DUF3537) |
| arTal_v1_Chr4_-_12346051_12346051 | 1.38 |
AT4G23700.1
|
CHX17
|
cation/H+ exchanger 17 |
| arTal_v1_Chr4_+_8804070_8804120 | 1.38 |
AT4G15393.2
AT4G15393.3 AT4G15393.1 |
CYP702A5
|
cytochrome P450, family 702, subfamily A, polypeptide 5 |
| arTal_v1_Chr2_+_13107909_13107909 | 1.38 |
AT2G30766.2
|
AT2G30766
|
hypothetical protein |
| arTal_v1_Chr3_+_16138375_16138375 | 1.38 |
AT3G44550.2
|
FAR5
|
fatty acid reductase 5 |
| arTal_v1_Chr4_+_10861382_10861386 | 1.36 |
AT4G20070.1
AT4G20070.2 |
AAH
|
allantoate amidohydrolase |
| arTal_v1_Chr4_+_5244865_5244865 | 1.36 |
AT4G08300.1
|
UMAMIT17
|
nodulin MtN21 /EamA-like transporter family protein |
| arTal_v1_Chr2_+_18061716_18061886 | 1.35 |
AT2G43500.1
AT2G43500.3 AT2G43500.4 AT2G43500.5 AT2G43500.6 AT2G43500.7 AT2G43500.2 AT2G43500.8 |
AT2G43500
|
Plant regulator RWP-RK family protein |
| arTal_v1_Chr5_-_7654835_7654835 | 1.35 |
AT5G22890.1
|
AT5G22890
|
C2H2 and C2HC zinc fingers superfamily protein |
| arTal_v1_Chr3_+_3923969_3923969 | 1.34 |
AT3G12320.3
|
AT3G12320
|
hypothetical protein |
| arTal_v1_Chr4_+_596397_596399 | 1.34 |
AT4G01440.3
AT4G01440.2 AT4G01440.1 AT4G01440.4 |
UMAMIT31
|
nodulin MtN21 /EamA-like transporter family protein |
| arTal_v1_Chr4_-_16285229_16285229 | 1.34 |
AT4G33980.1
|
AT4G33980
|
hypothetical protein |
| arTal_v1_Chr4_+_13074090_13074090 | 1.34 |
AT4G25630.1
|
FIB2
|
fibrillarin 2 |
| arTal_v1_Chr5_+_903470_903472 | 1.33 |
AT5G03570.1
AT5G03570.3 |
IREG2
|
iron regulated 2 |
| arTal_v1_Chr3_+_3923515_3923515 | 1.33 |
AT3G12320.1
|
AT3G12320
|
hypothetical protein |
| arTal_v1_Chr1_-_11719988_11719988 | 1.33 |
AT1G32450.1
|
NRT1.5
|
nitrate transporter 1.5 |
| arTal_v1_Chr2_+_13107583_13107583 | 1.32 |
AT2G30766.1
|
AT2G30766
|
hypothetical protein |
| arTal_v1_Chr1_+_21136835_21136835 | 1.32 |
AT1G56430.1
|
NAS4
|
nicotianamine synthase 4 |
| arTal_v1_Chr1_+_27538190_27538190 | 1.32 |
AT1G73220.1
|
OCT1
|
organic cation/carnitine transporter1 |
| arTal_v1_Chr5_+_2657054_2657054 | 1.31 |
AT5G08260.1
|
scpl35
|
serine carboxypeptidase-like 35 |
| arTal_v1_Chr4_-_16285059_16285059 | 1.31 |
AT4G33980.2
|
AT4G33980
|
hypothetical protein |
| arTal_v1_Chr4_-_13752103_13752103 | 1.31 |
AT4G27520.1
|
ENODL2
|
early nodulin-like protein 2 |
| arTal_v1_Chr1_+_4342209_4342282 | 1.31 |
AT1G12740.1
AT1G12740.2 AT1G12740.3 AT1G12740.4 |
CYP87A2
|
cytochrome P450, family 87, subfamily A, polypeptide 2 |
| arTal_v1_Chr2_-_15560755_15560755 | 1.31 |
AT2G37040.1
|
PAL1
|
PHE ammonia lyase 1 |
| arTal_v1_Chr1_+_17385707_17385707 | 1.31 |
AT1G47400.1
|
AT1G47400
|
hypothetical protein |
| arTal_v1_Chr5_+_5268421_5268421 | 1.30 |
AT5G16130.1
|
AT5G16130
|
Ribosomal protein S7e family protein |
| arTal_v1_Chr5_-_1742161_1742186 | 1.30 |
AT5G05790.2
AT5G05790.1 |
AT5G05790
|
Duplicated homeodomain-like superfamily protein |
| arTal_v1_Chr5_-_24530032_24530032 | 1.30 |
AT5G60960.1
|
PNM1
|
Pentatricopeptide repeat (PPR) superfamily protein |
| arTal_v1_Chr3_-_565801_565801 | 1.28 |
AT3G02640.1
|
AT3G02640
|
transmembrane protein |
| arTal_v1_Chr1_+_19087384_19087384 | 1.28 |
AT1G51470.1
|
BGLU35
|
beta glucosidase 35 |
| arTal_v1_Chr5_+_20644525_20644525 | 1.28 |
AT5G50760.1
|
AT5G50760
|
SAUR-like auxin-responsive protein family |
| arTal_v1_Chr2_+_12706627_12706627 | 1.28 |
AT2G29740.1
|
UGT71C2
|
UDP-glucosyl transferase 71C2 |
| arTal_v1_Chr5_+_23701392_23701392 | 1.28 |
AT5G58660.1
AT5G58660.2 |
AT5G58660
|
2-oxoglutarate (2OG) and Fe(II)-dependent oxygenase superfamily protein |
| arTal_v1_Chr3_+_20206128_20206241 | 1.28 |
AT3G54590.1
AT3G54590.2 AT3G54590.3 |
HRGP1
|
hydroxyproline-rich glycoprotein |
| arTal_v1_Chr5_+_20949291_20949291 | 1.28 |
AT5G51570.1
|
AT5G51570
|
SPFH/Band 7/PHB domain-containing membrane-associated protein family |
| arTal_v1_Chr5_-_24116220_24116220 | 1.28 |
AT5G59870.1
|
HTA6
|
histone H2A 6 |
| arTal_v1_Chr3_+_11810726_11810726 | 1.27 |
AT3G30180.1
|
BR6OX2
|
brassinosteroid-6-oxidase 2 |
| arTal_v1_Chr4_-_15347725_15347804 | 1.27 |
AT4G31700.2
AT4G31700.1 |
RPS6
|
ribosomal protein S6 |
| arTal_v1_Chr1_-_19888328_19888413 | 1.27 |
AT1G53310.3
AT1G53310.1 AT1G53310.2 |
PPC1
|
phosphoenolpyruvate carboxylase 1 |
| arTal_v1_Chr1_-_29239484_29239484 | 1.26 |
AT1G77760.1
|
NIA1
|
nitrate reductase 1 |
| arTal_v1_Chr5_-_2958971_2958971 | 1.26 |
AT5G09520.1
|
PELPK2
|
hydroxyproline-rich glycoprotein family protein |
| arTal_v1_Chr1_-_8688246_8688247 | 1.26 |
AT1G24510.1
AT1G24510.2 AT1G24510.3 |
AT1G24510
|
TCP-1/cpn60 chaperonin family protein |
| arTal_v1_Chr3_+_3923735_3923735 | 1.26 |
AT3G12320.2
|
AT3G12320
|
hypothetical protein |
| arTal_v1_Chr5_+_22967891_22967891 | 1.25 |
AT5G56790.1
|
AT5G56790
|
Protein kinase superfamily protein |
| arTal_v1_Chr1_-_12745748_12745748 | 1.25 |
AT1G34760.1
AT1G34760.2 |
GRF11
|
general regulatory factor 11 |
| arTal_v1_Chr3_-_21087710_21087710 | 1.25 |
AT3G56980.1
|
bHLH39
|
basic helix-loop-helix (bHLH) DNA-binding superfamily protein |
| arTal_v1_Chr3_+_8480025_8480025 | 1.23 |
AT3G23620.1
|
AT3G23620
|
Ribosomal RNA processing Brix domain protein |
| arTal_v1_Chr2_-_394184_394184 | 1.23 |
AT2G01880.1
|
PAP7
|
purple acid phosphatase 7 |
| arTal_v1_Chr5_+_26894778_26894778 | 1.23 |
AT5G67400.1
|
RHS19
|
root hair specific 19 |
| arTal_v1_Chr5_-_19388562_19388587 | 1.23 |
AT5G47880.2
AT5G47880.1 |
ERF1-1
|
eukaryotic release factor 1-1 |
| arTal_v1_Chr3_-_5148340_5148340 | 1.23 |
AT3G15300.1
|
AT3G15300
|
VQ motif-containing protein |
| arTal_v1_Chr1_+_23740493_23740562 | 1.23 |
AT1G63980.1
AT1G63980.2 |
AT1G63980
|
D111/G-patch domain-containing protein |
| arTal_v1_Chr1_+_24551807_24551807 | 1.22 |
AT1G65960.3
AT1G65960.1 |
GAD2
|
glutamate decarboxylase 2 |
| arTal_v1_Chr3_+_16137576_16137576 | 1.22 |
AT3G44550.1
|
FAR5
|
fatty acid reductase 5 |
| arTal_v1_Chr2_-_17202848_17202848 | 1.22 |
AT2G41250.1
|
AT2G41250
|
Haloacid dehalogenase-like hydrolase (HAD) superfamily protein |
| arTal_v1_Chr2_-_856725_856725 | 1.22 |
AT2G02950.1
|
PKS1
|
phytochrome kinase substrate 1 |
| arTal_v1_Chr3_-_4762457_4762457 | 1.21 |
AT3G14280.1
|
AT3G14280
|
LL-diaminopimelate aminotransferase |
| arTal_v1_Chr4_-_13761603_13761603 | 1.21 |
AT4G27560.1
|
AT4G27560
|
UDP-Glycosyltransferase superfamily protein |
| arTal_v1_Chr1_-_29459493_29459493 | 1.21 |
AT1G78290.2
AT1G78290.3 |
SNRK2-8
|
Protein kinase superfamily protein |
| arTal_v1_Chr1_+_17558137_17558137 | 1.21 |
AT1G47710.1
|
SERPIN1
|
Serine protease inhibitor (SERPIN) family protein |
| arTal_v1_Chr4_-_10148656_10148764 | 1.20 |
AT4G18360.4
AT4G18360.2 AT4G18360.1 AT4G18360.3 |
GOX3
|
Aldolase-type TIM barrel family protein |
| arTal_v1_Chr5_-_16634012_16634012 | 1.20 |
AT5G41590.1
|
AT5G41590
|
LURP-one-like protein (DUF567) |
| arTal_v1_Chr1_+_18346958_18346958 | 1.20 |
AT1G49570.1
|
AT1G49570
|
Peroxidase superfamily protein |
| arTal_v1_Chr1_+_27241696_27241812 | 1.20 |
AT1G72360.2
AT1G72360.3 AT1G72360.1 |
ERF73
|
Integrase-type DNA-binding superfamily protein |
| arTal_v1_Chr5_+_21020014_21020014 | 1.20 |
AT5G51750.1
|
SBT1.3
|
subtilase 1.3 |
| arTal_v1_Chr5_+_14273535_14273535 | 1.19 |
AT5G36230.2
|
AT5G36230
|
ARM repeat superfamily protein |
| arTal_v1_Chr5_+_7718118_7718118 | 1.19 |
AT5G23020.1
|
IMS2
|
2-isopropylmalate synthase 2 |
| arTal_v1_Chr5_+_6690520_6690520 | 1.19 |
AT5G19800.1
|
AT5G19800
|
hydroxyproline-rich glycoprotein family protein |
| arTal_v1_Chr3_+_23211287_23211287 | 1.18 |
AT3G62740.2
AT3G62740.1 |
BGLU7
|
beta glucosidase 7 |
| arTal_v1_Chr3_-_10704010_10704018 | 1.18 |
AT3G28550.1
AT3G28550.2 |
AT3G28550
|
Proline-rich extensin-like family protein |
| arTal_v1_Chr1_-_24433165_24433165 | 1.17 |
AT1G65690.1
|
AT1G65690
|
Late embryogenesis abundant (LEA) hydroxyproline-rich glycoprotein family |
| arTal_v1_Chr2_-_16493343_16493343 | 1.17 |
AT2G39510.1
|
UMAMIT14
|
nodulin MtN21 /EamA-like transporter family protein |
| arTal_v1_Chr1_-_8711578_8711578 | 1.17 |
AT1G24575.1
|
AT1G24575
|
DEAD-box ATP-dependent RNA helicase-like protein |
| arTal_v1_Chr3_-_4231408_4231408 | 1.16 |
AT3G13160.1
|
AT3G13160
|
Tetratricopeptide repeat (TPR)-like superfamily protein |
| arTal_v1_Chr5_+_14273345_14273345 | 1.16 |
AT5G36230.1
|
AT5G36230
|
ARM repeat superfamily protein |
| arTal_v1_Chr4_-_5456100_5456100 | 1.16 |
AT4G08570.1
|
AT4G08570
|
Heavy metal transport/detoxification superfamily protein |
| arTal_v1_Chr5_+_16161449_16161449 | 1.16 |
AT5G40390.1
|
SIP1
|
Raffinose synthase family protein |
| arTal_v1_Chr5_-_1861656_1861703 | 1.15 |
AT5G06150.2
AT5G06150.1 |
CYC1BAT
|
Cyclin family protein |
| arTal_v1_Chr4_+_17739514_17739514 | 1.15 |
AT4G37750.1
|
ANT
|
Integrase-type DNA-binding superfamily protein |
| arTal_v1_Chr3_+_9848628_9848628 | 1.15 |
AT3G26780.1
|
MEF14
|
Phosphoglycerate mutase family protein |
| arTal_v1_Chr1_+_24554413_24554413 | 1.15 |
AT1G65960.4
|
GAD2
|
glutamate decarboxylase 2 |
| arTal_v1_Chr5_-_25370940_25370940 | 1.15 |
AT5G63290.1
|
AT5G63290
|
Radical SAM superfamily protein |
| arTal_v1_Chr1_-_8203301_8203301 | 1.15 |
AT1G23140.1
|
AT1G23140
|
Calcium-dependent lipid-binding (CaLB domain) family protein |
| arTal_v1_Chr5_+_22923804_22923804 | 1.15 |
AT5G56630.1
|
PFK7
|
phosphofructokinase 7 |
| arTal_v1_Chr5_-_6222300_6222300 | 1.15 |
AT5G18660.1
|
PCB2
|
NAD(P)-binding Rossmann-fold superfamily protein |
| arTal_v1_Chr3_-_4229752_4229752 | 1.15 |
AT3G13150.1
|
AT3G13150
|
Tetratricopeptide repeat (TPR)-like superfamily protein |
| arTal_v1_Chr3_-_1624819_1624852 | 1.14 |
AT3G05600.2
AT3G05600.1 |
AT3G05600
|
alpha/beta-Hydrolases superfamily protein |
| arTal_v1_Chr2_+_9841842_9841842 | 1.14 |
AT2G23120.1
|
AT2G23120
|
Late embryogenesis abundant protein, group 6 |
| arTal_v1_Chr3_-_5845220_5845220 | 1.14 |
AT3G17130.1
|
AT3G17130
|
Plant invertase/pectin methylesterase inhibitor superfamily protein |
| arTal_v1_Chr5_+_15543115_15543156 | 1.14 |
AT5G38820.1
AT5G38820.2 |
AT5G38820
|
Transmembrane amino acid transporter family protein |
| arTal_v1_Chr4_-_1046993_1047105 | 1.14 |
AT4G02380.2
AT4G02380.1 AT4G02380.3 |
SAG21
|
senescence-associated gene 21 |
| arTal_v1_Chr1_+_7481184_7481197 | 1.14 |
AT1G21360.2
AT1G21360.1 AT1G21360.3 |
GLTP2
|
glycolipid transfer protein 2 |
| arTal_v1_Chr3_-_10011712_10011807 | 1.14 |
AT3G27150.2
AT3G27150.1 |
AT3G27150
|
Galactose oxidase/kelch repeat superfamily protein |
| arTal_v1_Chr5_-_23737335_23737335 | 1.14 |
AT5G58780.1
|
cPT5
|
Undecaprenyl pyrophosphate synthetase family protein |
| arTal_v1_Chr1_-_23246949_23246949 | 1.13 |
AT1G62770.1
|
AT1G62770
|
Plant invertase/pectin methylesterase inhibitor superfamily protein |
| arTal_v1_Chr3_-_4739136_4739136 | 1.13 |
AT3G14230.1
AT3G14230.3 |
RAP2.2
|
related to AP2 2 |
| arTal_v1_Chr3_+_6393747_6393747 | 1.13 |
AT3G18560.1
|
AT3G18560
|
hypothetical protein |
| arTal_v1_Chr5_+_21401312_21401312 | 1.13 |
AT5G52820.1
|
AT5G52820
|
WD-40 repeat family protein / notchless protein |
| arTal_v1_Chr4_-_6718550_6718550 | 1.13 |
AT4G10960.1
|
UGE5
|
UDP-D-glucose/UDP-D-galactose 4-epimerase 5 |
| arTal_v1_Chr5_-_14213293_14213293 | 1.12 |
AT5G36140.1
|
CYP716A2
|
cytochrome P450, family 716, subfamily A, polypeptide 2 |
| arTal_v1_Chr5_+_904693_904693 | 1.12 |
AT5G03570.4
|
IREG2
|
iron regulated 2 |
| arTal_v1_Chr5_-_19648362_19648362 | 1.12 |
AT5G48490.1
|
AT5G48490
|
Bifunctional inhibitor/lipid-transfer protein/seed storage 2S albumin superfamily protein |
| arTal_v1_Chr1_-_18360426_18360447 | 1.12 |
AT1G49600.2
AT1G49600.1 AT1G49600.3 |
RBP47A
|
RNA-binding protein 47A |
| arTal_v1_Chr3_+_21073330_21073421 | 1.12 |
AT3G56930.1
AT3G56930.2 |
AT3G56930
|
DHHC-type zinc finger family protein |
| arTal_v1_Chr2_-_1167115_1167115 | 1.11 |
AT2G03820.1
|
NMD3
|
nonsense-mediated mRNA decay NMD3 family protein |
| arTal_v1_Chr2_+_9592956_9592956 | 1.11 |
AT2G22590.1
|
AT2G22590
|
UDP-Glycosyltransferase superfamily protein |
| arTal_v1_Chr4_+_9865103_9865103 | 1.11 |
AT4G17730.2
AT4G17730.1 |
SYP23
|
syntaxin of plants 23 |
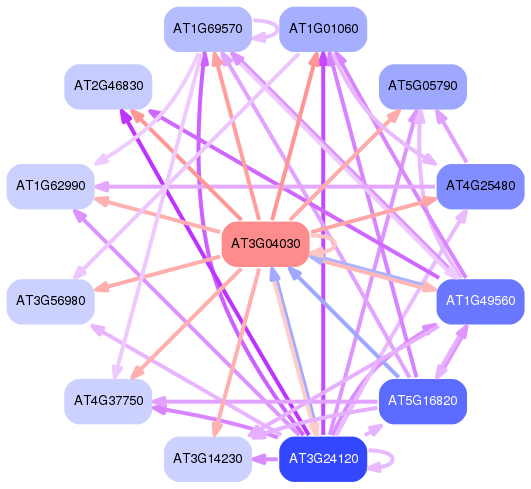
Network of associatons between targets according to the STRING database.

First level regulatory network of AT3G04030
Gene Ontology Analysis
Gene overrepresentation in biological process category:
| Log-likelihood per target | Total log-likelihood | Term | Description |
|---|---|---|---|
| 1.7 | 10.4 | GO:0009413 | response to flooding(GO:0009413) |
| 1.7 | 6.7 | GO:0015675 | nickel cation transport(GO:0015675) |
| 1.1 | 6.7 | GO:0042754 | negative regulation of circadian rhythm(GO:0042754) |
| 1.1 | 4.4 | GO:0072351 | nicotianamine metabolic process(GO:0030417) nicotianamine biosynthetic process(GO:0030418) tricarboxylic acid biosynthetic process(GO:0072351) |
| 0.9 | 3.6 | GO:0019388 | galactose catabolic process(GO:0019388) galactose catabolic process via UDP-galactose(GO:0033499) |
| 0.8 | 2.4 | GO:0019320 | hexose catabolic process(GO:0019320) |
| 0.8 | 5.5 | GO:0010106 | cellular response to iron ion starvation(GO:0010106) |
| 0.7 | 2.2 | GO:1904812 | rRNA acetylation involved in maturation of SSU-rRNA(GO:1904812) rRNA acetylation(GO:1990882) RNA acetylation(GO:1990884) |
| 0.7 | 2.2 | GO:0006424 | glutamyl-tRNA aminoacylation(GO:0006424) |
| 0.7 | 2.1 | GO:0006658 | phosphatidylserine metabolic process(GO:0006658) phosphatidylserine biosynthetic process(GO:0006659) |
| 0.7 | 2.0 | GO:0015696 | ammonium transport(GO:0015696) |
| 0.6 | 1.8 | GO:1990532 | stress response to nickel ion(GO:1990532) |
| 0.6 | 0.6 | GO:1902586 | transport of virus in host, cell to cell(GO:0046740) multi-organism intercellular transport(GO:1902586) |
| 0.6 | 1.8 | GO:0019593 | hexitol metabolic process(GO:0006059) hexitol biosynthetic process(GO:0019406) mannitol biosynthetic process(GO:0019593) mannitol metabolic process(GO:0019594) |
| 0.6 | 3.0 | GO:0071366 | cellular response to indolebutyric acid stimulus(GO:0071366) |
| 0.6 | 0.6 | GO:1901654 | response to cycloheximide(GO:0046898) cellular response to external biotic stimulus(GO:0071217) response to ketone(GO:1901654) |
| 0.5 | 1.6 | GO:0015742 | alpha-ketoglutarate transport(GO:0015742) |
| 0.5 | 2.1 | GO:0032889 | regulation of vacuole fusion, non-autophagic(GO:0032889) vacuole fusion, non-autophagic(GO:0042144) |
| 0.5 | 1.5 | GO:0035280 | miRNA loading onto RISC involved in gene silencing by miRNA(GO:0035280) small RNA loading onto RISC(GO:0070922) |
| 0.5 | 2.5 | GO:0006809 | nitric oxide biosynthetic process(GO:0006809) |
| 0.5 | 1.5 | GO:0045002 | DNA double-strand break processing involved in repair via single-strand annealing(GO:0010792) double-strand break repair via single-strand annealing(GO:0045002) |
| 0.5 | 1.9 | GO:0019567 | pentose biosynthetic process(GO:0019322) arabinose biosynthetic process(GO:0019567) |
| 0.5 | 1.9 | GO:0009660 | amyloplast organization(GO:0009660) |
| 0.5 | 1.4 | GO:0007032 | endosome organization(GO:0007032) |
| 0.5 | 0.9 | GO:0015802 | basic amino acid transport(GO:0015802) |
| 0.5 | 3.2 | GO:0015800 | acidic amino acid transport(GO:0015800) |
| 0.4 | 1.3 | GO:0033967 | box C/D snoRNA 3'-end processing(GO:0000494) peptidyl-glutamine methylation(GO:0018364) box C/D snoRNA metabolic process(GO:0033967) box C/D snoRNA processing(GO:0034963) histone glutamine methylation(GO:1990258) |
| 0.4 | 1.8 | GO:0000480 | endonucleolytic cleavage to generate mature 5'-end of SSU-rRNA from (SSU-rRNA, 5.8S rRNA, LSU-rRNA)(GO:0000472) endonucleolytic cleavage in 5'-ETS of tricistronic rRNA transcript (SSU-rRNA, 5.8S rRNA, LSU-rRNA)(GO:0000480) |
| 0.4 | 0.9 | GO:0019586 | uronic acid metabolic process(GO:0006063) galacturonate metabolic process(GO:0019586) |
| 0.4 | 0.8 | GO:0035865 | cellular response to potassium ion(GO:0035865) |
| 0.4 | 1.3 | GO:0034067 | protein localization to Golgi apparatus(GO:0034067) |
| 0.4 | 2.4 | GO:0044205 | 'de novo' UMP biosynthetic process(GO:0044205) |
| 0.4 | 1.6 | GO:0045948 | positive regulation of translational initiation(GO:0045948) |
| 0.4 | 0.4 | GO:0048656 | anther wall tapetum formation(GO:0048656) anther wall tapetum cell differentiation(GO:0048657) |
| 0.4 | 1.6 | GO:0030203 | aminoglycan biosynthetic process(GO:0006023) glycosaminoglycan biosynthetic process(GO:0006024) UDP-glucuronate biosynthetic process(GO:0006065) glycosaminoglycan metabolic process(GO:0030203) |
| 0.4 | 0.8 | GO:0009663 | plasmodesma organization(GO:0009663) |
| 0.4 | 2.0 | GO:0035627 | ceramide transport(GO:0035627) |
| 0.4 | 1.6 | GO:0002184 | cytoplasmic translational termination(GO:0002184) |
| 0.4 | 0.8 | GO:0010086 | embryonic root morphogenesis(GO:0010086) |
| 0.4 | 0.4 | GO:0090436 | peroxisome localization(GO:0060151) leaf pavement cell development(GO:0090436) |
| 0.4 | 1.1 | GO:1900111 | positive regulation of histone H3-K9 dimethylation(GO:1900111) |
| 0.4 | 1.1 | GO:1900544 | regulation of oxidative phosphorylation(GO:0002082) positive regulation of nucleoside metabolic process(GO:0045979) positive regulation of nucleotide metabolic process(GO:0045981) positive regulation of purine nucleotide metabolic process(GO:1900544) positive regulation of ATP metabolic process(GO:1903580) positive regulation of oxidative phosphorylation(GO:1903862) |
| 0.4 | 3.3 | GO:2000071 | regulation of defense response by callose deposition(GO:2000071) |
| 0.4 | 1.1 | GO:0032000 | positive regulation of fatty acid beta-oxidation(GO:0032000) positive regulation of lipid catabolic process(GO:0050996) |
| 0.4 | 2.2 | GO:0006145 | purine nucleobase catabolic process(GO:0006145) |
| 0.4 | 1.4 | GO:0061062 | nematode larval development(GO:0002119) larval development(GO:0002164) regulation of nematode larval development(GO:0061062) |
| 0.4 | 1.1 | GO:0046102 | inosine catabolic process(GO:0006148) inosine metabolic process(GO:0046102) |
| 0.4 | 1.4 | GO:0090069 | regulation of ribosome biogenesis(GO:0090069) |
| 0.3 | 1.0 | GO:0010203 | response to very low fluence red light stimulus(GO:0010203) |
| 0.3 | 1.7 | GO:0015824 | proline transport(GO:0015824) |
| 0.3 | 1.0 | GO:0010377 | guard cell fate commitment(GO:0010377) |
| 0.3 | 1.7 | GO:0006556 | S-adenosylmethionine biosynthetic process(GO:0006556) |
| 0.3 | 0.6 | GO:0048729 | establishment of planar polarity(GO:0001736) morphogenesis of a polarized epithelium(GO:0001738) morphogenesis of an epithelium(GO:0002009) tissue morphogenesis(GO:0048729) |
| 0.3 | 0.6 | GO:0046683 | response to organophosphorus(GO:0046683) |
| 0.3 | 5.1 | GO:0010540 | basipetal auxin transport(GO:0010540) |
| 0.3 | 1.6 | GO:0010677 | negative regulation of cellular carbohydrate metabolic process(GO:0010677) |
| 0.3 | 0.3 | GO:0046398 | UDP-glucuronate metabolic process(GO:0046398) |
| 0.3 | 0.9 | GO:0043090 | amino acid import(GO:0043090) |
| 0.3 | 0.9 | GO:0042407 | cristae formation(GO:0042407) |
| 0.3 | 1.3 | GO:0071836 | nectar secretion(GO:0071836) |
| 0.3 | 0.9 | GO:0032978 | protein insertion into membrane from inner side(GO:0032978) protein insertion into mitochondrial membrane from inner side(GO:0032979) protein insertion into mitochondrial membrane(GO:0051204) |
| 0.3 | 1.6 | GO:0000393 | spliceosomal conformational changes to generate catalytic conformation(GO:0000393) |
| 0.3 | 0.3 | GO:0008645 | hexose transport(GO:0008645) fructose transport(GO:0015755) |
| 0.3 | 5.1 | GO:0002183 | cytoplasmic translational initiation(GO:0002183) |
| 0.3 | 0.9 | GO:0015717 | triose phosphate transport(GO:0015717) triose phosphate transmembrane transport(GO:0035436) |
| 0.3 | 1.2 | GO:0033478 | UDP-rhamnose biosynthetic process(GO:0010253) UDP-rhamnose metabolic process(GO:0033478) |
| 0.3 | 1.2 | GO:0019377 | glycosylceramide metabolic process(GO:0006677) glucosylceramide metabolic process(GO:0006678) glucosylceramide catabolic process(GO:0006680) glycosphingolipid metabolic process(GO:0006687) glycolipid catabolic process(GO:0019377) glycosylceramide catabolic process(GO:0046477) glycosphingolipid catabolic process(GO:0046479) ceramide catabolic process(GO:0046514) |
| 0.3 | 1.5 | GO:0009647 | skotomorphogenesis(GO:0009647) |
| 0.3 | 0.3 | GO:0045922 | negative regulation of fatty acid metabolic process(GO:0045922) |
| 0.3 | 0.9 | GO:0042255 | ribosome assembly(GO:0042255) |
| 0.3 | 5.0 | GO:1902074 | response to salt(GO:1902074) |
| 0.3 | 0.9 | GO:0044208 | 'de novo' AMP biosynthetic process(GO:0044208) |
| 0.3 | 0.6 | GO:0018065 | protein-cofactor linkage(GO:0018065) |
| 0.3 | 3.2 | GO:0051131 | chaperone-mediated protein complex assembly(GO:0051131) |
| 0.3 | 2.6 | GO:0009819 | drought recovery(GO:0009819) |
| 0.3 | 0.9 | GO:1904062 | regulation of potassium ion transmembrane transport(GO:1901379) regulation of cation transmembrane transport(GO:1904062) |
| 0.3 | 2.6 | GO:0009942 | longitudinal axis specification(GO:0009942) |
| 0.3 | 1.7 | GO:0001731 | formation of translation preinitiation complex(GO:0001731) |
| 0.3 | 7.2 | GO:0006012 | galactose metabolic process(GO:0006012) |
| 0.3 | 0.9 | GO:0010289 | homogalacturonan biosynthetic process(GO:0010289) |
| 0.3 | 0.9 | GO:0071156 | negative regulation of fatty acid biosynthetic process(GO:0045717) regulation of cell cycle arrest(GO:0071156) positive regulation of cell cycle arrest(GO:0071158) |
| 0.3 | 0.9 | GO:0032025 | response to cobalt ion(GO:0032025) |
| 0.3 | 1.1 | GO:0010336 | gibberellic acid homeostasis(GO:0010336) |
| 0.3 | 1.1 | GO:0010480 | microsporocyte differentiation(GO:0010480) |
| 0.3 | 2.2 | GO:0006267 | pre-replicative complex assembly involved in nuclear cell cycle DNA replication(GO:0006267) pre-replicative complex assembly(GO:0036388) pre-replicative complex assembly involved in cell cycle DNA replication(GO:1902299) |
| 0.3 | 0.8 | GO:0019483 | uracil catabolic process(GO:0006212) beta-alanine biosynthetic process(GO:0019483) |
| 0.3 | 1.1 | GO:0051211 | anisotropic cell growth(GO:0051211) |
| 0.3 | 4.1 | GO:0006538 | glutamate catabolic process(GO:0006538) |
| 0.3 | 0.5 | GO:0000706 | meiotic DNA double-strand break processing(GO:0000706) DNA double-strand break processing(GO:0000729) |
| 0.3 | 2.4 | GO:0071490 | cellular response to far red light(GO:0071490) |
| 0.3 | 0.8 | GO:0042539 | hypotonic salinity response(GO:0042539) |
| 0.3 | 0.8 | GO:0008334 | histone mRNA metabolic process(GO:0008334) |
| 0.3 | 0.8 | GO:0033567 | DNA replication, Okazaki fragment processing(GO:0033567) |
| 0.3 | 2.1 | GO:0006308 | DNA catabolic process(GO:0006308) |
| 0.3 | 1.0 | GO:0033306 | phytol metabolic process(GO:0033306) |
| 0.3 | 1.0 | GO:0035494 | SNARE complex disassembly(GO:0035494) |
| 0.3 | 1.5 | GO:0046051 | UTP biosynthetic process(GO:0006228) UTP metabolic process(GO:0046051) |
| 0.3 | 0.8 | GO:0006499 | N-terminal protein lipidation(GO:0006498) N-terminal protein myristoylation(GO:0006499) protein myristoylation(GO:0018377) |
| 0.3 | 1.0 | GO:0048358 | mucilage pectin biosynthetic process(GO:0048358) |
| 0.3 | 0.8 | GO:0031054 | pre-miRNA processing(GO:0031054) |
| 0.3 | 3.0 | GO:0000463 | maturation of LSU-rRNA from tricistronic rRNA transcript (SSU-rRNA, 5.8S rRNA, LSU-rRNA)(GO:0000463) |
| 0.3 | 0.8 | GO:0034058 | endosomal vesicle fusion(GO:0034058) |
| 0.3 | 0.8 | GO:0001193 | maintenance of transcriptional fidelity during DNA-templated transcription elongation(GO:0001192) maintenance of transcriptional fidelity during DNA-templated transcription elongation from RNA polymerase II promoter(GO:0001193) |
| 0.3 | 2.3 | GO:0006086 | acetyl-CoA biosynthetic process from pyruvate(GO:0006086) |
| 0.2 | 0.7 | GO:0048833 | specification of organ number(GO:0048832) specification of floral organ number(GO:0048833) |
| 0.2 | 1.5 | GO:0010148 | transpiration(GO:0010148) |
| 0.2 | 0.7 | GO:0008608 | attachment of spindle microtubules to kinetochore(GO:0008608) |
| 0.2 | 2.0 | GO:0032844 | regulation of homeostatic process(GO:0032844) |
| 0.2 | 1.0 | GO:0000455 | enzyme-directed rRNA pseudouridine synthesis(GO:0000455) |
| 0.2 | 1.0 | GO:0009727 | detection of ethylene stimulus(GO:0009727) |
| 0.2 | 0.7 | GO:0043181 | vacuolar sequestering(GO:0043181) |
| 0.2 | 2.9 | GO:0017157 | regulation of exocytosis(GO:0017157) |
| 0.2 | 2.1 | GO:0046337 | phosphatidylethanolamine biosynthetic process(GO:0006646) phosphatidylethanolamine metabolic process(GO:0046337) |
| 0.2 | 5.9 | GO:0045037 | protein import into chloroplast stroma(GO:0045037) |
| 0.2 | 0.9 | GO:0090308 | positive regulation of chromatin silencing(GO:0031937) regulation of methylation-dependent chromatin silencing(GO:0090308) positive regulation of methylation-dependent chromatin silencing(GO:0090309) |
| 0.2 | 0.9 | GO:0010042 | response to manganese ion(GO:0010042) |
| 0.2 | 0.7 | GO:0033321 | homomethionine metabolic process(GO:0033321) glucosinolate biosynthetic process from homomethionine(GO:0033506) |
| 0.2 | 0.2 | GO:0080171 | lytic vacuole organization(GO:0080171) |
| 0.2 | 2.1 | GO:0060866 | leaf abscission(GO:0060866) |
| 0.2 | 1.4 | GO:0010019 | chloroplast-nucleus signaling pathway(GO:0010019) |
| 0.2 | 0.5 | GO:0010069 | zygote asymmetric cytokinesis in embryo sac(GO:0010069) |
| 0.2 | 3.0 | GO:1901141 | regulation of lignin biosynthetic process(GO:1901141) |
| 0.2 | 0.7 | GO:0045737 | positive regulation of cyclin-dependent protein serine/threonine kinase activity(GO:0045737) positive regulation of cyclin-dependent protein kinase activity(GO:1904031) |
| 0.2 | 1.4 | GO:0050829 | defense response to Gram-negative bacterium(GO:0050829) |
| 0.2 | 0.9 | GO:0019474 | lysine catabolic process(GO:0006554) L-lysine catabolic process to acetyl-CoA(GO:0019474) L-lysine catabolic process(GO:0019477) L-lysine catabolic process to acetyl-CoA via saccharopine(GO:0033512) L-lysine metabolic process(GO:0046440) |
| 0.2 | 1.4 | GO:0010731 | protein glutathionylation(GO:0010731) |
| 0.2 | 0.5 | GO:0045764 | positive regulation of cellular amine metabolic process(GO:0033240) positive regulation of cellular amino acid metabolic process(GO:0045764) |
| 0.2 | 5.4 | GO:0000470 | maturation of LSU-rRNA(GO:0000470) |
| 0.2 | 0.7 | GO:0009830 | cell wall modification involved in abscission(GO:0009830) cell wall disassembly(GO:0044277) |
| 0.2 | 0.4 | GO:0010444 | guard mother cell differentiation(GO:0010444) |
| 0.2 | 3.1 | GO:0016973 | poly(A)+ mRNA export from nucleus(GO:0016973) |
| 0.2 | 1.8 | GO:0046473 | phosphatidic acid metabolic process(GO:0046473) |
| 0.2 | 0.7 | GO:0006984 | ER-nucleus signaling pathway(GO:0006984) |
| 0.2 | 0.9 | GO:0019740 | nitrogen utilization(GO:0019740) |
| 0.2 | 0.9 | GO:0016560 | protein import into peroxisome matrix, docking(GO:0016560) protein to membrane docking(GO:0022615) |
| 0.2 | 0.9 | GO:0006435 | threonyl-tRNA aminoacylation(GO:0006435) |
| 0.2 | 3.2 | GO:0071324 | cellular response to disaccharide stimulus(GO:0071324) cellular response to sucrose stimulus(GO:0071329) |
| 0.2 | 1.3 | GO:2000306 | positive regulation of photomorphogenesis(GO:2000306) |
| 0.2 | 0.9 | GO:0010589 | leaf proximal/distal pattern formation(GO:0010589) |
| 0.2 | 1.1 | GO:0006106 | fumarate metabolic process(GO:0006106) |
| 0.2 | 1.3 | GO:0006531 | aspartate metabolic process(GO:0006531) |
| 0.2 | 1.3 | GO:1904961 | quiescent center organization(GO:1904961) |
| 0.2 | 0.6 | GO:0045117 | thiamine pyrophosphate transport(GO:0030974) vitamin transmembrane transport(GO:0035461) azole transport(GO:0045117) |
| 0.2 | 2.1 | GO:0017183 | peptidyl-diphthamide metabolic process(GO:0017182) peptidyl-diphthamide biosynthetic process from peptidyl-histidine(GO:0017183) peptidyl-histidine modification(GO:0018202) |
| 0.2 | 3.2 | GO:0010078 | maintenance of root meristem identity(GO:0010078) |
| 0.2 | 1.5 | GO:0090059 | protoxylem development(GO:0090059) |
| 0.2 | 1.0 | GO:0042550 | photosystem I stabilization(GO:0042550) |
| 0.2 | 9.6 | GO:0006099 | tricarboxylic acid cycle(GO:0006099) citrate metabolic process(GO:0006101) |
| 0.2 | 3.1 | GO:0006002 | fructose 6-phosphate metabolic process(GO:0006002) |
| 0.2 | 0.8 | GO:0061087 | positive regulation of histone H3-K27 methylation(GO:0061087) |
| 0.2 | 2.5 | GO:0052325 | cell wall pectin biosynthetic process(GO:0052325) |
| 0.2 | 0.8 | GO:0045763 | negative regulation of ethylene biosynthetic process(GO:0010366) negative regulation of sulfur amino acid metabolic process(GO:0031336) negative regulation of cellular amine metabolic process(GO:0033239) negative regulation of cellular amino acid metabolic process(GO:0045763) negative regulation of sulfur metabolic process(GO:0051175) negative regulation of olefin metabolic process(GO:1900909) negative regulation of olefin biosynthetic process(GO:1900912) |
| 0.2 | 0.8 | GO:0036473 | cell death in response to oxidative stress(GO:0036473) programmed cell death in response to reactive oxygen species(GO:0097468) |
| 0.2 | 2.0 | GO:0052548 | negative regulation of endopeptidase activity(GO:0010951) regulation of endopeptidase activity(GO:0052548) |
| 0.2 | 1.4 | GO:0071588 | hydrogen peroxide mediated signaling pathway(GO:0071588) |
| 0.2 | 0.6 | GO:0042256 | mature ribosome assembly(GO:0042256) |
| 0.2 | 1.0 | GO:0006517 | protein deglycosylation(GO:0006517) |
| 0.2 | 2.2 | GO:0051446 | positive regulation of meiotic cell cycle(GO:0051446) |
| 0.2 | 0.8 | GO:1905157 | positive regulation of photosynthesis(GO:1905157) |
| 0.2 | 0.6 | GO:0051341 | regulation of oxidoreductase activity(GO:0051341) |
| 0.2 | 0.8 | GO:0030174 | regulation of DNA-dependent DNA replication initiation(GO:0030174) |
| 0.2 | 1.8 | GO:0033517 | myo-inositol hexakisphosphate biosynthetic process(GO:0010264) myo-inositol hexakisphosphate metabolic process(GO:0033517) |
| 0.2 | 1.4 | GO:0051418 | interphase microtubule nucleation by interphase microtubule organizing center(GO:0051415) microtubule nucleation by microtubule organizing center(GO:0051418) |
| 0.2 | 0.4 | GO:0006183 | GTP biosynthetic process(GO:0006183) |
| 0.2 | 0.2 | GO:1901998 | toxin transport(GO:1901998) |
| 0.2 | 2.1 | GO:0010822 | positive regulation of mitochondrion organization(GO:0010822) |
| 0.2 | 7.7 | GO:0010043 | response to zinc ion(GO:0010043) |
| 0.2 | 1.0 | GO:1901004 | ubiquinone-6 metabolic process(GO:1901004) ubiquinone-6 biosynthetic process(GO:1901006) |
| 0.2 | 3.6 | GO:0009638 | phototropism(GO:0009638) |
| 0.2 | 0.8 | GO:0034635 | glutathione transport(GO:0034635) tripeptide transport(GO:0042939) |
| 0.2 | 0.6 | GO:0090058 | metaxylem development(GO:0090058) |
| 0.2 | 0.6 | GO:0090239 | regulation of histone H4 acetylation(GO:0090239) |
| 0.2 | 1.5 | GO:0070828 | heterochromatin organization(GO:0070828) |
| 0.2 | 0.9 | GO:0046500 | S-adenosylmethionine metabolic process(GO:0046500) |
| 0.2 | 1.1 | GO:0046085 | adenosine metabolic process(GO:0046085) |
| 0.2 | 0.6 | GO:0080178 | 5-carbamoylmethyl uridine residue modification(GO:0080178) |
| 0.2 | 0.9 | GO:1901332 | negative regulation of lateral root development(GO:1901332) |
| 0.2 | 1.1 | GO:0010036 | response to boron-containing substance(GO:0010036) |
| 0.2 | 0.6 | GO:0007112 | male meiosis cytokinesis(GO:0007112) |
| 0.2 | 0.7 | GO:0009855 | determination of bilateral symmetry(GO:0009855) |
| 0.2 | 0.5 | GO:0006432 | phenylalanyl-tRNA aminoacylation(GO:0006432) |
| 0.2 | 0.5 | GO:0009805 | coumarin biosynthetic process(GO:0009805) |
| 0.2 | 0.5 | GO:0071047 | U1 snRNA 3'-end processing(GO:0034473) U5 snRNA 3'-end processing(GO:0034476) nuclear polyadenylation-dependent mRNA catabolic process(GO:0071042) polyadenylation-dependent mRNA catabolic process(GO:0071047) |
| 0.2 | 1.3 | GO:0010236 | plastoquinone biosynthetic process(GO:0010236) |
| 0.2 | 0.9 | GO:1900384 | regulation of flavonol biosynthetic process(GO:1900384) |
| 0.2 | 6.6 | GO:0002181 | cytoplasmic translation(GO:0002181) |
| 0.2 | 0.9 | GO:0010032 | meiotic chromosome condensation(GO:0010032) |
| 0.2 | 1.1 | GO:0019408 | dolichol biosynthetic process(GO:0019408) |
| 0.2 | 0.5 | GO:0090213 | regulation of radial pattern formation(GO:0090213) |
| 0.2 | 2.7 | GO:0071428 | ribosomal subunit export from nucleus(GO:0000054) ribosome localization(GO:0033750) establishment of ribosome localization(GO:0033753) rRNA-containing ribonucleoprotein complex export from nucleus(GO:0071428) |
| 0.2 | 0.5 | GO:1905181 | regulation of urease activity(GO:1905181) positive regulation of urease activity(GO:1905182) |
| 0.2 | 0.9 | GO:0010376 | stomatal complex formation(GO:0010376) |
| 0.2 | 3.9 | GO:0015985 | ATP biosynthetic process(GO:0006754) purine nucleoside triphosphate biosynthetic process(GO:0009145) purine ribonucleoside triphosphate biosynthetic process(GO:0009206) energy coupled proton transport, down electrochemical gradient(GO:0015985) ATP synthesis coupled proton transport(GO:0015986) |
| 0.2 | 1.8 | GO:0010232 | vascular transport(GO:0010232) phloem transport(GO:0010233) |
| 0.2 | 0.5 | GO:0015812 | gamma-aminobutyric acid transport(GO:0015812) |
| 0.2 | 1.2 | GO:0006542 | glutamine biosynthetic process(GO:0006542) |
| 0.2 | 1.7 | GO:0010031 | circumnutation(GO:0010031) multicellular organismal movement(GO:0050879) |
| 0.2 | 0.7 | GO:0016578 | histone deubiquitination(GO:0016578) |
| 0.2 | 0.7 | GO:0006379 | mRNA cleavage(GO:0006379) |
| 0.2 | 0.7 | GO:1902916 | regulation of protein polyubiquitination(GO:1902914) positive regulation of protein polyubiquitination(GO:1902916) |
| 0.2 | 0.3 | GO:0046104 | deoxyribonucleoside metabolic process(GO:0009120) thymidine metabolic process(GO:0046104) pyrimidine deoxyribonucleoside metabolic process(GO:0046125) |
| 0.2 | 0.3 | GO:0030026 | cellular manganese ion homeostasis(GO:0030026) |
| 0.2 | 0.5 | GO:0051639 | actin filament network formation(GO:0051639) |
| 0.2 | 0.8 | GO:0048578 | positive regulation of long-day photoperiodism, flowering(GO:0048578) |
| 0.2 | 1.4 | GO:0010315 | auxin efflux(GO:0010315) |
| 0.2 | 1.5 | GO:0006656 | phosphatidylcholine biosynthetic process(GO:0006656) |
| 0.2 | 3.9 | GO:0010167 | response to nitrate(GO:0010167) |
| 0.2 | 0.5 | GO:0016094 | polyprenol biosynthetic process(GO:0016094) |
| 0.2 | 0.5 | GO:0050686 | negative regulation of mRNA 3'-end processing(GO:0031441) negative regulation of mRNA processing(GO:0050686) negative regulation of mRNA polyadenylation(GO:1900364) negative regulation of mRNA metabolic process(GO:1903312) |
| 0.2 | 1.2 | GO:0005513 | detection of calcium ion(GO:0005513) |
| 0.2 | 0.5 | GO:0071731 | response to nitric oxide(GO:0071731) |
| 0.2 | 1.1 | GO:0000184 | nuclear-transcribed mRNA catabolic process, nonsense-mediated decay(GO:0000184) |
| 0.2 | 1.1 | GO:1904481 | L-serine catabolic process(GO:0006565) glycine biosynthetic process from serine(GO:0019264) response to tetrahydrofolate(GO:1904481) cellular response to tetrahydrofolate(GO:1904482) |
| 0.2 | 1.5 | GO:0044000 | movement in host(GO:0044000) transport of virus in multicellular host(GO:0046739) movement in other organism involved in symbiotic interaction(GO:0051814) movement in host environment(GO:0052126) movement in environment of other organism involved in symbiotic interaction(GO:0052192) |
| 0.2 | 0.5 | GO:0016540 | protein autoprocessing(GO:0016540) |
| 0.2 | 0.6 | GO:0006427 | histidyl-tRNA aminoacylation(GO:0006427) |
| 0.2 | 0.2 | GO:1902315 | cell cycle DNA replication initiation(GO:1902292) nuclear cell cycle DNA replication initiation(GO:1902315) mitotic DNA replication initiation(GO:1902975) |
| 0.2 | 4.9 | GO:0010143 | cutin biosynthetic process(GO:0010143) |
| 0.2 | 0.6 | GO:0000012 | single strand break repair(GO:0000012) |
| 0.2 | 0.6 | GO:0009557 | antipodal cell differentiation(GO:0009557) |
| 0.2 | 0.5 | GO:1902446 | regulation of shade avoidance(GO:1902446) positive regulation of shade avoidance(GO:1902448) |
| 0.2 | 0.3 | GO:0018027 | peptidyl-lysine dimethylation(GO:0018027) |
| 0.2 | 0.8 | GO:0009558 | embryo sac cellularization(GO:0009558) |
| 0.2 | 2.2 | GO:0009113 | purine nucleobase biosynthetic process(GO:0009113) |
| 0.2 | 0.5 | GO:0000972 | transcription-dependent tethering of RNA polymerase II gene DNA at nuclear periphery(GO:0000972) |
| 0.2 | 0.9 | GO:0000719 | photoreactive repair(GO:0000719) |
| 0.2 | 0.5 | GO:0070536 | protein K63-linked deubiquitination(GO:0070536) |
| 0.2 | 0.8 | GO:0006421 | asparaginyl-tRNA aminoacylation(GO:0006421) |
| 0.2 | 0.5 | GO:0019365 | pyridine nucleotide salvage(GO:0019365) |
| 0.2 | 0.6 | GO:0046622 | positive regulation of organ growth(GO:0046622) |
| 0.2 | 2.9 | GO:0042761 | very long-chain fatty acid biosynthetic process(GO:0042761) |
| 0.1 | 0.9 | GO:0051775 | response to redox state(GO:0051775) |
| 0.1 | 1.2 | GO:0061727 | lactate metabolic process(GO:0006089) methylglyoxal metabolic process(GO:0009438) methylglyoxal catabolic process to D-lactate via S-lactoyl-glutathione(GO:0019243) ketone catabolic process(GO:0042182) methylglyoxal catabolic process(GO:0051596) methylglyoxal catabolic process to lactate(GO:0061727) |
| 0.1 | 0.4 | GO:0048478 | replication fork protection(GO:0048478) |
| 0.1 | 1.5 | GO:0007008 | outer mitochondrial membrane organization(GO:0007008) protein import into mitochondrial outer membrane(GO:0045040) |
| 0.1 | 0.3 | GO:0010235 | guard mother cell cytokinesis(GO:0010235) |
| 0.1 | 1.2 | GO:0007006 | mitochondrial membrane organization(GO:0007006) |
| 0.1 | 0.4 | GO:0019919 | peptidyl-arginine methylation, to asymmetrical-dimethyl arginine(GO:0019919) histone arginine methylation(GO:0034969) peptidyl-arginine N-methylation(GO:0035246) peptidyl-arginine omega-N-methylation(GO:0035247) |
| 0.1 | 0.7 | GO:0030242 | pexophagy(GO:0030242) |
| 0.1 | 1.3 | GO:0005986 | sucrose biosynthetic process(GO:0005986) |
| 0.1 | 0.3 | GO:0036265 | RNA (guanine-N7)-methylation(GO:0036265) rRNA (guanine-N7)-methylation(GO:0070476) |
| 0.1 | 4.0 | GO:0000462 | maturation of SSU-rRNA from tricistronic rRNA transcript (SSU-rRNA, 5.8S rRNA, LSU-rRNA)(GO:0000462) |
| 0.1 | 0.6 | GO:0006409 | tRNA export from nucleus(GO:0006409) tRNA transport(GO:0051031) tRNA-containing ribonucleoprotein complex export from nucleus(GO:0071431) |
| 0.1 | 2.0 | GO:0010100 | negative regulation of photomorphogenesis(GO:0010100) |
| 0.1 | 0.6 | GO:0035308 | negative regulation of dephosphorylation(GO:0035305) negative regulation of protein dephosphorylation(GO:0035308) |
| 0.1 | 4.1 | GO:0006413 | translational initiation(GO:0006413) |
| 0.1 | 1.3 | GO:0006855 | drug transmembrane transport(GO:0006855) |
| 0.1 | 0.7 | GO:0031022 | nuclear migration along microfilament(GO:0031022) |
| 0.1 | 0.8 | GO:0071267 | L-methionine biosynthetic process from methylthioadenosine(GO:0019509) amino acid salvage(GO:0043102) L-methionine salvage(GO:0071267) |
| 0.1 | 1.8 | GO:0010192 | mucilage biosynthetic process(GO:0010192) |
| 0.1 | 1.0 | GO:0030490 | maturation of SSU-rRNA(GO:0030490) |
| 0.1 | 0.5 | GO:0019427 | acetyl-CoA biosynthetic process from acetate(GO:0019427) |
| 0.1 | 0.7 | GO:0070863 | regulation of protein exit from endoplasmic reticulum(GO:0070861) positive regulation of protein exit from endoplasmic reticulum(GO:0070863) |
| 0.1 | 2.5 | GO:1904029 | regulation of cyclin-dependent protein serine/threonine kinase activity(GO:0000079) regulation of cyclin-dependent protein kinase activity(GO:1904029) |
| 0.1 | 1.6 | GO:0010039 | response to iron ion(GO:0010039) |
| 0.1 | 1.2 | GO:0097428 | protein maturation by iron-sulfur cluster transfer(GO:0097428) |
| 0.1 | 1.6 | GO:0018026 | peptidyl-lysine monomethylation(GO:0018026) |
| 0.1 | 1.6 | GO:0019375 | galactolipid biosynthetic process(GO:0019375) |
| 0.1 | 0.8 | GO:0032412 | regulation of anion channel activity(GO:0010359) regulation of transmembrane transporter activity(GO:0022898) regulation of ion transmembrane transporter activity(GO:0032412) |
| 0.1 | 1.6 | GO:0005987 | sucrose catabolic process(GO:0005987) |
| 0.1 | 0.4 | GO:0010113 | negative regulation of systemic acquired resistance(GO:0010113) |
| 0.1 | 3.9 | GO:0010268 | brassinosteroid homeostasis(GO:0010268) |
| 0.1 | 0.3 | GO:0010395 | rhamnogalacturonan I metabolic process(GO:0010395) |
| 0.1 | 0.7 | GO:0030007 | cellular potassium ion homeostasis(GO:0030007) |
| 0.1 | 0.5 | GO:0070676 | intralumenal vesicle formation(GO:0070676) |
| 0.1 | 2.2 | GO:0055070 | copper ion homeostasis(GO:0055070) |
| 0.1 | 1.0 | GO:0006655 | phosphatidylglycerol biosynthetic process(GO:0006655) |
| 0.1 | 0.9 | GO:0032465 | regulation of cytokinesis(GO:0032465) |
| 0.1 | 0.6 | GO:1903322 | positive regulation of protein modification by small protein conjugation or removal(GO:1903322) |
| 0.1 | 0.4 | GO:0042787 | protein ubiquitination involved in ubiquitin-dependent protein catabolic process(GO:0042787) regulation of protein ubiquitination involved in ubiquitin-dependent protein catabolic process(GO:2000058) |
| 0.1 | 0.6 | GO:0009298 | GDP-mannose biosynthetic process(GO:0009298) |
| 0.1 | 0.6 | GO:0070072 | vacuolar proton-transporting V-type ATPase complex assembly(GO:0070072) |
| 0.1 | 1.5 | GO:0060261 | regulation of transcription initiation from RNA polymerase II promoter(GO:0060260) positive regulation of transcription initiation from RNA polymerase II promoter(GO:0060261) positive regulation of DNA-templated transcription, initiation(GO:2000144) |
| 0.1 | 0.6 | GO:0052546 | cell wall pectin metabolic process(GO:0052546) |
| 0.1 | 2.1 | GO:0001678 | cellular glucose homeostasis(GO:0001678) |
| 0.1 | 0.1 | GO:0051101 | regulation of DNA binding(GO:0051101) |
| 0.1 | 1.7 | GO:0050777 | negative regulation of immune response(GO:0050777) |
| 0.1 | 1.1 | GO:0052324 | plant-type cell wall cellulose biosynthetic process(GO:0052324) |
| 0.1 | 3.1 | GO:0010499 | proteasomal ubiquitin-independent protein catabolic process(GO:0010499) |
| 0.1 | 0.6 | GO:0034308 | primary alcohol metabolic process(GO:0034308) |
| 0.1 | 1.0 | GO:0009854 | oxidative photosynthetic carbon pathway(GO:0009854) |
| 0.1 | 1.4 | GO:0006301 | postreplication repair(GO:0006301) |
| 0.1 | 2.3 | GO:0031425 | chloroplast RNA processing(GO:0031425) |
| 0.1 | 3.1 | GO:0031145 | anaphase-promoting complex-dependent catabolic process(GO:0031145) |
| 0.1 | 0.2 | GO:0090421 | embryonic meristem initiation(GO:0090421) |
| 0.1 | 0.4 | GO:0006386 | termination of RNA polymerase III transcription(GO:0006386) |
| 0.1 | 3.6 | GO:0072655 | protein targeting to mitochondrion(GO:0006626) protein localization to mitochondrion(GO:0070585) establishment of protein localization to mitochondrion(GO:0072655) |
| 0.1 | 0.1 | GO:0060967 | negative regulation of gene silencing by RNA(GO:0060967) negative regulation of RNA interference(GO:1900369) |
| 0.1 | 0.4 | GO:0071596 | ubiquitin-dependent protein catabolic process via the N-end rule pathway(GO:0071596) |
| 0.1 | 0.6 | GO:0006011 | UDP-glucose metabolic process(GO:0006011) |
| 0.1 | 0.6 | GO:0031125 | rRNA 3'-end processing(GO:0031125) |
| 0.1 | 0.5 | GO:0048629 | trichome patterning(GO:0048629) |
| 0.1 | 0.6 | GO:0015846 | polyamine transport(GO:0015846) |
| 0.1 | 0.4 | GO:0006527 | arginine catabolic process(GO:0006527) |
| 0.1 | 0.2 | GO:0006177 | GMP biosynthetic process(GO:0006177) GMP metabolic process(GO:0046037) |
| 0.1 | 0.6 | GO:0070125 | mitochondrial translational elongation(GO:0070125) |
| 0.1 | 11.3 | GO:0018209 | peptidyl-serine phosphorylation(GO:0018105) peptidyl-serine modification(GO:0018209) |
| 0.1 | 0.2 | GO:0019401 | alditol biosynthetic process(GO:0019401) |
| 0.1 | 0.6 | GO:0034059 | response to anoxia(GO:0034059) |
| 0.1 | 0.7 | GO:0006085 | acetyl-CoA biosynthetic process(GO:0006085) |
| 0.1 | 0.3 | GO:0071481 | cellular response to gamma radiation(GO:0071480) cellular response to X-ray(GO:0071481) |
| 0.1 | 1.8 | GO:0006879 | cellular iron ion homeostasis(GO:0006879) |
| 0.1 | 0.6 | GO:0006116 | NADH oxidation(GO:0006116) |
| 0.1 | 1.5 | GO:0048766 | root hair initiation(GO:0048766) |
| 0.1 | 1.3 | GO:0006360 | transcription from RNA polymerase I promoter(GO:0006360) |
| 0.1 | 0.2 | GO:0032950 | regulation of beta-glucan metabolic process(GO:0032950) regulation of beta-glucan biosynthetic process(GO:0032951) regulation of cellulose biosynthetic process(GO:2001006) |
| 0.1 | 0.5 | GO:0080168 | abscisic acid transport(GO:0080168) |
| 0.1 | 0.5 | GO:0051701 | interaction with host(GO:0051701) |
| 0.1 | 1.0 | GO:0010230 | alternative respiration(GO:0010230) |
| 0.1 | 0.2 | GO:0043268 | positive regulation of potassium ion transport(GO:0043268) |
| 0.1 | 0.9 | GO:0010065 | primary meristem tissue development(GO:0010065) |
| 0.1 | 1.5 | GO:0043248 | proteasome assembly(GO:0043248) |
| 0.1 | 0.4 | GO:0019676 | ammonia assimilation cycle(GO:0019676) |
| 0.1 | 1.3 | GO:0042726 | flavin-containing compound metabolic process(GO:0042726) |
| 0.1 | 0.3 | GO:0035019 | somatic stem cell population maintenance(GO:0035019) |
| 0.1 | 0.4 | GO:0016098 | monoterpenoid metabolic process(GO:0016098) monoterpenoid biosynthetic process(GO:0016099) |
| 0.1 | 0.2 | GO:0006102 | isocitrate metabolic process(GO:0006102) |
| 0.1 | 0.3 | GO:0010372 | positive regulation of gibberellin biosynthetic process(GO:0010372) |
| 0.1 | 0.7 | GO:0048830 | adventitious root development(GO:0048830) |
| 0.1 | 0.3 | GO:0030031 | cell projection organization(GO:0030030) cell projection assembly(GO:0030031) |
| 0.1 | 3.8 | GO:0042273 | ribosomal large subunit biogenesis(GO:0042273) |
| 0.1 | 0.9 | GO:0043489 | RNA stabilization(GO:0043489) |
| 0.1 | 0.6 | GO:0000966 | RNA 5'-end processing(GO:0000966) |
| 0.1 | 1.1 | GO:0009166 | nucleotide catabolic process(GO:0009166) |
| 0.1 | 0.1 | GO:0048359 | mucilage metabolic process involved in seed coat development(GO:0048359) |
| 0.1 | 0.7 | GO:2000762 | regulation of phenylpropanoid metabolic process(GO:2000762) |
| 0.1 | 0.4 | GO:0019288 | isopentenyl diphosphate biosynthetic process, methylerythritol 4-phosphate pathway(GO:0019288) |
| 0.1 | 1.4 | GO:0009938 | negative regulation of gibberellic acid mediated signaling pathway(GO:0009938) |
| 0.1 | 1.0 | GO:0009088 | threonine biosynthetic process(GO:0009088) |
| 0.1 | 0.9 | GO:0033320 | UDP-D-xylose metabolic process(GO:0033319) UDP-D-xylose biosynthetic process(GO:0033320) |
| 0.1 | 0.1 | GO:0040031 | snRNA modification(GO:0040031) |
| 0.1 | 0.3 | GO:0072698 | protein localization to cytoskeleton(GO:0044380) protein localization to microtubule cytoskeleton(GO:0072698) |
| 0.1 | 1.3 | GO:0006265 | DNA topological change(GO:0006265) |
| 0.1 | 0.3 | GO:0051571 | positive regulation of histone H3-K4 methylation(GO:0051571) |
| 0.1 | 0.4 | GO:0043478 | pigment accumulation in response to UV light(GO:0043478) pigment accumulation in tissues in response to UV light(GO:0043479) pigment accumulation in tissues(GO:0043480) anthocyanin accumulation in tissues in response to UV light(GO:0043481) |
| 0.1 | 0.7 | GO:0071027 | nuclear RNA surveillance(GO:0071027) nuclear mRNA surveillance(GO:0071028) |
| 0.1 | 2.2 | GO:0072596 | protein targeting to chloroplast(GO:0045036) establishment of protein localization to chloroplast(GO:0072596) |
| 0.1 | 1.6 | GO:0015937 | coenzyme A biosynthetic process(GO:0015937) |
| 0.1 | 0.6 | GO:0055072 | iron ion homeostasis(GO:0055072) |
| 0.1 | 0.2 | GO:0006140 | regulation of nucleotide metabolic process(GO:0006140) regulation of purine nucleotide metabolic process(GO:1900542) |
| 0.1 | 1.6 | GO:0006743 | ubiquinone metabolic process(GO:0006743) ubiquinone biosynthetic process(GO:0006744) |
| 0.1 | 0.3 | GO:1902458 | positive regulation of stomatal opening(GO:1902458) |
| 0.1 | 1.1 | GO:0031365 | N-terminal protein amino acid modification(GO:0031365) |
| 0.1 | 1.1 | GO:0072505 | divalent inorganic anion homeostasis(GO:0072505) |
| 0.1 | 1.2 | GO:0071712 | ER-associated misfolded protein catabolic process(GO:0071712) |
| 0.1 | 0.2 | GO:0019673 | GDP-mannose metabolic process(GO:0019673) |
| 0.1 | 2.1 | GO:0009788 | negative regulation of abscisic acid-activated signaling pathway(GO:0009788) |
| 0.1 | 7.6 | GO:0080147 | root hair cell development(GO:0080147) |
| 0.1 | 0.2 | GO:0090603 | sieve element differentiation(GO:0090603) |
| 0.1 | 0.2 | GO:0031538 | negative regulation of anthocyanin metabolic process(GO:0031538) |
| 0.1 | 0.7 | GO:0051125 | regulation of Arp2/3 complex-mediated actin nucleation(GO:0034315) regulation of actin nucleation(GO:0051125) positive regulation of actin nucleation(GO:0051127) positive regulation of Arp2/3 complex-mediated actin nucleation(GO:2000601) |
| 0.1 | 3.3 | GO:0048510 | regulation of timing of meristematic phase transition(GO:0048506) regulation of timing of transition from vegetative to reproductive phase(GO:0048510) |
| 0.1 | 0.3 | GO:0031848 | protection from non-homologous end joining at telomere(GO:0031848) |
| 0.1 | 3.6 | GO:0042752 | regulation of circadian rhythm(GO:0042752) |
| 0.1 | 0.5 | GO:0042350 | GDP-L-fucose biosynthetic process(GO:0042350) GDP-L-fucose metabolic process(GO:0046368) |
| 0.1 | 1.0 | GO:0000002 | mitochondrial genome maintenance(GO:0000002) |
| 0.1 | 0.8 | GO:0010088 | phloem development(GO:0010088) |
| 0.1 | 0.2 | GO:0032196 | transposition(GO:0032196) |
| 0.1 | 0.4 | GO:0034720 | histone H3-K4 demethylation(GO:0034720) |
| 0.1 | 2.1 | GO:0006890 | retrograde vesicle-mediated transport, Golgi to ER(GO:0006890) |
| 0.1 | 0.2 | GO:1902583 | multi-organism intracellular transport(GO:1902583) |
| 0.1 | 0.3 | GO:0015697 | quaternary ammonium group transport(GO:0015697) |
| 0.1 | 1.4 | GO:0032511 | late endosome to vacuole transport via multivesicular body sorting pathway(GO:0032511) |
| 0.1 | 0.2 | GO:0015936 | coenzyme A metabolic process(GO:0015936) |
| 0.1 | 0.4 | GO:0042360 | vitamin E biosynthetic process(GO:0010189) vitamin E metabolic process(GO:0042360) |
| 0.1 | 0.4 | GO:0048530 | fruit morphogenesis(GO:0048530) |
| 0.1 | 1.0 | GO:0005978 | glycogen biosynthetic process(GO:0005978) |
| 0.1 | 6.0 | GO:0016579 | protein deubiquitination(GO:0016579) |
| 0.1 | 0.4 | GO:0007142 | male meiosis II(GO:0007142) |
| 0.1 | 0.3 | GO:0071569 | protein ufmylation(GO:0071569) |
| 0.1 | 0.3 | GO:1990116 | ribosome-associated ubiquitin-dependent protein catabolic process(GO:1990116) |
| 0.1 | 0.3 | GO:0016241 | regulation of macroautophagy(GO:0016241) regulation of autophagosome assembly(GO:2000785) |
| 0.1 | 0.6 | GO:0007187 | G-protein coupled receptor signaling pathway, coupled to cyclic nucleotide second messenger(GO:0007187) adenylate cyclase-modulating G-protein coupled receptor signaling pathway(GO:0007188) |
| 0.1 | 1.0 | GO:0009051 | pentose-phosphate shunt, oxidative branch(GO:0009051) |
| 0.1 | 1.5 | GO:0010072 | primary shoot apical meristem specification(GO:0010072) |
| 0.1 | 0.8 | GO:0033619 | membrane protein proteolysis(GO:0033619) |
| 0.1 | 0.2 | GO:0010225 | response to UV-C(GO:0010225) |
| 0.1 | 0.7 | GO:0044375 | regulation of peroxisome size(GO:0044375) |
| 0.1 | 0.3 | GO:1901336 | lactone metabolic process(GO:1901334) lactone biosynthetic process(GO:1901336) strigolactone metabolic process(GO:1901600) strigolactone biosynthetic process(GO:1901601) |
| 0.1 | 0.3 | GO:0006651 | diacylglycerol biosynthetic process(GO:0006651) |
| 0.1 | 0.4 | GO:1900036 | positive regulation of cellular response to heat(GO:1900036) |
| 0.1 | 0.4 | GO:0005980 | glycogen catabolic process(GO:0005980) |
| 0.1 | 0.2 | GO:0048863 | stem cell differentiation(GO:0048863) |
| 0.1 | 0.2 | GO:0098586 | virus induced gene silencing(GO:0009616) modulation by symbiont of RNA levels in host(GO:0052018) modulation of RNA levels in other organism involved in symbiotic interaction(GO:0052249) cellular response to virus(GO:0098586) |
| 0.1 | 3.2 | GO:0006418 | tRNA aminoacylation for protein translation(GO:0006418) |
| 0.1 | 0.2 | GO:0046505 | sulfolipid metabolic process(GO:0046505) sulfolipid biosynthetic process(GO:0046506) |
| 0.1 | 0.1 | GO:0010220 | positive regulation of vernalization response(GO:0010220) |
| 0.1 | 3.6 | GO:0048825 | cotyledon development(GO:0048825) |
| 0.1 | 1.8 | GO:0030042 | actin filament depolymerization(GO:0030042) |
| 0.1 | 0.4 | GO:1902767 | farnesyl diphosphate biosynthetic process, mevalonate pathway(GO:0010142) isoprenoid biosynthetic process via mevalonate(GO:1902767) |
| 0.1 | 0.2 | GO:0043171 | peptide catabolic process(GO:0043171) |
| 0.1 | 1.6 | GO:0043572 | chloroplast fission(GO:0010020) plastid fission(GO:0043572) |
| 0.1 | 1.4 | GO:0010252 | auxin homeostasis(GO:0010252) |
| 0.1 | 0.4 | GO:0048577 | negative regulation of short-day photoperiodism, flowering(GO:0048577) |
| 0.1 | 0.7 | GO:0032543 | mitochondrial translation(GO:0032543) |
| 0.1 | 2.0 | GO:0042274 | ribosomal small subunit biogenesis(GO:0042274) |
| 0.1 | 1.3 | GO:0006074 | (1->3)-beta-D-glucan metabolic process(GO:0006074) (1->3)-beta-D-glucan biosynthetic process(GO:0006075) |
| 0.1 | 0.7 | GO:0044070 | regulation of anion transport(GO:0044070) |
| 0.1 | 0.5 | GO:0090501 | RNA phosphodiester bond hydrolysis(GO:0090501) |
| 0.1 | 0.3 | GO:0006048 | UDP-N-acetylglucosamine biosynthetic process(GO:0006048) |
| 0.1 | 0.3 | GO:0042344 | indole glucosinolate catabolic process(GO:0042344) |
| 0.1 | 0.3 | GO:0080148 | negative regulation of response to water deprivation(GO:0080148) |
| 0.1 | 2.0 | GO:1900424 | regulation of defense response to bacterium(GO:1900424) |
| 0.1 | 0.6 | GO:0006904 | vesicle docking involved in exocytosis(GO:0006904) |
| 0.1 | 0.6 | GO:0048564 | photosystem I assembly(GO:0048564) |
| 0.1 | 0.2 | GO:0006513 | protein monoubiquitination(GO:0006513) |
| 0.1 | 0.1 | GO:0010447 | response to acidic pH(GO:0010447) |
| 0.1 | 0.3 | GO:0002240 | response to molecule of oomycetes origin(GO:0002240) |
| 0.1 | 0.1 | GO:0061014 | positive regulation of mRNA catabolic process(GO:0061014) |
| 0.1 | 1.6 | GO:0042631 | cellular response to water deprivation(GO:0042631) cellular response to water stimulus(GO:0071462) |
| 0.1 | 4.6 | GO:0006972 | hyperosmotic response(GO:0006972) |
| 0.1 | 0.1 | GO:0031087 | nuclear-transcribed mRNA catabolic process, deadenylation-independent decay(GO:0031086) deadenylation-independent decapping of nuclear-transcribed mRNA(GO:0031087) |
| 0.1 | 1.3 | GO:0016109 | tetraterpenoid biosynthetic process(GO:0016109) carotenoid biosynthetic process(GO:0016117) |
| 0.1 | 2.6 | GO:0019759 | S-glycoside catabolic process(GO:0016145) glycosinolate catabolic process(GO:0019759) glucosinolate catabolic process(GO:0019762) |
| 0.1 | 1.3 | GO:0000245 | spliceosomal complex assembly(GO:0000245) |
| 0.1 | 0.4 | GO:0016926 | protein desumoylation(GO:0016926) |
| 0.1 | 0.5 | GO:0071218 | cellular response to misfolded protein(GO:0071218) |
| 0.1 | 5.6 | GO:0042254 | ribosome biogenesis(GO:0042254) |
| 0.1 | 1.7 | GO:0030422 | production of siRNA involved in RNA interference(GO:0030422) |
| 0.1 | 0.3 | GO:0034508 | centromere complex assembly(GO:0034508) |
| 0.1 | 0.8 | GO:0000266 | mitochondrial fission(GO:0000266) |
| 0.1 | 0.1 | GO:0001560 | regulation of cell growth by extracellular stimulus(GO:0001560) |
| 0.1 | 0.4 | GO:0080190 | lateral growth(GO:0080190) |
| 0.1 | 1.8 | GO:0000959 | mitochondrial RNA metabolic process(GO:0000959) |
| 0.1 | 1.0 | GO:0010305 | leaf vascular tissue pattern formation(GO:0010305) |
| 0.1 | 0.4 | GO:0080183 | response to photooxidative stress(GO:0080183) |
| 0.1 | 0.6 | GO:0048764 | trichoblast maturation(GO:0048764) root hair cell differentiation(GO:0048765) |
| 0.1 | 0.4 | GO:0043100 | pyrimidine nucleobase salvage(GO:0043100) |
| 0.1 | 0.3 | GO:0000098 | sulfur amino acid catabolic process(GO:0000098) |
| 0.1 | 0.8 | GO:0061687 | detoxification of inorganic compound(GO:0061687) |
| 0.1 | 1.0 | GO:0009969 | xyloglucan biosynthetic process(GO:0009969) |
| 0.1 | 0.6 | GO:0009636 | response to toxic substance(GO:0009636) |
| 0.1 | 0.6 | GO:0006559 | L-phenylalanine catabolic process(GO:0006559) erythrose 4-phosphate/phosphoenolpyruvate family amino acid catabolic process(GO:1902222) |
| 0.1 | 0.9 | GO:0010274 | hydrotropism(GO:0010274) |
| 0.1 | 0.4 | GO:0048598 | embryonic morphogenesis(GO:0048598) |
| 0.1 | 1.4 | GO:0005985 | sucrose metabolic process(GO:0005985) |
| 0.1 | 0.1 | GO:0009726 | detection of hormone stimulus(GO:0009720) detection of endogenous stimulus(GO:0009726) |
| 0.1 | 1.8 | GO:0042026 | protein refolding(GO:0042026) |
| 0.1 | 2.7 | GO:0009631 | cold acclimation(GO:0009631) |
| 0.1 | 0.8 | GO:0001522 | pseudouridine synthesis(GO:0001522) |
| 0.1 | 0.2 | GO:0080140 | regulation of jasmonic acid metabolic process(GO:0080140) regulation of jasmonic acid biosynthetic process(GO:0080141) |
| 0.1 | 4.0 | GO:0048511 | circadian rhythm(GO:0007623) rhythmic process(GO:0048511) |
| 0.1 | 0.5 | GO:0033523 | histone H2B ubiquitination(GO:0033523) |
| 0.1 | 0.1 | GO:0071323 | cellular response to chitin(GO:0071323) |
| 0.1 | 1.1 | GO:0006401 | RNA catabolic process(GO:0006401) |
| 0.1 | 0.2 | GO:0051754 | meiotic sister chromatid cohesion, centromeric(GO:0051754) |
| 0.1 | 1.1 | GO:0009958 | positive gravitropism(GO:0009958) |
| 0.1 | 0.5 | GO:0006353 | DNA-templated transcription, termination(GO:0006353) |
| 0.1 | 0.6 | GO:1990069 | stomatal opening(GO:1990069) |
| 0.1 | 5.5 | GO:0080167 | response to karrikin(GO:0080167) |
| 0.1 | 0.9 | GO:0051028 | mRNA transport(GO:0051028) |
| 0.1 | 0.6 | GO:0033683 | nucleotide-excision repair, DNA incision(GO:0033683) |
| 0.1 | 0.2 | GO:0015691 | cadmium ion transport(GO:0015691) |
| 0.1 | 0.6 | GO:0034614 | cellular response to reactive oxygen species(GO:0034614) |
| 0.1 | 0.1 | GO:0033530 | raffinose metabolic process(GO:0033530) |
| 0.1 | 0.1 | GO:0043433 | negative regulation of sequence-specific DNA binding transcription factor activity(GO:0043433) |
| 0.1 | 0.7 | GO:1900865 | chloroplast RNA modification(GO:1900865) |
| 0.1 | 0.3 | GO:0009452 | 7-methylguanosine RNA capping(GO:0009452) RNA capping(GO:0036260) |
| 0.1 | 0.2 | GO:0010371 | regulation of gibberellin biosynthetic process(GO:0010371) |
| 0.1 | 0.7 | GO:0010375 | stomatal complex patterning(GO:0010375) |
| 0.1 | 0.5 | GO:0006488 | dolichol-linked oligosaccharide biosynthetic process(GO:0006488) |
| 0.1 | 1.8 | GO:0072666 | protein targeting to vacuole(GO:0006623) protein localization to vacuole(GO:0072665) establishment of protein localization to vacuole(GO:0072666) |
| 0.1 | 0.5 | GO:0080060 | integument development(GO:0080060) |
| 0.1 | 0.1 | GO:0055129 | L-proline biosynthetic process(GO:0055129) |
| 0.1 | 0.1 | GO:1903959 | regulation of anion transmembrane transport(GO:1903959) |
| 0.1 | 0.3 | GO:0016255 | attachment of GPI anchor to protein(GO:0016255) |
| 0.1 | 0.5 | GO:0048496 | maintenance of organ identity(GO:0048496) maintenance of floral organ identity(GO:0048497) |
| 0.1 | 0.7 | GO:0001676 | long-chain fatty acid metabolic process(GO:0001676) |
| 0.1 | 0.2 | GO:0010387 | COP9 signalosome assembly(GO:0010387) |
| 0.1 | 1.0 | GO:0051225 | spindle assembly(GO:0051225) |
| 0.1 | 13.8 | GO:0006412 | translation(GO:0006412) |
| 0.1 | 0.2 | GO:0015739 | sialic acid transport(GO:0015739) |
| 0.1 | 3.2 | GO:0007018 | microtubule-based movement(GO:0007018) |
| 0.1 | 0.9 | GO:0051085 | 'de novo' posttranslational protein folding(GO:0051084) chaperone mediated protein folding requiring cofactor(GO:0051085) |
| 0.0 | 0.5 | GO:0070973 | protein localization to endoplasmic reticulum exit site(GO:0070973) |
| 0.0 | 0.1 | GO:0046203 | spermidine catabolic process(GO:0046203) |
| 0.0 | 1.0 | GO:0010345 | suberin biosynthetic process(GO:0010345) |
| 0.0 | 0.3 | GO:0035999 | tetrahydrofolate interconversion(GO:0035999) |
| 0.0 | 0.3 | GO:0043174 | nucleoside salvage(GO:0043174) |
| 0.0 | 0.1 | GO:0015713 | phosphoglycerate transport(GO:0015713) phosphoenolpyruvate transport(GO:0015714) aldonate transport(GO:0042873) |
| 0.0 | 0.1 | GO:0030100 | regulation of endocytosis(GO:0030100) |
| 0.0 | 0.0 | GO:0000212 | meiotic spindle organization(GO:0000212) |
| 0.0 | 0.2 | GO:0018874 | benzoate metabolic process(GO:0018874) |
| 0.0 | 0.4 | GO:0006120 | mitochondrial electron transport, NADH to ubiquinone(GO:0006120) |
| 0.0 | 0.2 | GO:0045116 | protein neddylation(GO:0045116) |
| 0.0 | 0.1 | GO:0043043 | peptide biosynthetic process(GO:0043043) |
| 0.0 | 0.1 | GO:0040014 | regulation of multicellular organism growth(GO:0040014) regulation of adaxial/abaxial pattern formation(GO:2000011) |
| 0.0 | 0.2 | GO:0042989 | sequestering of actin monomers(GO:0042989) |
| 0.0 | 0.1 | GO:0031335 | regulation of ethylene biosynthetic process(GO:0010364) regulation of sulfur amino acid metabolic process(GO:0031335) regulation of olefin metabolic process(GO:1900908) regulation of olefin biosynthetic process(GO:1900911) |
| 0.0 | 0.2 | GO:0051091 | positive regulation of sequence-specific DNA binding transcription factor activity(GO:0051091) |
| 0.0 | 0.3 | GO:0010044 | response to aluminum ion(GO:0010044) |
| 0.0 | 0.3 | GO:0006624 | vacuolar protein processing(GO:0006624) |
| 0.0 | 0.4 | GO:1990748 | cellular detoxification(GO:1990748) |
| 0.0 | 0.1 | GO:0072702 | response to methyl methanesulfonate(GO:0072702) |
| 0.0 | 1.0 | GO:0006897 | endocytosis(GO:0006897) |
| 0.0 | 0.4 | GO:2001022 | positive regulation of response to DNA damage stimulus(GO:2001022) |
| 0.0 | 3.9 | GO:0006260 | DNA replication(GO:0006260) |
| 0.0 | 0.5 | GO:1901401 | regulation of tetrapyrrole metabolic process(GO:1901401) |
| 0.0 | 0.5 | GO:0006535 | cysteine biosynthetic process from serine(GO:0006535) |
| 0.0 | 0.3 | GO:0042177 | negative regulation of protein catabolic process(GO:0042177) |
| 0.0 | 0.3 | GO:0016558 | protein import into peroxisome matrix(GO:0016558) |
| 0.0 | 0.2 | GO:0001173 | DNA-templated transcriptional start site selection(GO:0001173) |
| 0.0 | 0.1 | GO:0031062 | positive regulation of histone methylation(GO:0031062) |
| 0.0 | 0.0 | GO:0045857 | regulation of molecular function, epigenetic(GO:0040030) negative regulation of molecular function, epigenetic(GO:0045857) |
| 0.0 | 0.5 | GO:1901068 | guanosine-containing compound metabolic process(GO:1901068) |
| 0.0 | 1.3 | GO:0072599 | protein targeting to ER(GO:0045047) establishment of protein localization to endoplasmic reticulum(GO:0072599) |
| 0.0 | 0.5 | GO:0045324 | late endosome to vacuole transport(GO:0045324) |
| 0.0 | 0.1 | GO:0080024 | indolebutyric acid metabolic process(GO:0080024) |
| 0.0 | 1.3 | GO:0006888 | ER to Golgi vesicle-mediated transport(GO:0006888) |
| 0.0 | 0.7 | GO:0006817 | phosphate ion transport(GO:0006817) |
| 0.0 | 0.5 | GO:0009861 | jasmonic acid and ethylene-dependent systemic resistance(GO:0009861) |
| 0.0 | 0.2 | GO:1990118 | sodium ion transmembrane transport(GO:0035725) sodium ion import(GO:0097369) inorganic cation import into cell(GO:0098659) sodium ion import across plasma membrane(GO:0098719) inorganic ion import into cell(GO:0099587) sodium ion import into cell(GO:1990118) |
| 0.0 | 0.1 | GO:0010452 | histone H3-K36 methylation(GO:0010452) |
| 0.0 | 0.3 | GO:0010244 | response to low fluence blue light stimulus by blue low-fluence system(GO:0010244) |
| 0.0 | 0.7 | GO:0046839 | phospholipid dephosphorylation(GO:0046839) phosphatidylinositol dephosphorylation(GO:0046856) |
| 0.0 | 0.2 | GO:0080113 | regulation of seed growth(GO:0080113) |
| 0.0 | 0.0 | GO:0008272 | sulfate transport(GO:0008272) |
| 0.0 | 0.4 | GO:0009089 | lysine biosynthetic process via diaminopimelate(GO:0009089) diaminopimelate metabolic process(GO:0046451) |
| 0.0 | 0.2 | GO:0046900 | tetrahydrofolylpolyglutamate metabolic process(GO:0046900) |
| 0.0 | 1.6 | GO:0009817 | defense response to fungus, incompatible interaction(GO:0009817) |
| 0.0 | 0.2 | GO:0009684 | indoleacetic acid biosynthetic process(GO:0009684) |
| 0.0 | 0.2 | GO:0015780 | nucleotide-sugar transport(GO:0015780) |
| 0.0 | 0.2 | GO:0034063 | stress granule assembly(GO:0034063) |
| 0.0 | 0.2 | GO:0051781 | positive regulation of cell division(GO:0051781) |
| 0.0 | 0.1 | GO:0007292 | female gamete generation(GO:0007292) embryo sac egg cell differentiation(GO:0009560) |
| 0.0 | 0.1 | GO:1903313 | positive regulation of RNA splicing(GO:0033120) positive regulation of mRNA processing(GO:0050685) positive regulation of mRNA metabolic process(GO:1903313) |
| 0.0 | 0.1 | GO:0015669 | gas transport(GO:0015669) |
| 0.0 | 1.0 | GO:0006749 | glutathione metabolic process(GO:0006749) |
| 0.0 | 0.2 | GO:0015919 | peroxisomal membrane transport(GO:0015919) |
| 0.0 | 0.3 | GO:0031348 | negative regulation of defense response(GO:0031348) |
| 0.0 | 0.3 | GO:0010030 | positive regulation of seed germination(GO:0010030) |
| 0.0 | 0.5 | GO:1905177 | tracheary element differentiation(GO:1905177) |
| 0.0 | 3.9 | GO:0009451 | RNA modification(GO:0009451) |
| 0.0 | 0.1 | GO:0006021 | inositol biosynthetic process(GO:0006021) |
| 0.0 | 0.6 | GO:0010227 | floral organ abscission(GO:0010227) |
| 0.0 | 0.1 | GO:0019499 | cyanide metabolic process(GO:0019499) |
| 0.0 | 1.0 | GO:0045492 | xylan biosynthetic process(GO:0045492) |
| 0.0 | 0.4 | GO:0016998 | cell wall macromolecule catabolic process(GO:0016998) |
| 0.0 | 0.1 | GO:0030656 | regulation of vitamin metabolic process(GO:0030656) regulation of L-ascorbic acid biosynthetic process(GO:2000082) |
| 0.0 | 0.3 | GO:0090487 | toxin catabolic process(GO:0009407) secondary metabolite catabolic process(GO:0090487) |
| 0.0 | 0.2 | GO:0046855 | inositol phosphate dephosphorylation(GO:0046855) inositol phosphate catabolic process(GO:0071545) |
| 0.0 | 0.4 | GO:0032200 | telomere maintenance(GO:0000723) telomere organization(GO:0032200) |
| 0.0 | 0.5 | GO:0045930 | negative regulation of mitotic cell cycle(GO:0045930) |
| 0.0 | 0.1 | GO:0006084 | acetyl-CoA metabolic process(GO:0006084) |
| 0.0 | 2.2 | GO:0006457 | protein folding(GO:0006457) |
| 0.0 | 0.5 | GO:0009292 | genetic transfer(GO:0009292) DNA mediated transformation(GO:0009294) |
| 0.0 | 0.9 | GO:0009853 | photorespiration(GO:0009853) |
| 0.0 | 0.2 | GO:1905156 | photoinhibition(GO:0010205) negative regulation of photosynthesis, light reaction(GO:0043155) negative regulation of photosynthesis(GO:1905156) |
| 0.0 | 0.5 | GO:0022618 | ribonucleoprotein complex assembly(GO:0022618) |
| 0.0 | 1.0 | GO:0006874 | cellular calcium ion homeostasis(GO:0006874) |
| 0.0 | 0.1 | GO:1900367 | positive regulation of defense response to insect(GO:1900367) |
| 0.0 | 4.1 | GO:0046686 | response to cadmium ion(GO:0046686) |
| 0.0 | 0.1 | GO:0006501 | C-terminal protein lipidation(GO:0006501) |
| 0.0 | 0.7 | GO:0007034 | vacuolar transport(GO:0007034) |
| 0.0 | 1.6 | GO:0016143 | S-glycoside metabolic process(GO:0016143) glycosinolate metabolic process(GO:0019757) glucosinolate metabolic process(GO:0019760) |
| 0.0 | 0.2 | GO:0070076 | protein demethylation(GO:0006482) protein dealkylation(GO:0008214) histone demethylation(GO:0016577) histone lysine demethylation(GO:0070076) |
| 0.0 | 0.1 | GO:0007099 | centrosome cycle(GO:0007098) centriole replication(GO:0007099) centrosome organization(GO:0051297) centrosome duplication(GO:0051298) centriole assembly(GO:0098534) |
| 0.0 | 2.4 | GO:0046777 | protein autophosphorylation(GO:0046777) |
| 0.0 | 0.7 | GO:0016575 | histone deacetylation(GO:0016575) |
| 0.0 | 0.4 | GO:0070816 | phosphorylation of RNA polymerase II C-terminal domain(GO:0070816) |
| 0.0 | 0.3 | GO:0046654 | folic acid-containing compound biosynthetic process(GO:0009396) tetrahydrofolate biosynthetic process(GO:0046654) |
| 0.0 | 0.2 | GO:0010158 | abaxial cell fate specification(GO:0010158) |
| 0.0 | 0.7 | GO:0000209 | protein polyubiquitination(GO:0000209) |
| 0.0 | 0.2 | GO:0055075 | potassium ion homeostasis(GO:0055075) |
| 0.0 | 0.3 | GO:0010103 | stomatal complex morphogenesis(GO:0010103) |
| 0.0 | 0.6 | GO:0051726 | regulation of cell cycle(GO:0051726) |
| 0.0 | 3.8 | GO:0016311 | dephosphorylation(GO:0016311) |
| 0.0 | 0.1 | GO:0032881 | regulation of polysaccharide metabolic process(GO:0032881) |
| 0.0 | 0.1 | GO:0051601 | exocyst localization(GO:0051601) |
| 0.0 | 0.7 | GO:0006333 | chromatin assembly or disassembly(GO:0006333) |
| 0.0 | 0.2 | GO:0015718 | monocarboxylic acid transport(GO:0015718) |
| 0.0 | 0.1 | GO:0036297 | interstrand cross-link repair(GO:0036297) |
| 0.0 | 0.2 | GO:1900150 | regulation of defense response to fungus(GO:1900150) |
| 0.0 | 0.1 | GO:0009102 | biotin metabolic process(GO:0006768) biotin biosynthetic process(GO:0009102) |
| 0.0 | 0.1 | GO:0006122 | mitochondrial electron transport, ubiquinol to cytochrome c(GO:0006122) |
| 0.0 | 0.1 | GO:0040034 | regulation of development, heterochronic(GO:0040034) |
| 0.0 | 0.1 | GO:1902183 | regulation of shoot apical meristem development(GO:1902183) |
| 0.0 | 0.6 | GO:0042176 | regulation of protein catabolic process(GO:0042176) |
| 0.0 | 10.0 | GO:0006468 | protein phosphorylation(GO:0006468) |
| 0.0 | 0.2 | GO:0010089 | xylem development(GO:0010089) |
| 0.0 | 0.5 | GO:0098656 | anion transmembrane transport(GO:0098656) |
| 0.0 | 0.8 | GO:0015994 | chlorophyll metabolic process(GO:0015994) |
| 0.0 | 0.1 | GO:0010258 | NADH dehydrogenase complex (plastoquinone) assembly(GO:0010258) |
| 0.0 | 0.1 | GO:0043967 | histone H4 acetylation(GO:0043967) |
| 0.0 | 0.2 | GO:0046520 | sphingoid biosynthetic process(GO:0046520) |
| 0.0 | 0.1 | GO:0009156 | ribonucleoside monophosphate biosynthetic process(GO:0009156) |
| 0.0 | 0.1 | GO:0006607 | NLS-bearing protein import into nucleus(GO:0006607) |
| 0.0 | 0.1 | GO:0046786 | viral replication complex formation and maintenance(GO:0046786) |
| 0.0 | 0.1 | GO:0046341 | CDP-diacylglycerol biosynthetic process(GO:0016024) CDP-diacylglycerol metabolic process(GO:0046341) |
| 0.0 | 0.1 | GO:0000712 | resolution of meiotic recombination intermediates(GO:0000712) |
| 0.0 | 0.1 | GO:1903830 | magnesium ion transmembrane transport(GO:1903830) |
| 0.0 | 1.2 | GO:0043413 | protein glycosylation(GO:0006486) glycoprotein biosynthetic process(GO:0009101) macromolecule glycosylation(GO:0043413) |
| 0.0 | 0.0 | GO:0010275 | NAD(P)H dehydrogenase complex assembly(GO:0010275) |
| 0.0 | 0.1 | GO:0044030 | regulation of DNA methylation(GO:0044030) |
| 0.0 | 0.2 | GO:0009959 | negative gravitropism(GO:0009959) |
| 0.0 | 0.0 | GO:0002758 | pattern recognition receptor signaling pathway(GO:0002221) immune response-activating signal transduction(GO:0002757) innate immune response-activating signal transduction(GO:0002758) |
| 0.0 | 0.0 | GO:0045910 | negative regulation of DNA recombination(GO:0045910) |
Gene overrepresentation in cellular component category:
| Log-likelihood per target | Total log-likelihood | Term | Description |
|---|---|---|---|
| 0.6 | 2.5 | GO:0031314 | extrinsic component of mitochondrial inner membrane(GO:0031314) |
| 0.6 | 1.7 | GO:0000015 | phosphopyruvate hydratase complex(GO:0000015) |
| 0.5 | 1.9 | GO:0005967 | mitochondrial pyruvate dehydrogenase complex(GO:0005967) |
| 0.5 | 2.8 | GO:0000276 | mitochondrial proton-transporting ATP synthase complex, coupling factor F(o)(GO:0000276) |
| 0.4 | 1.2 | GO:0045178 | basal plasma membrane(GO:0009925) basolateral plasma membrane(GO:0016323) basal part of cell(GO:0045178) |
| 0.4 | 1.6 | GO:0018444 | translation release factor complex(GO:0018444) |
| 0.4 | 1.9 | GO:0071541 | eukaryotic translation initiation factor 3 complex, eIF3m(GO:0071541) |
| 0.4 | 0.4 | GO:0005960 | glycine cleavage complex(GO:0005960) |
| 0.4 | 3.6 | GO:0031428 | box C/D snoRNP complex(GO:0031428) |
| 0.4 | 1.1 | GO:0042709 | succinate-CoA ligase complex(GO:0042709) |
| 0.3 | 1.7 | GO:0010007 | magnesium chelatase complex(GO:0010007) |
| 0.3 | 1.0 | GO:0005785 | signal recognition particle receptor complex(GO:0005785) |
| 0.3 | 1.6 | GO:0070993 | translation preinitiation complex(GO:0070993) |
| 0.3 | 2.3 | GO:0030897 | HOPS complex(GO:0030897) |
| 0.3 | 0.6 | GO:0045254 | pyruvate dehydrogenase complex(GO:0045254) |
| 0.3 | 2.8 | GO:0045252 | oxoglutarate dehydrogenase complex(GO:0045252) |
| 0.3 | 1.2 | GO:0032155 | equatorial microtubule organizing center(GO:0000923) cell division site part(GO:0032155) |
| 0.3 | 1.8 | GO:0001405 | presequence translocase-associated import motor(GO:0001405) |
| 0.3 | 2.9 | GO:0042555 | MCM complex(GO:0042555) |
| 0.3 | 2.2 | GO:0005956 | protein kinase CK2 complex(GO:0005956) |
| 0.3 | 0.8 | GO:0031390 | Ctf18 RFC-like complex(GO:0031390) |
| 0.3 | 1.0 | GO:0030681 | nucleolar ribonuclease P complex(GO:0005655) multimeric ribonuclease P complex(GO:0030681) |
| 0.3 | 1.3 | GO:0033597 | mitotic checkpoint complex(GO:0033597) |
| 0.2 | 0.7 | GO:0034457 | Mpp10 complex(GO:0034457) |
| 0.2 | 1.2 | GO:0030126 | COPI vesicle coat(GO:0030126) COPI-coated vesicle membrane(GO:0030663) |
| 0.2 | 3.9 | GO:0030686 | 90S preribosome(GO:0030686) |
| 0.2 | 1.0 | GO:0032153 | cell division site(GO:0032153) |
| 0.2 | 1.7 | GO:0042406 | extrinsic component of endoplasmic reticulum membrane(GO:0042406) |
| 0.2 | 3.3 | GO:0008541 | proteasome regulatory particle, lid subcomplex(GO:0008541) |
| 0.2 | 0.9 | GO:0009330 | DNA topoisomerase complex (ATP-hydrolyzing)(GO:0009330) |
| 0.2 | 0.7 | GO:0016328 | lateral plasma membrane(GO:0016328) |
| 0.2 | 1.6 | GO:0005850 | eukaryotic translation initiation factor 2 complex(GO:0005850) |
| 0.2 | 3.4 | GO:0030687 | preribosome, large subunit precursor(GO:0030687) |
| 0.2 | 0.7 | GO:0098553 | integral component of lumenal side of endoplasmic reticulum membrane(GO:0071556) lumenal side of endoplasmic reticulum membrane(GO:0098553) lumenal side of membrane(GO:0098576) |
| 0.2 | 1.9 | GO:0005677 | chromatin silencing complex(GO:0005677) |
| 0.2 | 0.6 | GO:0031417 | N-terminal protein acetyltransferase complex(GO:0031414) NatC complex(GO:0031417) |
| 0.2 | 0.6 | GO:0005697 | telomerase holoenzyme complex(GO:0005697) |
| 0.2 | 2.0 | GO:0001401 | mitochondrial sorting and assembly machinery complex(GO:0001401) |
| 0.2 | 3.9 | GO:0005852 | eukaryotic translation initiation factor 3 complex(GO:0005852) |
| 0.2 | 2.2 | GO:0005832 | chaperonin-containing T-complex(GO:0005832) |
| 0.2 | 0.8 | GO:0042721 | mitochondrial inner membrane protein insertion complex(GO:0042721) |
| 0.2 | 0.8 | GO:0015030 | Cajal body(GO:0015030) |
| 0.2 | 1.0 | GO:0005851 | eukaryotic translation initiation factor 2B complex(GO:0005851) |
| 0.2 | 1.2 | GO:0005845 | mRNA cap binding complex(GO:0005845) |
| 0.2 | 1.2 | GO:0034098 | VCP-NPL4-UFD1 AAA ATPase complex(GO:0034098) |
| 0.2 | 1.1 | GO:0000164 | protein phosphatase type 1 complex(GO:0000164) |
| 0.2 | 3.1 | GO:0019773 | proteasome core complex, alpha-subunit complex(GO:0019773) |
| 0.2 | 0.7 | GO:0010330 | cellulose synthase complex(GO:0010330) |
| 0.2 | 0.7 | GO:0005942 | phosphatidylinositol 3-kinase complex(GO:0005942) phosphatidylinositol 3-kinase complex, class III, type I(GO:0034271) phosphatidylinositol 3-kinase complex, class III, type II(GO:0034272) phosphatidylinositol 3-kinase complex, class III(GO:0035032) |
| 0.2 | 2.1 | GO:0045298 | tubulin complex(GO:0045298) |
| 0.2 | 1.2 | GO:0090395 | plant cell papilla(GO:0090395) |
| 0.2 | 0.5 | GO:0032299 | ribonuclease H2 complex(GO:0032299) |
| 0.2 | 1.7 | GO:0071014 | post-mRNA release spliceosomal complex(GO:0071014) |
| 0.2 | 3.8 | GO:0005736 | DNA-directed RNA polymerase I complex(GO:0005736) |
| 0.2 | 0.5 | GO:0032432 | actin filament bundle(GO:0032432) |
| 0.2 | 3.0 | GO:0000792 | heterochromatin(GO:0000792) |
| 0.2 | 1.2 | GO:0033588 | Elongator holoenzyme complex(GO:0033588) |
| 0.2 | 1.3 | GO:0070531 | BRCA1-A complex(GO:0070531) |
| 0.2 | 0.7 | GO:0010316 | pyrophosphate-dependent phosphofructokinase complex(GO:0010316) |
| 0.2 | 0.7 | GO:0000811 | GINS complex(GO:0000811) |
| 0.2 | 0.5 | GO:0031897 | Tic complex(GO:0031897) |
| 0.2 | 1.1 | GO:0000808 | origin recognition complex(GO:0000808) nuclear origin of replication recognition complex(GO:0005664) |
| 0.2 | 1.5 | GO:0035861 | site of double-strand break(GO:0035861) |
| 0.1 | 0.7 | GO:0030688 | preribosome, small subunit precursor(GO:0030688) |
| 0.1 | 0.7 | GO:0009897 | external side of plasma membrane(GO:0009897) |
| 0.1 | 0.9 | GO:0000796 | condensin complex(GO:0000796) |
| 0.1 | 7.9 | GO:0009707 | chloroplast outer membrane(GO:0009707) |
| 0.1 | 1.2 | GO:0005844 | polysome(GO:0005844) |
| 0.1 | 0.1 | GO:0000172 | ribonuclease MRP complex(GO:0000172) |
| 0.1 | 0.8 | GO:0009360 | DNA polymerase III complex(GO:0009360) |
| 0.1 | 2.6 | GO:0009898 | cytoplasmic side of plasma membrane(GO:0009898) |
| 0.1 | 1.4 | GO:0072546 | ER membrane protein complex(GO:0072546) |
| 0.1 | 1.5 | GO:0005665 | DNA-directed RNA polymerase II, core complex(GO:0005665) |
| 0.1 | 17.3 | GO:0022625 | cytosolic large ribosomal subunit(GO:0022625) |
| 0.1 | 3.2 | GO:0010494 | cytoplasmic stress granule(GO:0010494) |
| 0.1 | 0.7 | GO:0034657 | GID complex(GO:0034657) |
| 0.1 | 3.7 | GO:0055028 | cortical microtubule(GO:0055028) |
| 0.1 | 1.3 | GO:0010168 | ER body(GO:0010168) |
| 0.1 | 0.4 | GO:0044614 | nuclear pore cytoplasmic filaments(GO:0044614) |
| 0.1 | 0.9 | GO:0031371 | ubiquitin conjugating enzyme complex(GO:0031371) UBC13-MMS2 complex(GO:0031372) |
| 0.1 | 1.0 | GO:0035619 | root hair tip(GO:0035619) |
| 0.1 | 0.5 | GO:0000220 | vacuolar proton-transporting V-type ATPase, V0 domain(GO:0000220) |
| 0.1 | 0.6 | GO:0030141 | secretory granule(GO:0030141) |
| 0.1 | 3.0 | GO:0030684 | preribosome(GO:0030684) |
| 0.1 | 4.7 | GO:0000137 | Golgi cis cisterna(GO:0000137) |
| 0.1 | 1.4 | GO:0005753 | mitochondrial proton-transporting ATP synthase complex(GO:0005753) |
| 0.1 | 6.7 | GO:0005797 | Golgi medial cisterna(GO:0005797) |
| 0.1 | 1.1 | GO:0000347 | THO complex(GO:0000347) |
| 0.1 | 1.1 | GO:0016272 | prefoldin complex(GO:0016272) |
| 0.1 | 0.2 | GO:0043186 | P granule(GO:0043186) pole plasm(GO:0045495) germ plasm(GO:0060293) |
| 0.1 | 0.7 | GO:0009346 | citrate lyase complex(GO:0009346) |
| 0.1 | 0.6 | GO:0009331 | glycerol-3-phosphate dehydrogenase complex(GO:0009331) |
| 0.1 | 0.3 | GO:0000814 | ESCRT II complex(GO:0000814) |
| 0.1 | 1.5 | GO:0005758 | mitochondrial intermembrane space(GO:0005758) |
| 0.1 | 2.0 | GO:0022624 | proteasome regulatory particle(GO:0005838) proteasome accessory complex(GO:0022624) |
| 0.1 | 0.3 | GO:0045261 | proton-transporting ATP synthase complex, catalytic core F(1)(GO:0045261) |
| 0.1 | 0.4 | GO:0031298 | replication fork protection complex(GO:0031298) |
| 0.1 | 0.4 | GO:0042645 | mitochondrial nucleoid(GO:0042645) |
| 0.1 | 6.3 | GO:0005770 | late endosome(GO:0005770) |
| 0.1 | 1.6 | GO:0005769 | early endosome(GO:0005769) |
| 0.1 | 0.7 | GO:0070652 | HAUS complex(GO:0070652) |
| 0.1 | 0.3 | GO:0097361 | CIA complex(GO:0097361) |
| 0.1 | 1.1 | GO:0031209 | SCAR complex(GO:0031209) |
| 0.1 | 0.6 | GO:0005673 | transcription factor TFIIE complex(GO:0005673) |
| 0.1 | 1.3 | GO:0005763 | mitochondrial small ribosomal subunit(GO:0005763) |
| 0.1 | 2.3 | GO:0005761 | mitochondrial ribosome(GO:0005761) mitochondrial large ribosomal subunit(GO:0005762) |
| 0.1 | 1.7 | GO:0005689 | U12-type spliceosomal complex(GO:0005689) |
| 0.1 | 0.4 | GO:0005672 | transcription factor TFIIA complex(GO:0005672) |
| 0.1 | 0.8 | GO:0030173 | integral component of Golgi membrane(GO:0030173) intrinsic component of Golgi membrane(GO:0031228) |
| 0.1 | 0.5 | GO:0016281 | eukaryotic translation initiation factor 4F complex(GO:0016281) |
| 0.1 | 1.6 | GO:0005744 | mitochondrial inner membrane presequence translocase complex(GO:0005744) |
| 0.1 | 0.4 | GO:0034663 | endoplasmic reticulum chaperone complex(GO:0034663) |
| 0.1 | 1.3 | GO:0000148 | 1,3-beta-D-glucan synthase complex(GO:0000148) |
| 0.1 | 2.1 | GO:0009508 | plastid chromosome(GO:0009508) |
| 0.1 | 0.5 | GO:0005782 | peroxisomal matrix(GO:0005782) microbody lumen(GO:0031907) |
| 0.1 | 0.6 | GO:0030915 | Smc5-Smc6 complex(GO:0030915) |
| 0.1 | 1.4 | GO:0048471 | perinuclear region of cytoplasm(GO:0048471) |
| 0.1 | 0.5 | GO:0005905 | clathrin-coated pit(GO:0005905) |
| 0.1 | 0.4 | GO:0031352 | intrinsic component of plastid inner membrane(GO:0031352) integral component of plastid inner membrane(GO:0031353) intrinsic component of chloroplast inner membrane(GO:0031356) integral component of chloroplast inner membrane(GO:0031357) |
| 0.1 | 3.4 | GO:0005764 | lysosome(GO:0005764) |
| 0.1 | 1.5 | GO:0070461 | SAGA-type complex(GO:0070461) |
| 0.1 | 28.0 | GO:0005730 | nucleolus(GO:0005730) |
| 0.1 | 0.6 | GO:0005662 | DNA replication factor A complex(GO:0005662) |
| 0.1 | 0.7 | GO:0009504 | cell plate(GO:0009504) |
| 0.1 | 0.3 | GO:1990112 | RQC complex(GO:1990112) |
| 0.1 | 0.4 | GO:0000938 | GARP complex(GO:0000938) |
| 0.1 | 0.7 | GO:0031464 | Cul4A-RING E3 ubiquitin ligase complex(GO:0031464) |
| 0.1 | 1.0 | GO:0000776 | kinetochore(GO:0000776) |
| 0.1 | 0.2 | GO:0030119 | AP-type membrane coat adaptor complex(GO:0030119) |
| 0.1 | 4.2 | GO:0022627 | cytosolic small ribosomal subunit(GO:0022627) |
| 0.1 | 0.4 | GO:0043078 | megasporocyte nucleus(GO:0043076) polar nucleus(GO:0043078) |
| 0.1 | 0.5 | GO:0000176 | nuclear exosome (RNase complex)(GO:0000176) |
| 0.1 | 0.2 | GO:0005853 | eukaryotic translation elongation factor 1 complex(GO:0005853) |
| 0.1 | 0.5 | GO:0005828 | kinetochore microtubule(GO:0005828) |
| 0.1 | 2.6 | GO:0000152 | nuclear ubiquitin ligase complex(GO:0000152) |
| 0.1 | 0.2 | GO:0005682 | U5 snRNP(GO:0005682) |
| 0.1 | 59.7 | GO:0005911 | cell-cell junction(GO:0005911) plasmodesma(GO:0009506) cell junction(GO:0030054) symplast(GO:0055044) |
| 0.1 | 7.2 | GO:0009705 | plant-type vacuole membrane(GO:0009705) |
| 0.1 | 0.9 | GO:0030665 | clathrin vesicle coat(GO:0030125) clathrin-coated vesicle membrane(GO:0030665) |
| 0.1 | 0.4 | GO:0031205 | endoplasmic reticulum Sec complex(GO:0031205) |
| 0.1 | 0.6 | GO:0070390 | transcription export complex 2(GO:0070390) |
| 0.1 | 1.2 | GO:0009531 | secondary cell wall(GO:0009531) |
| 0.1 | 2.1 | GO:0030134 | ER to Golgi transport vesicle(GO:0030134) |
| 0.1 | 0.2 | GO:0089701 | U2AF(GO:0089701) |
| 0.1 | 0.2 | GO:0000178 | exosome (RNase complex)(GO:0000178) |
| 0.1 | 14.3 | GO:0005768 | endosome(GO:0005768) |
| 0.1 | 0.1 | GO:0005674 | transcription factor TFIIF complex(GO:0005674) |
| 0.1 | 1.6 | GO:0000118 | histone deacetylase complex(GO:0000118) |
| 0.1 | 1.2 | GO:0000781 | chromosome, telomeric region(GO:0000781) |
| 0.1 | 0.9 | GO:0031304 | intrinsic component of mitochondrial inner membrane(GO:0031304) |
| 0.1 | 2.3 | GO:0000325 | plant-type vacuole(GO:0000325) |
| 0.1 | 0.8 | GO:0005750 | mitochondrial respiratory chain complex III(GO:0005750) respiratory chain complex III(GO:0045275) transmembrane transporter complex(GO:1902495) |
| 0.1 | 1.4 | GO:0000307 | cyclin-dependent protein kinase holoenzyme complex(GO:0000307) |
| 0.1 | 0.2 | GO:0000835 | ER ubiquitin ligase complex(GO:0000835) Hrd1p ubiquitin ligase complex(GO:0000836) Hrd1p ubiquitin ligase ERAD-L complex(GO:0000839) |
| 0.1 | 0.2 | GO:0009513 | etioplast(GO:0009513) |
| 0.1 | 1.3 | GO:0005871 | kinesin complex(GO:0005871) |
| 0.1 | 0.7 | GO:0031231 | integral component of peroxisomal membrane(GO:0005779) intrinsic component of peroxisomal membrane(GO:0031231) |
| 0.1 | 0.7 | GO:1902554 | serine/threonine protein kinase complex(GO:1902554) |
| 0.1 | 0.2 | GO:0005658 | alpha DNA polymerase:primase complex(GO:0005658) |
| 0.1 | 0.2 | GO:0044613 | nuclear pore central transport channel(GO:0044613) |
| 0.1 | 2.0 | GO:0005741 | mitochondrial outer membrane(GO:0005741) |
| 0.1 | 0.3 | GO:0042765 | GPI-anchor transamidase complex(GO:0042765) |
| 0.1 | 1.3 | GO:0008287 | protein serine/threonine phosphatase complex(GO:0008287) phosphatase complex(GO:1903293) |
| 0.1 | 3.2 | GO:0016604 | nuclear body(GO:0016604) |
| 0.0 | 0.1 | GO:0009501 | amyloplast(GO:0009501) |
| 0.0 | 0.3 | GO:0031380 | RNA-directed RNA polymerase complex(GO:0031379) nuclear RNA-directed RNA polymerase complex(GO:0031380) |
| 0.0 | 2.2 | GO:0031978 | chloroplast thylakoid lumen(GO:0009543) plastid thylakoid lumen(GO:0031978) |
| 0.0 | 2.7 | GO:0031969 | chloroplast membrane(GO:0031969) |
| 0.0 | 0.4 | GO:0005685 | U1 snRNP(GO:0005685) |
| 0.0 | 0.7 | GO:0005885 | Arp2/3 protein complex(GO:0005885) |
| 0.0 | 0.2 | GO:0000775 | chromosome, centromeric region(GO:0000775) |
| 0.0 | 0.1 | GO:0097196 | Shu complex(GO:0097196) |
| 0.0 | 2.6 | GO:0005635 | nuclear envelope(GO:0005635) |
| 0.0 | 5.1 | GO:0000785 | chromatin(GO:0000785) |
| 0.0 | 105.7 | GO:0005829 | cytosol(GO:0005829) |
| 0.0 | 0.5 | GO:0005875 | microtubule associated complex(GO:0005875) |
| 0.0 | 3.7 | GO:0048046 | apoplast(GO:0048046) |
| 0.0 | 0.1 | GO:0034045 | pre-autophagosomal structure membrane(GO:0034045) Atg12-Atg5-Atg16 complex(GO:0034274) |
| 0.0 | 0.8 | GO:0042995 | cell projection(GO:0042995) |
| 0.0 | 0.1 | GO:0009528 | plastid inner membrane(GO:0009528) |
| 0.0 | 19.0 | GO:0005783 | endoplasmic reticulum(GO:0005783) |
| 0.0 | 1.1 | GO:0030880 | RNA polymerase complex(GO:0030880) |
| 0.0 | 1.2 | GO:0045271 | mitochondrial respiratory chain complex I(GO:0005747) NADH dehydrogenase complex(GO:0030964) respiratory chain complex I(GO:0045271) |
| 0.0 | 0.1 | GO:0009569 | chloroplast starch grain(GO:0009569) starch grain(GO:0043036) |
| 0.0 | 1.3 | GO:0090575 | RNA polymerase II transcription factor complex(GO:0090575) |
| 0.0 | 0.4 | GO:0042644 | chloroplast nucleoid(GO:0042644) |
| 0.0 | 7.0 | GO:0009570 | chloroplast stroma(GO:0009570) |
| 0.0 | 0.3 | GO:0033179 | proton-transporting V-type ATPase, V0 domain(GO:0033179) |
| 0.0 | 0.1 | GO:0009986 | cell surface(GO:0009986) |
| 0.0 | 44.7 | GO:0071944 | cell periphery(GO:0071944) |
| 0.0 | 1.2 | GO:0005774 | vacuolar membrane(GO:0005774) |
| 0.0 | 0.3 | GO:0000138 | Golgi trans cisterna(GO:0000138) |
Gene overrepresentation in molecular function category:
| Log-likelihood per target | Total log-likelihood | Term | Description |
|---|---|---|---|
| 1.2 | 6.1 | GO:0008964 | phosphoenolpyruvate carboxylase activity(GO:0008964) |
| 1.1 | 3.4 | GO:0015087 | cobalt ion transmembrane transporter activity(GO:0015087) nickel cation transmembrane transporter activity(GO:0015099) |
| 1.1 | 4.4 | GO:0030410 | nicotianamine synthase activity(GO:0030410) |
| 1.1 | 3.3 | GO:0004034 | aldose 1-epimerase activity(GO:0004034) |
| 1.0 | 5.8 | GO:0019904 | protein domain specific binding(GO:0019904) |
| 0.7 | 6.7 | GO:0047216 | inositol 3-alpha-galactosyltransferase activity(GO:0047216) |
| 0.7 | 2.2 | GO:1990883 | rRNA cytidine N-acetyltransferase activity(GO:1990883) |
| 0.7 | 2.2 | GO:0016661 | oxidoreductase activity, acting on other nitrogenous compounds as donors(GO:0016661) |
| 0.7 | 0.7 | GO:0008184 | glycogen phosphorylase activity(GO:0008184) |
| 0.6 | 2.5 | GO:0004512 | inositol-3-phosphate synthase activity(GO:0004512) |
| 0.6 | 3.0 | GO:0031957 | very long-chain fatty acid-CoA ligase activity(GO:0031957) |
| 0.6 | 5.4 | GO:0004869 | cysteine-type endopeptidase inhibitor activity(GO:0004869) |
| 0.6 | 2.3 | GO:0046537 | 2,3-bisphosphoglycerate-independent phosphoglycerate mutase activity(GO:0046537) |
| 0.6 | 1.7 | GO:0004634 | phosphopyruvate hydratase activity(GO:0004634) |
| 0.6 | 1.7 | GO:0009671 | nitrate:proton symporter activity(GO:0009671) |
| 0.5 | 1.6 | GO:0016767 | geranylgeranyl-diphosphate geranylgeranyltransferase activity(GO:0016767) |
| 0.5 | 5.2 | GO:0004351 | glutamate decarboxylase activity(GO:0004351) |
| 0.5 | 2.0 | GO:0045548 | phenylalanine ammonia-lyase activity(GO:0045548) |
| 0.5 | 4.1 | GO:0004024 | alcohol dehydrogenase activity, zinc-dependent(GO:0004024) |
| 0.5 | 2.5 | GO:0015186 | L-glutamine transmembrane transporter activity(GO:0015186) |
| 0.5 | 2.0 | GO:0004307 | ethanolaminephosphotransferase activity(GO:0004307) |
| 0.5 | 1.5 | GO:0000403 | Y-form DNA binding(GO:0000403) flap-structured DNA binding(GO:0070336) |
| 0.5 | 1.9 | GO:0003852 | 2-isopropylmalate synthase activity(GO:0003852) |
| 0.5 | 1.9 | GO:0050347 | trans-octaprenyltranstransferase activity(GO:0050347) all-trans-nonaprenyl-diphosphate synthase (geranylgeranyl-diphosphate specific) activity(GO:0052924) |
| 0.4 | 1.3 | GO:1990259 | protein-glutamine N-methyltransferase activity(GO:0036009) histone-glutamine methyltransferase activity(GO:1990259) |
| 0.4 | 1.3 | GO:0061731 | ribonucleoside-diphosphate reductase activity, thioredoxin disulfide as acceptor(GO:0004748) oxidoreductase activity, acting on CH or CH2 groups, disulfide as acceptor(GO:0016728) ribonucleoside-diphosphate reductase activity(GO:0061731) |
| 0.4 | 7.5 | GO:0016157 | sucrose synthase activity(GO:0016157) |
| 0.4 | 1.7 | GO:0046481 | digalactosyldiacylglycerol synthase activity(GO:0046481) |
| 0.4 | 1.3 | GO:0080045 | quercetin 3'-O-glucosyltransferase activity(GO:0080045) |
| 0.4 | 1.3 | GO:0043425 | bHLH transcription factor binding(GO:0043425) |
| 0.4 | 1.7 | GO:0050162 | oxalate oxidase activity(GO:0050162) |
| 0.4 | 7.7 | GO:0015086 | cadmium ion transmembrane transporter activity(GO:0015086) |
| 0.4 | 1.6 | GO:0004556 | alpha-amylase activity(GO:0004556) |
| 0.4 | 2.0 | GO:1902387 | ceramide transporter activity(GO:0035620) sphingolipid transporter activity(GO:0046624) ceramide 1-phosphate binding(GO:1902387) ceramide 1-phosphate transporter activity(GO:1902388) |
| 0.4 | 1.2 | GO:0052725 | inositol-1,3,4-trisphosphate 6-kinase activity(GO:0052725) |
| 0.4 | 1.5 | GO:0015603 | iron chelate transmembrane transporter activity(GO:0015603) iron-nicotianamine transmembrane transporter activity(GO:0051980) |
| 0.4 | 1.5 | GO:0052595 | tryptamine:oxygen oxidoreductase (deaminating) activity(GO:0052593) aminoacetone:oxygen oxidoreductase(deaminating) activity(GO:0052594) aliphatic-amine oxidase activity(GO:0052595) phenethylamine:oxygen oxidoreductase (deaminating) activity(GO:0052596) |
| 0.4 | 1.1 | GO:0004618 | phosphoglycerate kinase activity(GO:0004618) |
| 0.4 | 1.1 | GO:0043140 | ATP-dependent 3'-5' DNA helicase activity(GO:0043140) single-stranded DNA-dependent ATP-dependent 3'-5' DNA helicase activity(GO:1990518) |
| 0.4 | 3.3 | GO:0015112 | nitrate transmembrane transporter activity(GO:0015112) |
| 0.4 | 1.1 | GO:0008936 | nicotinamidase activity(GO:0008936) |
| 0.4 | 1.1 | GO:0004776 | succinate-CoA ligase activity(GO:0004774) succinate-CoA ligase (ADP-forming) activity(GO:0004775) succinate-CoA ligase (GDP-forming) activity(GO:0004776) |
| 0.4 | 1.4 | GO:0000340 | RNA 7-methylguanosine cap binding(GO:0000340) |
| 0.3 | 1.0 | GO:0050997 | phosphatidylcholine binding(GO:0031210) quaternary ammonium group binding(GO:0050997) |
| 0.3 | 1.0 | GO:0000179 | rRNA (adenine-N6,N6-)-dimethyltransferase activity(GO:0000179) |
| 0.3 | 1.7 | GO:0033897 | ribonuclease T2 activity(GO:0033897) |
| 0.3 | 1.4 | GO:0080097 | L-tryptophan:pyruvate aminotransferase activity(GO:0080097) |
| 0.3 | 1.7 | GO:0015193 | L-proline transmembrane transporter activity(GO:0015193) |
| 0.3 | 0.3 | GO:0070492 | oligosaccharide binding(GO:0070492) |
| 0.3 | 2.0 | GO:0050062 | long-chain-fatty-acyl-CoA reductase activity(GO:0050062) |
| 0.3 | 1.0 | GO:0004819 | glutamine-tRNA ligase activity(GO:0004819) |
| 0.3 | 1.7 | GO:0004478 | methionine adenosyltransferase activity(GO:0004478) |
| 0.3 | 1.3 | GO:0005315 | inorganic phosphate transmembrane transporter activity(GO:0005315) |
| 0.3 | 1.3 | GO:0004831 | tyrosine-tRNA ligase activity(GO:0004831) |
| 0.3 | 1.6 | GO:0004028 | 3-chloroallyl aldehyde dehydrogenase activity(GO:0004028) |
| 0.3 | 4.6 | GO:0010329 | auxin efflux transmembrane transporter activity(GO:0010329) |
| 0.3 | 2.6 | GO:0004738 | pyruvate dehydrogenase activity(GO:0004738) |
| 0.3 | 1.0 | GO:0016262 | protein N-acetylglucosaminyltransferase activity(GO:0016262) |
| 0.3 | 1.3 | GO:0004174 | electron-transferring-flavoprotein dehydrogenase activity(GO:0004174) oxidoreductase activity, acting on the CH-NH group of donors, quinone or similar compound as acceptor(GO:0016649) |
| 0.3 | 1.0 | GO:0052592 | oxidoreductase activity, acting on CH or CH2 groups, with an iron-sulfur protein as acceptor(GO:0052592) |
| 0.3 | 1.6 | GO:0003979 | UDP-glucose 6-dehydrogenase activity(GO:0003979) |
| 0.3 | 1.2 | GO:0004348 | glucosylceramidase activity(GO:0004348) |
| 0.3 | 0.3 | GO:0004438 | phosphatidylinositol-3-phosphatase activity(GO:0004438) phosphatidylinositol-3,5-bisphosphate 3-phosphatase activity(GO:0052629) |
| 0.3 | 0.9 | GO:0016842 | amidine-lyase activity(GO:0016842) |
| 0.3 | 0.9 | GO:0004044 | amidophosphoribosyltransferase activity(GO:0004044) |
| 0.3 | 1.5 | GO:0015367 | oxoglutarate:malate antiporter activity(GO:0015367) |
| 0.3 | 2.0 | GO:0004345 | glucose-6-phosphate dehydrogenase activity(GO:0004345) |
| 0.3 | 1.7 | GO:0051003 | magnesium chelatase activity(GO:0016851) ligase activity, forming nitrogen-metal bonds(GO:0051002) ligase activity, forming nitrogen-metal bonds, forming coordination complexes(GO:0051003) |
| 0.3 | 1.4 | GO:0005223 | intracellular cGMP activated cation channel activity(GO:0005223) |
| 0.3 | 2.0 | GO:0047274 | galactinol-sucrose galactosyltransferase activity(GO:0047274) |
| 0.3 | 0.6 | GO:0016725 | oxidoreductase activity, acting on CH or CH2 groups(GO:0016725) |
| 0.3 | 1.4 | GO:0004148 | dihydrolipoyl dehydrogenase activity(GO:0004148) |
| 0.3 | 1.4 | GO:0070035 | ATP-dependent DNA helicase activity(GO:0004003) ATP-dependent helicase activity(GO:0008026) single-stranded DNA-dependent ATP-dependent DNA helicase activity(GO:0017116) single-stranded DNA-dependent ATPase activity(GO:0043142) purine NTP-dependent helicase activity(GO:0070035) |
| 0.3 | 1.3 | GO:0043024 | ribosomal small subunit binding(GO:0043024) |
| 0.3 | 1.6 | GO:0004449 | isocitrate dehydrogenase (NAD+) activity(GO:0004449) |
| 0.3 | 0.3 | GO:0046524 | sucrose-phosphate synthase activity(GO:0046524) |
| 0.3 | 1.6 | GO:0016531 | copper chaperone activity(GO:0016531) |
| 0.3 | 2.3 | GO:0043023 | ribosomal large subunit binding(GO:0043023) |
| 0.3 | 2.6 | GO:0035252 | UDP-xylosyltransferase activity(GO:0035252) |
| 0.3 | 1.0 | GO:0031516 | far-red light photoreceptor activity(GO:0031516) |
| 0.3 | 1.3 | GO:0004594 | pantothenate kinase activity(GO:0004594) |
| 0.3 | 1.0 | GO:0036218 | dTTP diphosphatase activity(GO:0036218) |
| 0.2 | 1.2 | GO:1990825 | sequence-specific mRNA binding(GO:1990825) |
| 0.2 | 1.0 | GO:0080103 | 4-methylthiopropyl glucosinolate S-oxygenase activity(GO:0080103) |
| 0.2 | 1.5 | GO:0001102 | RNA polymerase II activating transcription factor binding(GO:0001102) |
| 0.2 | 0.7 | GO:0070678 | preprotein binding(GO:0070678) |
| 0.2 | 1.9 | GO:0033946 | xyloglucan-specific endo-beta-1,4-glucanase activity(GO:0033946) |
| 0.2 | 8.3 | GO:0050135 | NAD(P)+ nucleosidase activity(GO:0050135) |
| 0.2 | 3.8 | GO:0031369 | translation initiation factor binding(GO:0031369) |
| 0.2 | 0.7 | GO:0016504 | peptidase activator activity(GO:0016504) |
| 0.2 | 0.9 | GO:0047724 | inosine nucleosidase activity(GO:0047724) |
| 0.2 | 3.0 | GO:0042389 | omega-3 fatty acid desaturase activity(GO:0042389) |
| 0.2 | 2.8 | GO:0008028 | monocarboxylic acid transmembrane transporter activity(GO:0008028) |
| 0.2 | 0.7 | GO:0061575 | cyclin-dependent protein serine/threonine kinase activator activity(GO:0061575) |
| 0.2 | 0.7 | GO:0001130 | bacterial-type RNA polymerase transcription factor activity, sequence-specific DNA binding(GO:0001130) bacterial-type RNA polymerase transcriptional activator activity, sequence-specific DNA binding(GO:0001216) |
| 0.2 | 0.9 | GO:0004791 | thioredoxin-disulfide reductase activity(GO:0004791) |
| 0.2 | 0.7 | GO:0001054 | RNA polymerase I activity(GO:0001054) RNA polymerase III activity(GO:0001056) |
| 0.2 | 0.9 | GO:0016748 | dihydrolipoyllysine-residue succinyltransferase activity(GO:0004149) succinyltransferase activity(GO:0016748) S-succinyltransferase activity(GO:0016751) |
| 0.2 | 4.3 | GO:0030515 | snoRNA binding(GO:0030515) |
| 0.2 | 1.6 | GO:0102391 | decanoate--CoA ligase activity(GO:0102391) |
| 0.2 | 3.2 | GO:0009927 | histidine phosphotransfer kinase activity(GO:0009927) |
| 0.2 | 1.1 | GO:0034432 | bis(5'-adenosyl)-pentaphosphatase activity(GO:0034432) |
| 0.2 | 4.5 | GO:0008559 | xenobiotic-transporting ATPase activity(GO:0008559) |
| 0.2 | 0.7 | GO:0045430 | chalcone isomerase activity(GO:0045430) |
| 0.2 | 0.7 | GO:0004347 | glucose-6-phosphate isomerase activity(GO:0004347) |
| 0.2 | 1.8 | GO:0001653 | peptide receptor activity(GO:0001653) |
| 0.2 | 2.2 | GO:0102360 | daphnetin 3-O-glucosyltransferase activity(GO:0102360) |
| 0.2 | 1.8 | GO:0050307 | sucrose-phosphate phosphatase activity(GO:0050307) |
| 0.2 | 0.9 | GO:0008395 | steroid hydroxylase activity(GO:0008395) |
| 0.2 | 1.7 | GO:0090447 | glycerol-3-phosphate 2-O-acyltransferase activity(GO:0090447) |
| 0.2 | 2.4 | GO:0015462 | protein-transmembrane transporting ATPase activity(GO:0015462) |
| 0.2 | 0.9 | GO:0004829 | threonine-tRNA ligase activity(GO:0004829) |
| 0.2 | 1.1 | GO:0003680 | AT DNA binding(GO:0003680) |
| 0.2 | 1.1 | GO:0004333 | fumarate hydratase activity(GO:0004333) |
| 0.2 | 1.5 | GO:0005047 | signal recognition particle binding(GO:0005047) |
| 0.2 | 1.7 | GO:0051011 | microtubule minus-end binding(GO:0051011) |
| 0.2 | 0.6 | GO:0090422 | thiamine pyrophosphate transporter activity(GO:0090422) |
| 0.2 | 1.7 | GO:0004566 | beta-glucuronidase activity(GO:0004566) |
| 0.2 | 1.5 | GO:0010279 | indole-3-acetic acid amido synthetase activity(GO:0010279) |
| 0.2 | 3.5 | GO:0035064 | methylated histone binding(GO:0035064) |
| 0.2 | 1.6 | GO:0019158 | glucose binding(GO:0005536) mannokinase activity(GO:0019158) |
| 0.2 | 1.0 | GO:0043765 | T/G mismatch-specific endonuclease activity(GO:0043765) |
| 0.2 | 0.6 | GO:0070034 | telomerase RNA binding(GO:0070034) |
| 0.2 | 0.6 | GO:0050377 | UDP-L-rhamnose synthase activity(GO:0010280) UDP-glucose 4,6-dehydratase activity(GO:0050377) |
| 0.2 | 1.2 | GO:0004416 | hydroxyacylglutathione hydrolase activity(GO:0004416) |
| 0.2 | 1.2 | GO:0030527 | structural constituent of chromatin(GO:0030527) |
| 0.2 | 1.0 | GO:0043539 | protein serine/threonine kinase activator activity(GO:0043539) |
| 0.2 | 2.9 | GO:0015562 | efflux transmembrane transporter activity(GO:0015562) |
| 0.2 | 2.3 | GO:0004427 | inorganic diphosphatase activity(GO:0004427) |
| 0.2 | 1.7 | GO:0071617 | lysophospholipid acyltransferase activity(GO:0071617) |
| 0.2 | 0.6 | GO:0036402 | proteasome-activating ATPase activity(GO:0036402) |
| 0.2 | 0.2 | GO:0097001 | sphingolipid binding(GO:0046625) ceramide binding(GO:0097001) |
| 0.2 | 0.7 | GO:0004619 | phosphoglycerate mutase activity(GO:0004619) |
| 0.2 | 0.6 | GO:0043682 | copper-transporting ATPase activity(GO:0043682) |
| 0.2 | 0.5 | GO:0004826 | phenylalanine-tRNA ligase activity(GO:0004826) |
| 0.2 | 0.5 | GO:0046409 | p-coumarate 3-hydroxylase activity(GO:0046409) |
| 0.2 | 1.3 | GO:0051748 | UTP-monosaccharide-1-phosphate uridylyltransferase activity(GO:0051748) |
| 0.2 | 1.3 | GO:0003872 | 6-phosphofructokinase activity(GO:0003872) |
| 0.2 | 3.4 | GO:0005199 | structural constituent of cell wall(GO:0005199) |
| 0.2 | 0.7 | GO:0008301 | DNA binding, bending(GO:0008301) |
| 0.2 | 1.4 | GO:0019137 | thioglucosidase activity(GO:0019137) |
| 0.2 | 3.6 | GO:0070122 | isopeptidase activity(GO:0070122) |
| 0.2 | 0.7 | GO:0070006 | metalloaminopeptidase activity(GO:0070006) |
| 0.2 | 1.1 | GO:0045547 | dehydrodolichyl diphosphate synthase activity(GO:0045547) |
| 0.2 | 1.8 | GO:0061505 | DNA topoisomerase type II (ATP-hydrolyzing) activity(GO:0003918) DNA topoisomerase II activity(GO:0061505) |
| 0.2 | 1.4 | GO:0009916 | alternative oxidase activity(GO:0009916) |
| 0.2 | 0.7 | GO:0008253 | 5'-nucleotidase activity(GO:0008253) |
| 0.2 | 0.5 | GO:0004412 | homoserine dehydrogenase activity(GO:0004412) |
| 0.2 | 0.5 | GO:0070259 | tyrosyl-DNA phosphodiesterase activity(GO:0070259) |
| 0.2 | 1.2 | GO:0004356 | glutamate-ammonia ligase activity(GO:0004356) |
| 0.2 | 0.5 | GO:0008686 | GTP cyclohydrolase II activity(GO:0003935) 3,4-dihydroxy-2-butanone-4-phosphate synthase activity(GO:0008686) |
| 0.2 | 1.2 | GO:0008022 | protein C-terminus binding(GO:0008022) |
| 0.2 | 1.0 | GO:0050378 | UDP-glucuronate 4-epimerase activity(GO:0050378) |
| 0.2 | 1.0 | GO:0052691 | UDP-arabinopyranose mutase activity(GO:0052691) |
| 0.2 | 1.0 | GO:0018708 | thiol S-methyltransferase activity(GO:0018708) |
| 0.2 | 0.7 | GO:0004048 | anthranilate phosphoribosyltransferase activity(GO:0004048) |
| 0.2 | 0.2 | GO:0017017 | MAP kinase tyrosine/serine/threonine phosphatase activity(GO:0017017) |
| 0.2 | 0.5 | GO:0019210 | kinase inhibitor activity(GO:0019210) |
| 0.2 | 13.7 | GO:0003724 | RNA helicase activity(GO:0003724) |
| 0.2 | 0.5 | GO:0008265 | Mo-molybdopterin cofactor sulfurase activity(GO:0008265) |
| 0.2 | 0.7 | GO:0004839 | ubiquitin activating enzyme activity(GO:0004839) |
| 0.2 | 0.7 | GO:0047334 | diphosphate-fructose-6-phosphate 1-phosphotransferase activity(GO:0047334) |
| 0.2 | 2.5 | GO:0008195 | phosphatidate phosphatase activity(GO:0008195) |
| 0.2 | 0.8 | GO:0009678 | hydrogen-translocating pyrophosphatase activity(GO:0009678) |
| 0.2 | 0.5 | GO:0003864 | 3-methyl-2-oxobutanoate hydroxymethyltransferase activity(GO:0003864) |
| 0.2 | 1.1 | GO:0070905 | glycine hydroxymethyltransferase activity(GO:0004372) serine binding(GO:0070905) |
| 0.2 | 2.4 | GO:0005381 | iron ion transmembrane transporter activity(GO:0005381) |
| 0.2 | 1.1 | GO:0008157 | protein phosphatase 1 binding(GO:0008157) |
| 0.2 | 0.5 | GO:0004448 | isocitrate dehydrogenase activity(GO:0004448) |
| 0.2 | 1.1 | GO:0045431 | flavonol synthase activity(GO:0045431) |
| 0.2 | 0.5 | GO:0051765 | inositol tetrakisphosphate kinase activity(GO:0051765) |
| 0.2 | 2.4 | GO:0004629 | phospholipase C activity(GO:0004629) |
| 0.2 | 0.6 | GO:0004475 | mannose-1-phosphate guanylyltransferase activity(GO:0004475) |
| 0.2 | 0.6 | GO:0047215 | indole-3-acetate beta-glucosyltransferase activity(GO:0047215) |
| 0.2 | 0.6 | GO:0004821 | histidine-tRNA ligase activity(GO:0004821) |
| 0.2 | 1.4 | GO:0019903 | protein phosphatase binding(GO:0019903) |
| 0.2 | 1.1 | GO:0031072 | heat shock protein binding(GO:0031072) |
| 0.2 | 0.5 | GO:0004614 | phosphoglucomutase activity(GO:0004614) |
| 0.2 | 0.5 | GO:0016211 | aspartate-ammonia ligase activity(GO:0004071) ammonia ligase activity(GO:0016211) acid-ammonia (or amide) ligase activity(GO:0016880) |
| 0.2 | 0.5 | GO:0019781 | NEDD8 activating enzyme activity(GO:0019781) |
| 0.2 | 1.2 | GO:0008494 | translation activator activity(GO:0008494) mitochondrial ribosome binding(GO:0097177) |
| 0.2 | 0.5 | GO:0031219 | levanase activity(GO:0031219) fructan beta-fructosidase activity(GO:0051669) |
| 0.2 | 0.8 | GO:0004816 | asparagine-tRNA ligase activity(GO:0004816) |
| 0.2 | 0.5 | GO:0004514 | nicotinate-nucleotide diphosphorylase (carboxylating) activity(GO:0004514) |
| 0.1 | 0.3 | GO:0003977 | UDP-N-acetylglucosamine diphosphorylase activity(GO:0003977) |
| 0.1 | 1.3 | GO:0046933 | proton-transporting ATP synthase activity, rotational mechanism(GO:0046933) |
| 0.1 | 0.4 | GO:0016041 | glutamate synthase (ferredoxin) activity(GO:0016041) oxidoreductase activity, acting on the CH-NH2 group of donors, iron-sulfur protein as acceptor(GO:0016643) |
| 0.1 | 0.3 | GO:0017077 | oxidative phosphorylation uncoupler activity(GO:0017077) |
| 0.1 | 0.9 | GO:0003913 | DNA photolyase activity(GO:0003913) |
| 0.1 | 1.6 | GO:0003689 | DNA clamp loader activity(GO:0003689) protein-DNA loading ATPase activity(GO:0033170) |
| 0.1 | 0.6 | GO:0070182 | DNA polymerase binding(GO:0070182) |
| 0.1 | 0.7 | GO:0003959 | NADPH dehydrogenase activity(GO:0003959) |
| 0.1 | 3.0 | GO:0022821 | potassium ion antiporter activity(GO:0022821) |
| 0.1 | 0.4 | GO:0016277 | [myelin basic protein]-arginine N-methyltransferase activity(GO:0016277) |
| 0.1 | 1.7 | GO:0010385 | double-stranded methylated DNA binding(GO:0010385) |
| 0.1 | 0.4 | GO:0016530 | metallochaperone activity(GO:0016530) |
| 0.1 | 1.0 | GO:0052854 | very-long-chain-(S)-2-hydroxy-acid oxidase activity(GO:0052852) long-chain-(S)-2-hydroxy-long-chain-acid oxidase activity(GO:0052853) medium-chain-(S)-2-hydroxy-acid oxidase activity(GO:0052854) |
| 0.1 | 1.6 | GO:0070180 | large ribosomal subunit rRNA binding(GO:0070180) |
| 0.1 | 0.7 | GO:0031683 | G-protein coupled receptor binding(GO:0001664) G-protein beta/gamma-subunit complex binding(GO:0031683) |
| 0.1 | 0.7 | GO:0003785 | actin monomer binding(GO:0003785) |
| 0.1 | 0.4 | GO:0003838 | sterol 24-C-methyltransferase activity(GO:0003838) |
| 0.1 | 0.1 | GO:1900750 | glutathione binding(GO:0043295) oligopeptide binding(GO:1900750) |
| 0.1 | 0.7 | GO:0015203 | polyamine transmembrane transporter activity(GO:0015203) |
| 0.1 | 1.6 | GO:0033926 | glycopeptide alpha-N-acetylgalactosaminidase activity(GO:0033926) |
| 0.1 | 1.6 | GO:0070181 | small ribosomal subunit rRNA binding(GO:0070181) |
| 0.1 | 0.5 | GO:0015924 | mannosyl-oligosaccharide mannosidase activity(GO:0015924) |
| 0.1 | 0.7 | GO:0036456 | L-methionine:thioredoxin-disulfide S-oxidoreductase activity(GO:0033744) L-methionine-(S)-S-oxide reductase activity(GO:0036456) |
| 0.1 | 0.8 | GO:0015369 | calcium:proton antiporter activity(GO:0015369) |
| 0.1 | 0.5 | GO:0004310 | farnesyl-diphosphate farnesyltransferase activity(GO:0004310) squalene synthase activity(GO:0051996) |
| 0.1 | 1.6 | GO:0000774 | adenyl-nucleotide exchange factor activity(GO:0000774) |
| 0.1 | 0.3 | GO:0052692 | alpha-galactosidase activity(GO:0004557) raffinose alpha-galactosidase activity(GO:0052692) |
| 0.1 | 0.5 | GO:0004617 | phosphoglycerate dehydrogenase activity(GO:0004617) |
| 0.1 | 1.0 | GO:0043891 | glyceraldehyde-3-phosphate dehydrogenase (NAD+) (phosphorylating) activity(GO:0004365) glyceraldehyde-3-phosphate dehydrogenase (NAD(P)+) (phosphorylating) activity(GO:0043891) |
| 0.1 | 0.6 | GO:0004001 | adenosine kinase activity(GO:0004001) |
| 0.1 | 0.9 | GO:0032977 | membrane insertase activity(GO:0032977) |
| 0.1 | 1.2 | GO:0043495 | protein anchor(GO:0043495) |
| 0.1 | 7.0 | GO:0010857 | calcium-dependent protein serine/threonine kinase activity(GO:0009931) calcium-dependent protein kinase activity(GO:0010857) |
| 0.1 | 0.9 | GO:0008296 | 3'-5'-exodeoxyribonuclease activity(GO:0008296) |
| 0.1 | 0.3 | GO:0070547 | L-tyrosine:2-oxoglutarate aminotransferase activity(GO:0004838) L-tyrosine aminotransferase activity(GO:0070547) |
| 0.1 | 2.0 | GO:0043424 | protein histidine kinase binding(GO:0043424) |
| 0.1 | 0.9 | GO:0016812 | hydrolase activity, acting on carbon-nitrogen (but not peptide) bonds, in cyclic amides(GO:0016812) |
| 0.1 | 2.9 | GO:0004725 | protein tyrosine phosphatase activity(GO:0004725) |
| 0.1 | 0.7 | GO:0051723 | protein methylesterase activity(GO:0051723) |
| 0.1 | 1.0 | GO:0003885 | D-arabinono-1,4-lactone oxidase activity(GO:0003885) |
| 0.1 | 1.2 | GO:0050308 | sugar-phosphatase activity(GO:0050308) |
| 0.1 | 0.4 | GO:0008839 | 4-hydroxy-tetrahydrodipicolinate reductase(GO:0008839) |
| 0.1 | 1.0 | GO:0017091 | AU-rich element binding(GO:0017091) |
| 0.1 | 1.1 | GO:0004017 | adenylate kinase activity(GO:0004017) |
| 0.1 | 1.7 | GO:0002161 | aminoacyl-tRNA editing activity(GO:0002161) |
| 0.1 | 1.2 | GO:0004602 | glutathione peroxidase activity(GO:0004602) |
| 0.1 | 1.6 | GO:0008139 | nuclear localization sequence binding(GO:0008139) |
| 0.1 | 1.5 | GO:0003688 | DNA replication origin binding(GO:0003688) |
| 0.1 | 0.2 | GO:0080002 | UDP-glucose:4-aminobenzoate acylglucosyltransferase activity(GO:0080002) |
| 0.1 | 0.7 | GO:0003878 | ATP citrate synthase activity(GO:0003878) |
| 0.1 | 0.5 | GO:0070568 | guanylyltransferase activity(GO:0070568) |
| 0.1 | 1.3 | GO:0051879 | Hsp90 protein binding(GO:0051879) |
| 0.1 | 1.0 | GO:0004526 | ribonuclease P activity(GO:0004526) |
| 0.1 | 0.3 | GO:0004477 | methenyltetrahydrofolate cyclohydrolase activity(GO:0004477) methylenetetrahydrofolate dehydrogenase (NADP+) activity(GO:0004488) |
| 0.1 | 1.9 | GO:0004630 | phospholipase D activity(GO:0004630) N-acylphosphatidylethanolamine-specific phospholipase D activity(GO:0070290) |
| 0.1 | 0.6 | GO:0047780 | citrate dehydratase activity(GO:0047780) |
| 0.1 | 0.3 | GO:0019136 | deoxynucleoside kinase activity(GO:0019136) |
| 0.1 | 3.7 | GO:0004724 | magnesium-dependent protein serine/threonine phosphatase activity(GO:0004724) |
| 0.1 | 0.6 | GO:0000339 | RNA cap binding(GO:0000339) |
| 0.1 | 3.1 | GO:0045309 | protein phosphorylated amino acid binding(GO:0045309) phosphoprotein binding(GO:0051219) |
| 0.1 | 0.8 | GO:0003691 | double-stranded telomeric DNA binding(GO:0003691) |
| 0.1 | 2.2 | GO:0005227 | calcium activated cation channel activity(GO:0005227) ion gated channel activity(GO:0022839) |
| 0.1 | 1.4 | GO:0042162 | telomeric DNA binding(GO:0042162) |
| 0.1 | 0.5 | GO:0003987 | acetate-CoA ligase activity(GO:0003987) |
| 0.1 | 0.4 | GO:0004367 | glycerol-3-phosphate dehydrogenase [NAD+] activity(GO:0004367) |
| 0.1 | 0.8 | GO:0002020 | protease binding(GO:0002020) |
| 0.1 | 0.9 | GO:0009922 | fatty acid elongase activity(GO:0009922) |
| 0.1 | 0.9 | GO:0030976 | thiamine pyrophosphate binding(GO:0030976) |
| 0.1 | 0.2 | GO:0030332 | cyclin binding(GO:0030332) |
| 0.1 | 2.3 | GO:0015450 | P-P-bond-hydrolysis-driven protein transmembrane transporter activity(GO:0015450) |
| 0.1 | 1.0 | GO:0004069 | L-aspartate:2-oxoglutarate aminotransferase activity(GO:0004069) |
| 0.1 | 0.4 | GO:0004817 | cysteine-tRNA ligase activity(GO:0004817) |
| 0.1 | 0.5 | GO:0080122 | AMP transmembrane transporter activity(GO:0080122) |
| 0.1 | 1.1 | GO:0010997 | anaphase-promoting complex binding(GO:0010997) |
| 0.1 | 0.5 | GO:0051019 | mitogen-activated protein kinase binding(GO:0051019) |
| 0.1 | 7.0 | GO:0004197 | cysteine-type endopeptidase activity(GO:0004197) |
| 0.1 | 1.9 | GO:0005504 | fatty acid binding(GO:0005504) |
| 0.1 | 0.3 | GO:0003986 | acetyl-CoA hydrolase activity(GO:0003986) |
| 0.1 | 1.7 | GO:0034594 | phosphatidylinositol-3,4,5-trisphosphate 5-phosphatase activity(GO:0034485) phosphatidylinositol trisphosphate phosphatase activity(GO:0034594) |
| 0.1 | 4.5 | GO:0003899 | DNA-directed RNA polymerase activity(GO:0003899) |
| 0.1 | 3.5 | GO:0008553 | hydrogen-exporting ATPase activity, phosphorylative mechanism(GO:0008553) |
| 0.1 | 1.2 | GO:0016868 | intramolecular transferase activity, phosphotransferases(GO:0016868) |
| 0.1 | 0.4 | GO:0000268 | peroxisome targeting sequence binding(GO:0000268) |
| 0.1 | 0.5 | GO:0030943 | mitochondrion targeting sequence binding(GO:0030943) |
| 0.1 | 9.8 | GO:0051082 | unfolded protein binding(GO:0051082) |
| 0.1 | 0.5 | GO:0051740 | ethylene receptor activity(GO:0038199) ethylene binding(GO:0051740) alkene binding(GO:0072328) |
| 0.1 | 1.1 | GO:0003746 | translation elongation factor activity(GO:0003746) |
| 0.1 | 0.3 | GO:0016435 | rRNA (guanine) methyltransferase activity(GO:0016435) |
| 0.1 | 0.9 | GO:0016273 | arginine N-methyltransferase activity(GO:0016273) protein-arginine N-methyltransferase activity(GO:0016274) |
| 0.1 | 3.4 | GO:0004407 | histone deacetylase activity(GO:0004407) protein deacetylase activity(GO:0033558) |
| 0.1 | 0.7 | GO:0051018 | protein kinase A regulatory subunit binding(GO:0034237) protein kinase A binding(GO:0051018) Arp2/3 complex binding(GO:0071933) |
| 0.1 | 0.3 | GO:0000234 | phosphoethanolamine N-methyltransferase activity(GO:0000234) |
| 0.1 | 0.8 | GO:0008878 | glucose-1-phosphate adenylyltransferase activity(GO:0008878) |
| 0.1 | 4.0 | GO:0003743 | translation initiation factor activity(GO:0003743) |
| 0.1 | 22.2 | GO:0003735 | structural constituent of ribosome(GO:0003735) |
| 0.1 | 1.2 | GO:0016308 | 1-phosphatidylinositol-4-phosphate 5-kinase activity(GO:0016308) |
| 0.1 | 0.5 | GO:0002094 | polyprenyltransferase activity(GO:0002094) |
| 0.1 | 0.4 | GO:0004362 | glutathione-disulfide reductase activity(GO:0004362) |
| 0.1 | 0.7 | GO:0043995 | histone acetyltransferase activity (H4-K5 specific)(GO:0043995) |
| 0.1 | 1.8 | GO:0009982 | pseudouridine synthase activity(GO:0009982) |
| 0.1 | 1.9 | GO:0004812 | aminoacyl-tRNA ligase activity(GO:0004812) ligase activity, forming carbon-oxygen bonds(GO:0016875) ligase activity, forming aminoacyl-tRNA and related compounds(GO:0016876) |
| 0.1 | 0.3 | GO:0000170 | sphingosine hydroxylase activity(GO:0000170) |
| 0.1 | 3.5 | GO:0004707 | MAP kinase activity(GO:0004707) |
| 0.1 | 0.3 | GO:1990404 | protein ADP-ribosylase activity(GO:1990404) |
| 0.1 | 1.2 | GO:0008409 | 5'-3' exonuclease activity(GO:0008409) |
| 0.1 | 0.3 | GO:0046976 | histone methyltransferase activity (H3-K27 specific)(GO:0046976) |
| 0.1 | 0.7 | GO:0003999 | adenine phosphoribosyltransferase activity(GO:0003999) |
| 0.1 | 0.3 | GO:0010354 | homogentisate prenyltransferase activity(GO:0010354) |
| 0.1 | 0.6 | GO:0017112 | Rab guanyl-nucleotide exchange factor activity(GO:0017112) |
| 0.1 | 0.9 | GO:0048040 | UDP-glucuronate decarboxylase activity(GO:0048040) |
| 0.1 | 1.2 | GO:0017056 | structural constituent of nuclear pore(GO:0017056) |
| 0.1 | 1.3 | GO:0030955 | pyruvate kinase activity(GO:0004743) potassium ion binding(GO:0030955) alkali metal ion binding(GO:0031420) |
| 0.1 | 0.8 | GO:0042500 | aspartic endopeptidase activity, intramembrane cleaving(GO:0042500) |
| 0.1 | 0.3 | GO:0001227 | transcriptional repressor activity, RNA polymerase II transcription regulatory region sequence-specific binding(GO:0001227) |
| 0.1 | 3.5 | GO:0030145 | manganese ion binding(GO:0030145) |
| 0.1 | 0.6 | GO:0008121 | ubiquinol-cytochrome-c reductase activity(GO:0008121) oxidoreductase activity, acting on diphenols and related substances as donors, cytochrome as acceptor(GO:0016681) |
| 0.1 | 0.6 | GO:0003968 | RNA-directed RNA polymerase activity(GO:0003968) |
| 0.1 | 0.2 | GO:0004807 | triose-phosphate isomerase activity(GO:0004807) |
| 0.1 | 0.3 | GO:0004335 | galactokinase activity(GO:0004335) |
| 0.1 | 0.4 | GO:0005457 | GDP-fucose transmembrane transporter activity(GO:0005457) |
| 0.1 | 1.9 | GO:0008143 | poly(A) binding(GO:0008143) |
| 0.1 | 0.2 | GO:0016906 | sterol 3-beta-glucosyltransferase activity(GO:0016906) |
| 0.1 | 0.5 | GO:0016670 | oxidoreductase activity, acting on a sulfur group of donors, oxygen as acceptor(GO:0016670) |
| 0.1 | 0.4 | GO:0050664 | NAD(P)H oxidase activity(GO:0016174) oxidoreductase activity, acting on NAD(P)H, oxygen as acceptor(GO:0050664) |
| 0.1 | 0.3 | GO:0016882 | cyclo-ligase activity(GO:0016882) |
| 0.1 | 0.5 | GO:0016453 | acetyl-CoA C-acetyltransferase activity(GO:0003985) C-acetyltransferase activity(GO:0016453) |
| 0.1 | 2.4 | GO:0016857 | racemase and epimerase activity, acting on carbohydrates and derivatives(GO:0016857) |
| 0.1 | 0.2 | GO:0051010 | microtubule plus-end binding(GO:0051010) |
| 0.1 | 0.5 | GO:0032029 | myosin tail binding(GO:0032029) myosin heavy chain binding(GO:0032036) myosin XI tail binding(GO:0080115) |
| 0.1 | 0.8 | GO:0008506 | sucrose:proton symporter activity(GO:0008506) |
| 0.1 | 4.6 | GO:0005198 | structural molecule activity(GO:0005198) |
| 0.1 | 0.4 | GO:0004834 | tryptophan synthase activity(GO:0004834) |
| 0.1 | 0.2 | GO:0003844 | 1,4-alpha-glucan branching enzyme activity(GO:0003844) |
| 0.1 | 0.3 | GO:0050284 | sinapate 1-glucosyltransferase activity(GO:0050284) |
| 0.1 | 0.6 | GO:0019843 | rRNA binding(GO:0019843) |
| 0.1 | 0.5 | GO:0004849 | uridine kinase activity(GO:0004849) |
| 0.1 | 1.2 | GO:0008308 | voltage-gated anion channel activity(GO:0008308) |
| 0.1 | 0.4 | GO:0016629 | 12-oxophytodienoate reductase activity(GO:0016629) |
| 0.1 | 1.2 | GO:0019905 | syntaxin binding(GO:0019905) |
| 0.1 | 0.3 | GO:0050291 | sphingosine N-acyltransferase activity(GO:0050291) |
| 0.1 | 0.6 | GO:0003955 | NAD(P)H dehydrogenase (quinone) activity(GO:0003955) |
| 0.1 | 0.1 | GO:0004609 | phosphatidylserine decarboxylase activity(GO:0004609) |
| 0.1 | 0.3 | GO:0004349 | glutamate 5-kinase activity(GO:0004349) glutamate-5-semialdehyde dehydrogenase activity(GO:0004350) |
| 0.1 | 0.1 | GO:0016801 | hydrolase activity, acting on ether bonds(GO:0016801) |
| 0.1 | 0.8 | GO:0016160 | amylase activity(GO:0016160) beta-amylase activity(GO:0016161) |
| 0.1 | 0.6 | GO:0000285 | 1-phosphatidylinositol-3-phosphate 5-kinase activity(GO:0000285) |
| 0.1 | 1.3 | GO:0003843 | 1,3-beta-D-glucan synthase activity(GO:0003843) |
| 0.1 | 0.5 | GO:0004567 | beta-mannosidase activity(GO:0004567) |
| 0.1 | 0.5 | GO:1990538 | xylan O-acetyltransferase activity(GO:1990538) |
| 0.1 | 0.5 | GO:0016151 | nickel cation binding(GO:0016151) |
| 0.1 | 0.3 | GO:0004181 | metallocarboxypeptidase activity(GO:0004181) |
| 0.1 | 1.3 | GO:0016597 | amino acid binding(GO:0016597) |
| 0.1 | 0.3 | GO:0030151 | molybdenum ion binding(GO:0030151) |
| 0.1 | 0.3 | GO:0035174 | histone serine kinase activity(GO:0035174) histone kinase activity (H3-S10 specific)(GO:0035175) |
| 0.1 | 0.6 | GO:0008199 | ferric iron binding(GO:0008199) |
| 0.1 | 0.3 | GO:0003917 | DNA topoisomerase type I activity(GO:0003917) |
| 0.1 | 1.9 | GO:0019199 | transmembrane receptor protein kinase activity(GO:0019199) |
| 0.1 | 0.4 | GO:0050551 | myrcene synthase activity(GO:0050551) |
| 0.1 | 0.6 | GO:0009882 | blue light photoreceptor activity(GO:0009882) |
| 0.1 | 0.3 | GO:0004326 | tetrahydrofolylpolyglutamate synthase activity(GO:0004326) |
| 0.1 | 3.7 | GO:0001228 | transcriptional activator activity, RNA polymerase II transcription regulatory region sequence-specific binding(GO:0001228) |
| 0.1 | 0.4 | GO:0050017 | L-3-cyanoalanine synthase activity(GO:0050017) |
| 0.1 | 1.3 | GO:0003954 | NADH dehydrogenase activity(GO:0003954) |
| 0.1 | 0.4 | GO:0008381 | mechanically-gated ion channel activity(GO:0008381) mechanically gated channel activity(GO:0022833) |
| 0.1 | 4.4 | GO:0003777 | microtubule motor activity(GO:0003777) |
| 0.1 | 1.2 | GO:0043022 | ribosome binding(GO:0043022) |
| 0.1 | 0.2 | GO:0000035 | acyl binding(GO:0000035) |
| 0.1 | 3.3 | GO:0061631 | ubiquitin conjugating enzyme activity(GO:0061631) |
| 0.1 | 0.3 | GO:0008237 | metallopeptidase activity(GO:0008237) |
| 0.1 | 0.6 | GO:0008107 | galactoside 2-alpha-L-fucosyltransferase activity(GO:0008107) alpha-(1,2)-fucosyltransferase activity(GO:0031127) |
| 0.1 | 0.3 | GO:0008728 | GTP diphosphokinase activity(GO:0008728) |
| 0.1 | 0.8 | GO:0016207 | 4-coumarate-CoA ligase activity(GO:0016207) |
| 0.1 | 1.4 | GO:0016679 | oxidoreductase activity, acting on diphenols and related substances as donors(GO:0016679) |
| 0.1 | 0.4 | GO:0016888 | endodeoxyribonuclease activity, producing 5'-phosphomonoesters(GO:0016888) |
| 0.1 | 8.2 | GO:0003924 | GTPase activity(GO:0003924) |
| 0.1 | 1.0 | GO:0016538 | cyclin-dependent protein serine/threonine kinase regulator activity(GO:0016538) |
| 0.1 | 2.4 | GO:0031625 | ubiquitin protein ligase binding(GO:0031625) |
| 0.1 | 0.5 | GO:0070300 | phosphatidic acid binding(GO:0070300) |
| 0.1 | 0.6 | GO:0070567 | cytidylyltransferase activity(GO:0070567) |
| 0.1 | 0.6 | GO:0047259 | glucomannan 4-beta-mannosyltransferase activity(GO:0047259) |
| 0.1 | 0.3 | GO:0005546 | phosphatidylinositol-4,5-bisphosphate binding(GO:0005546) |
| 0.1 | 0.2 | GO:0015136 | sialic acid transmembrane transporter activity(GO:0015136) |
| 0.0 | 0.3 | GO:0015556 | C4-dicarboxylate transmembrane transporter activity(GO:0015556) |
| 0.0 | 1.4 | GO:0019900 | kinase binding(GO:0019900) |
| 0.0 | 0.6 | GO:0004032 | alditol:NADP+ 1-oxidoreductase activity(GO:0004032) |
| 0.0 | 2.3 | GO:0101005 | ubiquitinyl hydrolase activity(GO:0101005) |
| 0.0 | 0.8 | GO:0036002 | pre-mRNA binding(GO:0036002) |
| 0.0 | 0.4 | GO:0009815 | 1-aminocyclopropane-1-carboxylate oxidase activity(GO:0009815) |
| 0.0 | 0.2 | GO:0003909 | DNA ligase activity(GO:0003909) DNA ligase (ATP) activity(GO:0003910) |
| 0.0 | 2.0 | GO:0016413 | O-acetyltransferase activity(GO:0016413) |
| 0.0 | 2.8 | GO:0004364 | glutathione transferase activity(GO:0004364) |
| 0.0 | 0.2 | GO:0042800 | histone methyltransferase activity (H3-K4 specific)(GO:0042800) |
| 0.0 | 4.2 | GO:0004601 | peroxidase activity(GO:0004601) |
| 0.0 | 0.4 | GO:0015271 | outward rectifier potassium channel activity(GO:0015271) |
| 0.0 | 1.9 | GO:0043621 | protein self-association(GO:0043621) |
| 0.0 | 0.1 | GO:0005344 | oxygen transporter activity(GO:0005344) |
| 0.0 | 0.5 | GO:0008187 | poly-pyrimidine tract binding(GO:0008187) |
| 0.0 | 1.1 | GO:0015925 | beta-galactosidase activity(GO:0004565) galactosidase activity(GO:0015925) |
| 0.0 | 0.2 | GO:0000155 | phosphorelay sensor kinase activity(GO:0000155) |
| 0.0 | 1.3 | GO:0016811 | hydrolase activity, acting on carbon-nitrogen (but not peptide) bonds, in linear amides(GO:0016811) |
| 0.0 | 0.1 | GO:0046030 | inositol trisphosphate phosphatase activity(GO:0046030) inositol-1,4,5-trisphosphate 5-phosphatase activity(GO:0052658) |
| 0.0 | 0.1 | GO:0019902 | phosphatase binding(GO:0019902) |
| 0.0 | 0.1 | GO:0004647 | phosphoserine phosphatase activity(GO:0004647) |
| 0.0 | 0.4 | GO:0003886 | DNA (cytosine-5-)-methyltransferase activity(GO:0003886) |
| 0.0 | 7.0 | GO:0005509 | calcium ion binding(GO:0005509) |
| 0.0 | 0.2 | GO:0048487 | beta-tubulin binding(GO:0048487) |
| 0.0 | 0.2 | GO:0031386 | protein tag(GO:0031386) |
| 0.0 | 0.3 | GO:0035198 | miRNA binding(GO:0035198) |
| 0.0 | 0.2 | GO:0031409 | pigment binding(GO:0031409) |
| 0.0 | 0.2 | GO:0016653 | oxidoreductase activity, acting on NAD(P)H, heme protein as acceptor(GO:0016653) |
| 0.0 | 1.6 | GO:0003697 | single-stranded DNA binding(GO:0003697) |
| 0.0 | 0.1 | GO:0048038 | quinone binding(GO:0048038) |
| 0.0 | 0.3 | GO:0045549 | 9-cis-epoxycarotenoid dioxygenase activity(GO:0045549) |
| 0.0 | 0.8 | GO:0016864 | protein disulfide isomerase activity(GO:0003756) intramolecular oxidoreductase activity, transposing S-S bonds(GO:0016864) |
| 0.0 | 2.5 | GO:0004650 | polygalacturonase activity(GO:0004650) |
| 0.0 | 0.5 | GO:0005048 | signal sequence binding(GO:0005048) |
| 0.0 | 1.2 | GO:0016831 | carboxy-lyase activity(GO:0016831) |
| 0.0 | 2.0 | GO:0004185 | serine-type carboxypeptidase activity(GO:0004185) |
| 0.0 | 0.1 | GO:0019156 | isoamylase activity(GO:0019156) |
| 0.0 | 0.1 | GO:0004563 | beta-N-acetylhexosaminidase activity(GO:0004563) |
| 0.0 | 0.3 | GO:0016635 | oxidoreductase activity, acting on the CH-CH group of donors, quinone or related compound as acceptor(GO:0016635) |
| 0.0 | 0.7 | GO:0060090 | binding, bridging(GO:0060090) |
| 0.0 | 0.2 | GO:0032454 | histone demethylase activity (H3-K9 specific)(GO:0032454) |
| 0.0 | 1.2 | GO:0050661 | NADP binding(GO:0050661) |
| 0.0 | 0.1 | GO:0045182 | translation repressor activity(GO:0030371) translation regulator activity(GO:0045182) |
| 0.0 | 0.1 | GO:0004075 | biotin carboxylase activity(GO:0004075) |
| 0.0 | 0.1 | GO:0016819 | hydrolase activity, acting on acid anhydrides, in sulfonyl-containing anhydrides(GO:0016819) adenylylsulfatase activity(GO:0047627) |
| 0.0 | 0.0 | GO:0004352 | glutamate dehydrogenase (NAD+) activity(GO:0004352) |
| 0.0 | 0.1 | GO:0050567 | glutaminyl-tRNA synthase (glutamine-hydrolyzing) activity(GO:0050567) |
| 0.0 | 0.1 | GO:0052901 | spermine:oxygen oxidoreductase (spermidine-forming) activity(GO:0052901) |
| 0.0 | 0.3 | GO:0010011 | auxin binding(GO:0010011) |
| 0.0 | 0.3 | GO:0019207 | kinase regulator activity(GO:0019207) |
| 0.0 | 0.2 | GO:0004550 | nucleoside diphosphate kinase activity(GO:0004550) |
| 0.0 | 0.2 | GO:0016004 | phospholipase activator activity(GO:0016004) lipase activator activity(GO:0060229) |
| 0.0 | 16.4 | GO:0003729 | mRNA binding(GO:0003729) poly(A) RNA binding(GO:0044822) |
| 0.0 | 0.1 | GO:0016676 | cytochrome-c oxidase activity(GO:0004129) heme-copper terminal oxidase activity(GO:0015002) oxidoreductase activity, acting on a heme group of donors(GO:0016675) oxidoreductase activity, acting on a heme group of donors, oxygen as acceptor(GO:0016676) |
| 0.0 | 2.6 | GO:0005507 | copper ion binding(GO:0005507) |
| 0.0 | 0.2 | GO:0016312 | inositol bisphosphate phosphatase activity(GO:0016312) |
| 0.0 | 0.3 | GO:0016760 | cellulose synthase (UDP-forming) activity(GO:0016760) |
| 0.0 | 0.5 | GO:0004713 | protein tyrosine kinase activity(GO:0004713) |
| 0.0 | 0.2 | GO:0008320 | protein transmembrane transporter activity(GO:0008320) macromolecule transmembrane transporter activity(GO:0022884) |
| 0.0 | 17.5 | GO:0004672 | protein kinase activity(GO:0004672) |
| 0.0 | 1.1 | GO:0042910 | xenobiotic transporter activity(GO:0042910) |
| 0.0 | 0.0 | GO:0003995 | acyl-CoA dehydrogenase activity(GO:0003995) |
| 0.0 | 0.5 | GO:0004659 | prenyltransferase activity(GO:0004659) |
| 0.0 | 2.3 | GO:0046982 | protein heterodimerization activity(GO:0046982) |
| 0.0 | 0.0 | GO:0004057 | arginyltransferase activity(GO:0004057) |
| 0.0 | 0.7 | GO:0005347 | ATP transmembrane transporter activity(GO:0005347) |
| 0.0 | 0.2 | GO:0070696 | transmembrane receptor protein serine/threonine kinase binding(GO:0070696) |
| 0.0 | 0.1 | GO:0048365 | Rac GTPase binding(GO:0048365) |
| 0.0 | 0.1 | GO:0004124 | cysteine synthase activity(GO:0004124) |
| 0.0 | 1.1 | GO:0015078 | hydrogen ion transmembrane transporter activity(GO:0015078) |
| 0.0 | 0.4 | GO:0019187 | beta-1,4-mannosyltransferase activity(GO:0019187) mannan synthase activity(GO:0051753) |
| 0.0 | 0.1 | GO:0010277 | chlorophyllide a oxygenase [overall] activity(GO:0010277) |
| 0.0 | 0.3 | GO:0008536 | Ran GTPase binding(GO:0008536) |
| 0.0 | 0.4 | GO:0042973 | glucan endo-1,3-beta-D-glucosidase activity(GO:0042973) |
| 0.0 | 0.1 | GO:0051377 | mannose-ethanolamine phosphotransferase activity(GO:0051377) |
| 0.0 | 0.1 | GO:0016646 | oxidoreductase activity, acting on the CH-NH group of donors, NAD or NADP as acceptor(GO:0016646) |
| 0.0 | 0.2 | GO:0005086 | ARF guanyl-nucleotide exchange factor activity(GO:0005086) |
| 0.0 | 0.7 | GO:0004190 | aspartic-type endopeptidase activity(GO:0004190) |
| 0.0 | 0.3 | GO:0004805 | trehalose-phosphatase activity(GO:0004805) |
| 0.0 | 0.7 | GO:0003678 | DNA helicase activity(GO:0003678) |
| 0.0 | 0.2 | GO:0005496 | steroid binding(GO:0005496) |
| 0.0 | 0.5 | GO:0016860 | intramolecular oxidoreductase activity(GO:0016860) |
| 0.0 | 0.2 | GO:0005242 | inward rectifier potassium channel activity(GO:0005242) |
| 0.0 | 0.2 | GO:1901981 | phosphatidylinositol phosphate binding(GO:1901981) |
| 0.0 | 2.6 | GO:0004175 | endopeptidase activity(GO:0004175) |
| 0.0 | 2.2 | GO:0005524 | ATP binding(GO:0005524) |
| 0.0 | 0.0 | GO:0044183 | protein binding involved in protein folding(GO:0044183) |
| 0.0 | 0.0 | GO:0047364 | desulfoglucosinolate sulfotransferase activity(GO:0047364) |
| 0.0 | 0.5 | GO:0035639 | purine ribonucleoside triphosphate binding(GO:0035639) |
| 0.0 | 0.6 | GO:0008173 | RNA methyltransferase activity(GO:0008173) |
| 0.0 | 0.7 | GO:0008017 | microtubule binding(GO:0008017) |
| 0.0 | 0.1 | GO:0016892 | endoribonuclease activity, producing 3'-phosphomonoesters(GO:0016892) |
| 0.0 | 0.6 | GO:0005319 | lipid transporter activity(GO:0005319) |
| 0.0 | 0.5 | GO:0017137 | Rab GTPase binding(GO:0017137) |
| 0.0 | 0.0 | GO:0001727 | lipid kinase activity(GO:0001727) |
| 0.0 | 0.1 | GO:0008420 | CTD phosphatase activity(GO:0008420) |
Gene overrepresentation in curated gene sets: canonical pathways category:
| Log-likelihood per target | Total log-likelihood | Term | Description |
|---|---|---|---|
| 0.6 | 1.7 | PID ENDOTHELIN PATHWAY | Endothelins |
| 0.3 | 0.6 | PID TCPTP PATHWAY | Signaling events mediated by TCPTP |
| 0.3 | 0.9 | PID BETA CATENIN NUC PATHWAY | Regulation of nuclear beta catenin signaling and target gene transcription |
| 0.3 | 1.1 | ST ERK1 ERK2 MAPK PATHWAY | ERK1/ERK2 MAPK Pathway |
| 0.3 | 1.1 | NABA SECRETED FACTORS | Genes encoding secreted soluble factors |
| 0.3 | 1.3 | PID IL2 PI3K PATHWAY | IL2 signaling events mediated by PI3K |
| 0.2 | 0.2 | PID RAC1 PATHWAY | RAC1 signaling pathway |
| 0.2 | 0.4 | PID MYC PATHWAY | C-MYC pathway |
| 0.2 | 0.9 | PID HDAC CLASSII PATHWAY | Signaling events mediated by HDAC Class II |
| 0.2 | 1.5 | PID HIF1 TFPATHWAY | HIF-1-alpha transcription factor network |
| 0.2 | 0.4 | PID ECADHERIN NASCENT AJ PATHWAY | E-cadherin signaling in the nascent adherens junction |
| 0.2 | 0.6 | PID ATF2 PATHWAY | ATF-2 transcription factor network |
| 0.2 | 0.4 | PID DELTA NP63 PATHWAY | Validated transcriptional targets of deltaNp63 isoforms |
| 0.2 | 0.8 | PID S1P S1P1 PATHWAY | S1P1 pathway |
| 0.2 | 0.3 | PID ERA GENOMIC PATHWAY | Validated nuclear estrogen receptor alpha network |
| 0.2 | 0.7 | PID BARD1 PATHWAY | BARD1 signaling events |
| 0.1 | 0.7 | PID MTOR 4PATHWAY | mTOR signaling pathway |
| 0.1 | 0.5 | PID AP1 PATHWAY | AP-1 transcription factor network |
| 0.1 | 0.3 | PID TELOMERASE PATHWAY | Regulation of Telomerase |
| 0.1 | 0.5 | PID CXCR4 PATHWAY | CXCR4-mediated signaling events |
| 0.1 | 0.2 | PID IL12 2PATHWAY | IL12-mediated signaling events |
| 0.1 | 0.3 | SIG REGULATION OF THE ACTIN CYTOSKELETON BY RHO GTPASES | Genes related to regulation of the actin cytoskeleton |
| 0.0 | 0.2 | PID HIF1A PATHWAY | Hypoxic and oxygen homeostasis regulation of HIF-1-alpha |
| 0.0 | 0.4 | PID E2F PATHWAY | E2F transcription factor network |
| 0.0 | 0.1 | PID HES HEY PATHWAY | Notch-mediated HES/HEY network |
| 0.0 | 0.1 | PID ATR PATHWAY | ATR signaling pathway |
| 0.0 | 0.0 | PID AMB2 NEUTROPHILS PATHWAY | amb2 Integrin signaling |
| 0.0 | 0.0 | PID PI3KCI PATHWAY | Class I PI3K signaling events |
Gene overrepresentation in curated gene sets: REACTOME pathways category:
| Log-likelihood per target | Total log-likelihood | Term | Description |
|---|---|---|---|
| 1.2 | 3.5 | REACTOME GABA SYNTHESIS RELEASE REUPTAKE AND DEGRADATION | Genes involved in GABA synthesis, release, reuptake and degradation |
| 0.6 | 1.9 | REACTOME MTORC1 MEDIATED SIGNALLING | Genes involved in mTORC1-mediated signalling |
| 0.6 | 1.7 | REACTOME GLYCOSPHINGOLIPID METABOLISM | Genes involved in Glycosphingolipid metabolism |
| 0.6 | 1.7 | REACTOME P130CAS LINKAGE TO MAPK SIGNALING FOR INTEGRINS | Genes involved in p130Cas linkage to MAPK signaling for integrins |
| 0.5 | 1.0 | REACTOME DEADENYLATION OF MRNA | Genes involved in Deadenylation of mRNA |
| 0.5 | 1.9 | REACTOME CITRIC ACID CYCLE TCA CYCLE | Genes involved in Citric acid cycle (TCA cycle) |
| 0.4 | 2.2 | REACTOME PROLACTIN RECEPTOR SIGNALING | Genes involved in Prolactin receptor signaling |
| 0.3 | 1.6 | REACTOME GLUCOSE TRANSPORT | Genes involved in Glucose transport |
| 0.3 | 0.6 | REACTOME MITOCHONDRIAL PROTEIN IMPORT | Genes involved in Mitochondrial Protein Import |
| 0.3 | 0.8 | REACTOME NEUROTRANSMITTER RECEPTOR BINDING AND DOWNSTREAM TRANSMISSION IN THE POSTSYNAPTIC CELL | Genes involved in Neurotransmitter Receptor Binding And Downstream Transmission In The Postsynaptic Cell |
| 0.3 | 0.8 | REACTOME PLATELET ACTIVATION SIGNALING AND AGGREGATION | Genes involved in Platelet activation, signaling and aggregation |
| 0.3 | 0.8 | REACTOME PYRUVATE METABOLISM AND CITRIC ACID TCA CYCLE | Genes involved in Pyruvate metabolism and Citric Acid (TCA) cycle |
| 0.3 | 0.8 | REACTOME HDL MEDIATED LIPID TRANSPORT | Genes involved in HDL-mediated lipid transport |
| 0.3 | 0.8 | REACTOME TRNA AMINOACYLATION | Genes involved in tRNA Aminoacylation |
| 0.2 | 0.7 | REACTOME LIPID DIGESTION MOBILIZATION AND TRANSPORT | Genes involved in Lipid digestion, mobilization, and transport |
| 0.2 | 1.0 | REACTOME SIGNALING BY ROBO RECEPTOR | Genes involved in Signaling by Robo receptor |
| 0.2 | 1.4 | REACTOME APOPTOSIS | Genes involved in Apoptosis |
| 0.2 | 0.4 | REACTOME ANTIVIRAL MECHANISM BY IFN STIMULATED GENES | Genes involved in Antiviral mechanism by IFN-stimulated genes |
| 0.2 | 0.4 | REACTOME PRE NOTCH EXPRESSION AND PROCESSING | Genes involved in Pre-NOTCH Expression and Processing |
| 0.2 | 0.8 | REACTOME HOST INTERACTIONS OF HIV FACTORS | Genes involved in Host Interactions of HIV factors |
| 0.2 | 0.8 | REACTOME METABOLISM OF NUCLEOTIDES | Genes involved in Metabolism of nucleotides |
| 0.2 | 0.8 | REACTOME RECRUITMENT OF MITOTIC CENTROSOME PROTEINS AND COMPLEXES | Genes involved in Recruitment of mitotic centrosome proteins and complexes |
| 0.2 | 1.1 | REACTOME UNWINDING OF DNA | Genes involved in Unwinding of DNA |
| 0.2 | 0.6 | REACTOME G2 M DNA DAMAGE CHECKPOINT | Genes involved in G2/M DNA damage checkpoint |
| 0.2 | 1.1 | REACTOME E2F ENABLED INHIBITION OF PRE REPLICATION COMPLEX FORMATION | Genes involved in E2F-enabled inhibition of pre-replication complex formation |
| 0.2 | 1.8 | REACTOME METABOLISM OF CARBOHYDRATES | Genes involved in Metabolism of carbohydrates |
| 0.2 | 1.7 | REACTOME PPARA ACTIVATES GENE EXPRESSION | Genes involved in PPARA Activates Gene Expression |
| 0.2 | 0.6 | REACTOME BIOSYNTHESIS OF THE N GLYCAN PRECURSOR DOLICHOL LIPID LINKED OLIGOSACCHARIDE LLO AND TRANSFER TO A NASCENT PROTEIN | Genes involved in Biosynthesis of the N-glycan precursor (dolichol lipid-linked oligosaccharide, LLO) and transfer to a nascent protein |
| 0.1 | 2.0 | REACTOME HEMOSTASIS | Genes involved in Hemostasis |
| 0.1 | 0.2 | REACTOME MHC CLASS II ANTIGEN PRESENTATION | Genes involved in MHC class II antigen presentation |
| 0.1 | 0.4 | REACTOME PEROXISOMAL LIPID METABOLISM | Genes involved in Peroxisomal lipid metabolism |
| 0.1 | 0.2 | REACTOME FANCONI ANEMIA PATHWAY | Genes involved in Fanconi Anemia pathway |
| 0.1 | 0.6 | REACTOME ASSOCIATION OF TRIC CCT WITH TARGET PROTEINS DURING BIOSYNTHESIS | Genes involved in Association of TriC/CCT with target proteins during biosynthesis |
| 0.1 | 0.1 | REACTOME VEGF LIGAND RECEPTOR INTERACTIONS | Genes involved in VEGF ligand-receptor interactions |
| 0.1 | 1.3 | REACTOME ACTIVATION OF THE MRNA UPON BINDING OF THE CAP BINDING COMPLEX AND EIFS AND SUBSEQUENT BINDING TO 43S | Genes involved in Activation of the mRNA upon binding of the cap-binding complex and eIFs, and subsequent binding to 43S |
| 0.1 | 0.6 | REACTOME NONSENSE MEDIATED DECAY ENHANCED BY THE EXON JUNCTION COMPLEX | Genes involved in Nonsense Mediated Decay Enhanced by the Exon Junction Complex |
| 0.1 | 0.8 | REACTOME ABCA TRANSPORTERS IN LIPID HOMEOSTASIS | Genes involved in ABCA transporters in lipid homeostasis |
| 0.0 | 0.2 | REACTOME HOMOLOGOUS RECOMBINATION REPAIR OF REPLICATION INDEPENDENT DOUBLE STRAND BREAKS | Genes involved in Homologous recombination repair of replication-independent double-strand breaks |
| 0.0 | 0.2 | REACTOME MEMBRANE TRAFFICKING | Genes involved in Membrane Trafficking |
| 0.0 | 0.1 | REACTOME INTERFERON SIGNALING | Genes involved in Interferon Signaling |
| 0.0 | 0.1 | REACTOME REPAIR SYNTHESIS FOR GAP FILLING BY DNA POL IN TC NER | Genes involved in Repair synthesis for gap-filling by DNA polymerase in TC-NER |
| 0.0 | 0.0 | REACTOME METABOLISM OF MRNA | Genes involved in Metabolism of mRNA |