Project
GSE130291:vernalization in Arabidopsis thaliana
Navigation
Downloads
Results for AT2G46680
Z-value: 2.81
Transcription factors associated with AT2G46680
| Gene Symbol | Gene ID | Gene Info |
|---|---|---|
|
AT2G46680
|
AT2G46680 | homeobox 7 |
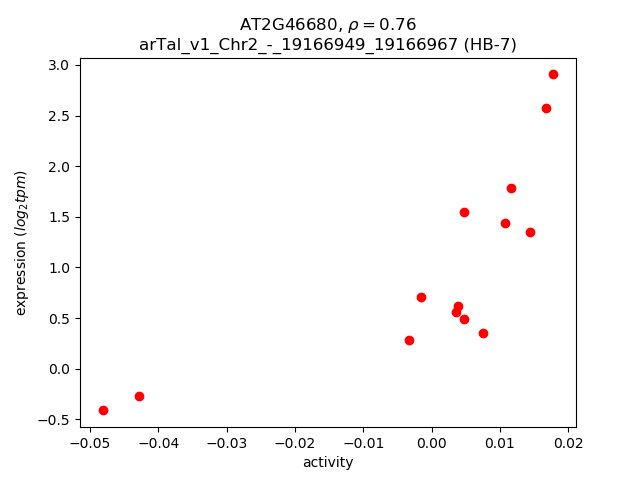
Activity-expression correlation:
| Gene | Promoter | Pearson corr. coef. | P-value | Plot |
|---|---|---|---|---|
| HB-7 | arTal_v1_Chr2_-_19166949_19166967 | 0.76 | 1.7e-03 | Click! |
Activity profile of AT2G46680 motif
Sorted Z-values of AT2G46680 motif
| Promoter | Log-likelihood | Transcript | Gene | Gene Info |
|---|---|---|---|---|
| arTal_v1_Chr5_-_22712441_22712441 | 3.74 |
AT5G56080.1
|
NAS2
|
nicotianamine synthase 2 |
| arTal_v1_Chr3_+_20612693_20612693 | 3.67 |
AT3G55580.1
|
AT3G55580
|
Regulator of chromosome condensation (RCC1) family protein |
| arTal_v1_Chr4_-_7401951_7401951 | 3.39 |
AT4G12470.1
|
AZI1
|
azelaic acid induced 1 |
| arTal_v1_Chr2_-_6493512_6493512 | 3.36 |
AT2G15020.1
|
AT2G15020
|
hypothetical protein |
| arTal_v1_Chr3_+_4729399_4729438 | 3.29 |
AT3G14210.1
AT3G14210.2 |
ESM1
|
GDSL-like lipase/acylhydrolase superfamily protein |
| arTal_v1_Chr3_+_6023844_6023929 | 3.27 |
AT3G17609.2
AT3G17609.3 AT3G17609.4 AT3G17609.1 |
HYH
|
HY5-homolog |
| arTal_v1_Chr4_+_10707344_10707378 | 3.09 |
AT4G19690.2
AT4G19690.1 |
IRT1
|
iron-regulated transporter 1 |
| arTal_v1_Chr3_-_2699257_2699257 | 2.97 |
AT3G08860.2
|
PYD4
|
PYRIMIDINE 4 |
| arTal_v1_Chr3_-_2699420_2699420 | 2.88 |
AT3G08860.1
|
PYD4
|
PYRIMIDINE 4 |
| arTal_v1_Chr1_-_5765798_5765798 | 2.87 |
AT1G16850.1
|
AT1G16850
|
transmembrane protein |
| arTal_v1_Chr2_+_9126263_9126263 | 2.83 |
AT2G21320.1
|
BBX18
|
B-box zinc finger family protein |
| arTal_v1_Chr4_+_15451988_15451988 | 2.77 |
AT4G31940.1
|
CYP82C4
|
cytochrome P450, family 82, subfamily C, polypeptide 4 |
| arTal_v1_Chr1_+_18458526_18458526 | 2.62 |
AT1G49860.1
|
GSTF14
|
glutathione S-transferase (class phi) 14 |
| arTal_v1_Chr2_-_12415661_12415661 | 2.60 |
AT2G28900.1
|
OEP16-1
|
outer plastid envelope protein 16-1 |
| arTal_v1_Chr4_+_1292483_1292494 | 2.53 |
AT4G02920.1
AT4G02920.2 |
AT4G02920
|
hypothetical protein |
| arTal_v1_Chr4_+_8827600_8827710 | 2.53 |
AT4G15430.2
AT4G15430.1 |
AT4G15430
|
ERD (early-responsive to dehydration stress) family protein |
| arTal_v1_Chr1_-_18238497_18238497 | 2.48 |
AT1G49310.1
|
AT1G49310
|
transmembrane protein |
| arTal_v1_Chr1_-_3756998_3756998 | 2.44 |
AT1G11210.1
|
AT1G11210
|
cotton fiber protein, putative (DUF761) |
| arTal_v1_Chr3_-_7796310_7796460 | 2.42 |
AT3G22120.1
AT3G22120.2 |
CWLP
|
cell wall-plasma membrane linker protein |
| arTal_v1_Chr1_+_24554413_24554413 | 2.40 |
AT1G65960.4
|
GAD2
|
glutamate decarboxylase 2 |
| arTal_v1_Chr4_-_2429899_2429899 | 2.40 |
AT4G04770.1
|
ABCI8
|
ATP binding cassette protein 1 |
| arTal_v1_Chr1_-_23246949_23246949 | 2.37 |
AT1G62770.1
|
AT1G62770
|
Plant invertase/pectin methylesterase inhibitor superfamily protein |
| arTal_v1_Chr3_-_23195917_23195917 | 2.32 |
AT3G62700.1
|
ABCC14
|
multidrug resistance-associated protein 10 |
| arTal_v1_Chr4_+_13253084_13253084 | 2.32 |
AT4G26150.1
|
CGA1
|
cytokinin-responsive gata factor 1 |
| arTal_v1_Chr4_-_15954803_15954803 | 2.30 |
AT4G33070.1
|
AT4G33070
|
Thiamine pyrophosphate dependent pyruvate decarboxylase family protein |
| arTal_v1_Chr1_+_24551807_24551807 | 2.28 |
AT1G65960.3
AT1G65960.1 |
GAD2
|
glutamate decarboxylase 2 |
| arTal_v1_Chr3_-_20629295_20629295 | 2.27 |
AT3G55610.1
|
P5CS2
|
delta 1-pyrroline-5-carboxylate synthase 2 |
| arTal_v1_Chr5_-_20204595_20204595 | 2.26 |
AT5G49730.1
AT5G49730.2 |
FRO6
|
ferric reduction oxidase 6 |
| arTal_v1_Chr5_-_22500564_22500714 | 2.25 |
AT5G55540.2
AT5G55540.1 |
TRN1
|
tornado 1 |
| arTal_v1_Chr4_+_9028262_9028262 | 2.25 |
AT4G15910.1
|
DI21
|
drought-induced 21 |
| arTal_v1_Chr3_+_19845097_19845172 | 2.24 |
AT3G53530.2
AT3G53530.1 |
NAKR3
|
Chloroplast-targeted copper chaperone protein |
| arTal_v1_Chr1_+_4056165_4056165 | 2.23 |
AT1G12010.1
|
AT1G12010
|
2-oxoglutarate (2OG) and Fe(II)-dependent oxygenase superfamily protein |
| arTal_v1_Chr2_-_16603059_16603061 | 2.21 |
AT2G39800.2
AT2G39800.4 AT2G39800.3 |
P5CS1
|
delta1-pyrroline-5-carboxylate synthase 1 |
| arTal_v1_Chr5_-_22991530_22991530 | 2.20 |
AT5G56860.1
|
GNC
|
GATA type zinc finger transcription factor family protein |
| arTal_v1_Chr1_+_27538190_27538190 | 2.19 |
AT1G73220.1
|
OCT1
|
organic cation/carnitine transporter1 |
| arTal_v1_Chr2_+_6893949_6893949 | 2.18 |
AT2G15830.1
|
AT2G15830
|
hypothetical protein |
| arTal_v1_Chr3_-_20629093_20629093 | 2.18 |
AT3G55610.2
|
P5CS2
|
delta 1-pyrroline-5-carboxylate synthase 2 |
| arTal_v1_Chr1_+_7785708_7785708 | 2.18 |
AT1G22065.1
|
AT1G22065
|
hypothetical protein |
| arTal_v1_Chr1_-_22317070_22317070 | 2.17 |
AT1G60590.1
|
AT1G60590
|
Pectin lyase-like superfamily protein |
| arTal_v1_Chr3_-_5173001_5173105 | 2.17 |
AT3G15354.4
AT3G15354.1 AT3G15354.2 AT3G15354.3 |
SPA3
|
SPA1-related 3 |
| arTal_v1_Chr1_-_23251195_23251195 | 2.17 |
AT1G62780.1
|
AT1G62780
|
dimethylallyl, adenosine tRNA methylthiotransferase |
| arTal_v1_Chr1_+_19685747_19685747 | 2.15 |
AT1G52870.1
|
AT1G52870
|
Peroxisomal membrane 22 kDa (Mpv17/PMP22) family protein |
| arTal_v1_Chr1_+_19685545_19685545 | 2.14 |
AT1G52870.2
|
AT1G52870
|
Peroxisomal membrane 22 kDa (Mpv17/PMP22) family protein |
| arTal_v1_Chr2_-_17202848_17202848 | 2.12 |
AT2G41250.1
|
AT2G41250
|
Haloacid dehalogenase-like hydrolase (HAD) superfamily protein |
| arTal_v1_Chr5_+_16579936_16579936 | 2.10 |
AT5G41410.1
|
BEL1
|
POX (plant homeobox) family protein |
| arTal_v1_Chr4_-_12345652_12345652 | 2.09 |
AT4G23700.2
|
CHX17
|
cation/H+ exchanger 17 |
| arTal_v1_Chr3_+_2465235_2465235 | 2.07 |
AT3G07720.1
|
AT3G07720
|
Galactose oxidase/kelch repeat superfamily protein |
| arTal_v1_Chr3_-_2569700_2569700 | 2.07 |
AT3G08040.2
AT3G08040.1 |
FRD3
|
MATE efflux family protein |
| arTal_v1_Chr1_+_24552003_24552003 | 2.04 |
AT1G65960.2
|
GAD2
|
glutamate decarboxylase 2 |
| arTal_v1_Chr3_-_4762457_4762457 | 2.04 |
AT3G14280.1
|
AT3G14280
|
LL-diaminopimelate aminotransferase |
| arTal_v1_Chr4_-_12346051_12346051 | 2.03 |
AT4G23700.1
|
CHX17
|
cation/H+ exchanger 17 |
| arTal_v1_Chr2_+_13814543_13814543 | 1.99 |
AT2G32540.1
|
CSLB04
|
cellulose synthase-like B4 |
| arTal_v1_Chr2_+_18346306_18346306 | 1.98 |
AT2G44460.1
|
BGLU28
|
beta glucosidase 28 |
| arTal_v1_Chr5_-_25920254_25920254 | 1.98 |
AT5G64840.1
|
ABCF5
|
general control non-repressible 5 |
| arTal_v1_Chr1_-_28302728_28302728 | 1.98 |
AT1G75410.3
AT1G75410.1 |
BLH3
|
BEL1-like homeodomain 3 |
| arTal_v1_Chr1_+_25016402_25016402 | 1.97 |
AT1G67030.1
|
ZFP6
|
zinc finger protein 6 |
| arTal_v1_Chr3_-_10599042_10599042 | 1.96 |
AT3G28345.1
|
ABCB15
|
ABC transporter family protein |
| arTal_v1_Chr3_-_18375784_18375784 | 1.95 |
AT3G49580.3
AT3G49580.2 |
LSU1
|
response to low sulfur 1 |
| arTal_v1_Chr1_+_29759030_29759158 | 1.95 |
AT1G79110.2
AT1G79110.3 AT1G79110.1 |
BRG2
|
zinc ion binding protein |
| arTal_v1_Chr2_-_19165233_19165233 | 1.95 |
AT2G46670.1
|
AT2G46670
|
CCT motif family protein |
| arTal_v1_Chr4_-_18551183_18551183 | 1.94 |
AT4G40010.1
|
SNRK2.7
|
SNF1-related protein kinase 2.7 |
| arTal_v1_Chr5_-_22680152_22680152 | 1.94 |
AT5G56000.1
|
Hsp81.4
|
HEAT SHOCK PROTEIN 81.4 |
| arTal_v1_Chr5_+_21020014_21020014 | 1.94 |
AT5G51750.1
|
SBT1.3
|
subtilase 1.3 |
| arTal_v1_Chr1_-_450426_450426 | 1.93 |
AT1G02280.1
AT1G02280.2 |
TOC33
|
translocon at the outer envelope membrane of chloroplasts 33 |
| arTal_v1_Chr2_+_528179_528179 | 1.93 |
AT2G02100.1
|
LCR69
|
low-molecular-weight cysteine-rich 69 |
| arTal_v1_Chr2_-_16664431_16664539 | 1.92 |
AT2G39920.4
AT2G39920.1 AT2G39920.3 AT2G39920.2 |
AT2G39920
|
HAD superfamily, subfamily IIIB acid phosphatase |
| arTal_v1_Chr3_-_82182_82182 | 1.92 |
AT3G01260.1
|
AT3G01260
|
Galactose mutarotase-like superfamily protein |
| arTal_v1_Chr4_-_9583290_9583290 | 1.92 |
AT4G17030.1
|
EXLB1
|
expansin-like B1 |
| arTal_v1_Chr1_+_28498821_28498821 | 1.89 |
AT1G75900.1
|
AT1G75900
|
GDSL-like Lipase/Acylhydrolase superfamily protein |
| arTal_v1_Chr5_+_19005547_19005601 | 1.88 |
AT5G46840.1
AT5G46840.2 |
AT5G46840
|
RNA-binding (RRM/RBD/RNP motifs) family protein |
| arTal_v1_Chr3_+_22216540_22216540 | 1.88 |
AT3G60140.2
AT3G60140.1 |
DIN2
|
Glycosyl hydrolase superfamily protein |
| arTal_v1_Chr1_+_28829243_28829243 | 1.88 |
AT1G76800.1
|
AT1G76800
|
Vacuolar iron transporter (VIT) family protein |
| arTal_v1_Chr2_+_18347765_18347765 | 1.87 |
AT2G44460.2
|
BGLU28
|
beta glucosidase 28 |
| arTal_v1_Chr5_-_25898171_25898171 | 1.86 |
AT5G64770.1
|
RGF9
|
root meristem growth factor |
| arTal_v1_Chr5_-_648538_648538 | 1.85 |
AT5G02830.1
|
AT5G02830
|
Tetratricopeptide repeat (TPR)-like superfamily protein |
| arTal_v1_Chr1_+_9829261_9829261 | 1.85 |
AT1G28135.1
|
AT1G28135
|
hypothetical protein |
| arTal_v1_Chr1_+_23328727_23328727 | 1.85 |
AT1G62975.2
AT1G62975.1 |
AT1G62975
|
basic helix-loop-helix (bHLH) DNA-binding superfamily protein |
| arTal_v1_Chr5_+_18850645_18850776 | 1.85 |
AT5G46490.3
AT5G46490.4 AT5G46490.5 AT5G46490.6 AT5G46490.7 AT5G46490.1 AT5G46490.8 AT5G46490.2 |
AT5G46490
|
Disease resistance protein (TIR-NBS-LRR class) family |
| arTal_v1_Chr4_+_11306945_11306945 | 1.84 |
AT4G21210.2
AT4G21210.1 |
RP1
|
PPDK regulatory protein |
| arTal_v1_Chr3_-_17506124_17506124 | 1.84 |
AT3G47500.1
|
CDF3
|
cycling DOF factor 3 |
| arTal_v1_Chr1_-_4651549_4651549 | 1.83 |
AT1G13600.1
|
bZIP58
|
basic leucine-zipper 58 |
| arTal_v1_Chr2_-_15599951_15599951 | 1.83 |
AT2G37130.2
|
AT2G37130
|
Peroxidase superfamily protein |
| arTal_v1_Chr4_-_5456100_5456100 | 1.81 |
AT4G08570.1
|
AT4G08570
|
Heavy metal transport/detoxification superfamily protein |
| arTal_v1_Chr3_+_484256_484287 | 1.81 |
AT3G02370.1
AT3G02370.4 AT3G02370.2 AT3G02370.3 |
AT3G02370
|
tRNA-splicing endonuclease subunit |
| arTal_v1_Chr2_+_15053483_15053483 | 1.81 |
AT2G35840.4
AT2G35840.2 AT2G35840.1 |
AT2G35840
|
Sucrose-6F-phosphate phosphohydrolase family protein |
| arTal_v1_Chr1_-_26434538_26434538 | 1.80 |
AT1G70200.1
|
AT1G70200
|
RNA-binding (RRM/RBD/RNP motifs) family protein |
| arTal_v1_Chr2_+_10244745_10244745 | 1.80 |
AT2G24100.1
|
ASG1
|
ATP-dependent DNA helicase |
| arTal_v1_Chr1_+_29356346_29356382 | 1.78 |
AT1G78070.2
AT1G78070.3 |
AT1G78070
|
Transducin/WD40 repeat-like superfamily protein |
| arTal_v1_Chr4_-_571595_571595 | 1.78 |
AT4G01390.1
|
AT4G01390
|
TRAF-like family protein |
| arTal_v1_Chr2_-_15092353_15092415 | 1.78 |
AT2G35940.3
AT2G35940.1 |
BLH1
|
BEL1-like homeodomain 1 |
| arTal_v1_Chr5_-_25462458_25462568 | 1.78 |
AT5G63600.2
AT5G63600.1 |
FLS5
|
flavonol synthase 5 |
| arTal_v1_Chr1_-_3518035_3518035 | 1.77 |
AT1G10640.1
|
AT1G10640
|
Pectin lyase-like superfamily protein |
| arTal_v1_Chr2_+_1966806_1966816 | 1.77 |
AT2G05380.1
AT2G05380.2 |
GRP3S
|
glycine-rich protein 3 short isoform |
| arTal_v1_Chr3_-_7463525_7463644 | 1.76 |
AT3G21250.1
AT3G21250.6 AT3G21250.5 AT3G21250.3 AT3G21250.2 AT3G21250.4 |
ABCC8
|
multidrug resistance-associated protein 6 |
| arTal_v1_Chr1_-_17266724_17266824 | 1.76 |
AT1G46768.3
AT1G46768.2 AT1G46768.1 |
RAP2.1
|
related to AP2 1 |
| arTal_v1_Chr2_-_16603319_16603319 | 1.76 |
AT2G39800.1
|
P5CS1
|
delta1-pyrroline-5-carboxylate synthase 1 |
| arTal_v1_Chr5_-_20208730_20208777 | 1.75 |
AT5G49740.3
AT5G49740.2 AT5G49740.1 |
FRO7
|
ferric reduction oxidase 7 |
| arTal_v1_Chr2_-_15600154_15600154 | 1.75 |
AT2G37130.1
|
AT2G37130
|
Peroxidase superfamily protein |
| arTal_v1_Chr2_-_14268003_14268003 | 1.75 |
AT2G33730.1
|
AT2G33730
|
P-loop containing nucleoside triphosphate hydrolases superfamily protein |
| arTal_v1_Chr2_+_1966610_1966610 | 1.75 |
AT2G05380.3
|
GRP3S
|
glycine-rich protein 3 short isoform |
| arTal_v1_Chr4_-_18370698_18370698 | 1.75 |
AT4G39510.1
|
CYP96A12
|
cytochrome P450, family 96, subfamily A, polypeptide 12 |
| arTal_v1_Chr5_-_17467377_17467448 | 1.74 |
AT5G43470.3
AT5G43470.2 AT5G43470.4 |
RPP8
|
Disease resistance protein (CC-NBS-LRR class) family |
| arTal_v1_Chr3_-_18375940_18375940 | 1.72 |
AT3G49580.1
|
LSU1
|
response to low sulfur 1 |
| arTal_v1_Chr3_+_22635803_22635816 | 1.71 |
AT3G61160.3
AT3G61160.6 AT3G61160.5 AT3G61160.4 AT3G61160.2 AT3G61160.1 |
AT3G61160
|
Protein kinase superfamily protein |
| arTal_v1_Chr1_-_28302571_28302571 | 1.71 |
AT1G75410.2
|
BLH3
|
BEL1-like homeodomain 3 |
| arTal_v1_Chr2_-_14310608_14310608 | 1.71 |
AT2G33830.2
|
AT2G33830
|
Dormancy/auxin associated family protein |
| arTal_v1_Chr5_+_26688943_26688943 | 1.70 |
AT5G66820.1
|
AT5G66820
|
transmembrane protein |
| arTal_v1_Chr3_+_11810726_11810726 | 1.70 |
AT3G30180.1
|
BR6OX2
|
brassinosteroid-6-oxidase 2 |
| arTal_v1_Chr3_-_16074929_16074929 | 1.70 |
AT3G44450.1
|
AT3G44450
|
hypothetical protein |
| arTal_v1_Chr3_+_3942257_3942257 | 1.70 |
AT3G12390.1
|
AT3G12390
|
Nascent polypeptide-associated complex (NAC), alpha subunit family protein |
| arTal_v1_Chr1_+_16263805_16263805 | 1.69 |
AT1G43160.1
|
RAP2.6
|
related to AP2 6 |
| arTal_v1_Chr2_-_521707_521737 | 1.68 |
AT2G02080.4
AT2G02080.2 AT2G02080.5 AT2G02080.6 AT2G02080.3 AT2G02080.1 |
IDD4
|
indeterminate(ID)-domain 4 |
| arTal_v1_Chr3_+_15983199_15983199 | 1.68 |
AT3G44300.1
|
NIT2
|
nitrilase 2 |
| arTal_v1_Chr4_-_11313709_11313850 | 1.67 |
AT4G21215.1
AT4G21215.2 |
AT4G21215
|
transmembrane protein |
| arTal_v1_Chr1_+_25746697_25746697 | 1.67 |
AT1G68570.1
|
AT1G68570
|
Major facilitator superfamily protein |
| arTal_v1_Chr5_+_9033204_9033204 | 1.66 |
AT5G25890.1
|
IAA28
|
indole-3-acetic acid inducible 28 |
| arTal_v1_Chr2_-_18811085_18811125 | 1.66 |
AT2G45660.2
AT2G45660.1 |
AGL20
|
AGAMOUS-like 20 |
| arTal_v1_Chr2_-_14310339_14310339 | 1.66 |
AT2G33830.1
|
AT2G33830
|
Dormancy/auxin associated family protein |
| arTal_v1_Chr1_+_22198266_22198266 | 1.66 |
AT1G60190.1
|
PUB19
|
ARM repeat superfamily protein |
| arTal_v1_Chr2_-_9231580_9231580 | 1.65 |
AT2G21560.1
|
AT2G21560
|
nucleolar-like protein |
| arTal_v1_Chr1_-_26800483_26800483 | 1.65 |
AT1G71040.1
|
LPR2
|
Cupredoxin superfamily protein |
| arTal_v1_Chr3_-_22915393_22915393 | 1.65 |
AT3G61890.1
|
HB-12
|
homeobox 12 |
| arTal_v1_Chr5_-_1994824_1994961 | 1.65 |
AT5G06530.2
AT5G06530.3 AT5G06530.4 AT5G06530.1 |
ABCG22
|
ABC-2 type transporter family protein |
| arTal_v1_Chr3_+_5243432_5243432 | 1.65 |
AT3G15510.1
|
NAC2
|
NAC domain containing protein 2 |
| arTal_v1_Chr1_-_23818481_23818481 | 1.64 |
AT1G64170.1
|
CHX16
|
cation/H+ exchanger 16 |
| arTal_v1_Chr5_+_17564697_17564738 | 1.64 |
AT5G43740.2
AT5G43740.1 |
AT5G43740
|
Disease resistance protein (CC-NBS-LRR class) family |
| arTal_v1_Chr1_-_4845847_4845913 | 1.64 |
AT1G14170.2
AT1G14170.1 AT1G14170.3 |
AT1G14170
|
RNA-binding KH domain-containing protein |
| arTal_v1_Chr5_+_22671113_22671113 | 1.64 |
AT5G55990.1
AT5G55990.2 |
CBL2
|
calcineurin B-like protein 2 |
| arTal_v1_Chr3_-_18373147_18373147 | 1.64 |
AT3G49570.1
|
LSU3
|
response to low sulfur 3 |
| arTal_v1_Chr1_+_4467094_4467094 | 1.63 |
AT1G13110.1
|
CYP71B7
|
cytochrome P450, family 71 subfamily B, polypeptide 7 |
| arTal_v1_Chr1_+_13225168_13225168 | 1.63 |
AT1G35720.1
|
ANNAT1
|
annexin 1 |
| arTal_v1_Chr4_-_16631339_16631370 | 1.63 |
AT4G34900.3
AT4G34900.2 AT4G34900.1 |
XDH2
|
xanthine dehydrogenase 2 |
| arTal_v1_Chr4_+_5812335_5812335 | 1.62 |
AT4G09110.1
|
AT4G09110
|
RING/U-box superfamily protein |
| arTal_v1_Chr4_-_17831619_17831619 | 1.62 |
AT4G37925.1
|
NdhM
|
subunit NDH-M of NAD(P)H:plastoquinone dehydrogenase complex |
| arTal_v1_Chr2_+_1576694_1576694 | 1.62 |
AT2G04530.1
|
CPZ
|
Metallo-hydrolase/oxidoreductase superfamily protein |
| arTal_v1_Chr4_-_7553332_7553375 | 1.62 |
AT4G12910.2
AT4G12910.1 |
scpl20
|
serine carboxypeptidase-like 20 |
| arTal_v1_Chr3_-_19547171_19547171 | 1.61 |
AT3G52740.1
|
AT3G52740
|
hypothetical protein |
| arTal_v1_Chr1_-_13698739_13698739 | 1.61 |
AT1G36370.1
|
SHM7
|
serine hydroxymethyltransferase 7 |
| arTal_v1_Chr1_-_11719988_11719988 | 1.60 |
AT1G32450.1
|
NRT1.5
|
nitrate transporter 1.5 |
| arTal_v1_Chr3_-_5181537_5181586 | 1.59 |
AT3G15353.1
AT3G15353.2 |
MT3
|
metallothionein 3 |
| arTal_v1_Chr4_-_11659105_11659167 | 1.59 |
AT4G21990.1
AT4G21990.2 |
APR3
|
APS reductase 3 |
| arTal_v1_Chr4_+_18160903_18160903 | 1.59 |
AT4G38960.2
AT4G38960.6 AT4G38960.5 AT4G38960.1 AT4G38960.4 |
BBX19
|
B-box type zinc finger family protein |
| arTal_v1_Chr5_-_23995865_23995865 | 1.59 |
AT5G59530.1
|
AT5G59530
|
2-oxoglutarate (2OG) and Fe(II)-dependent oxygenase superfamily protein |
| arTal_v1_Chr4_+_10953540_10953540 | 1.58 |
AT4G20280.1
|
TAF11
|
TBP-associated factor 11 |
| arTal_v1_Chr2_-_856725_856725 | 1.58 |
AT2G02950.1
|
PKS1
|
phytochrome kinase substrate 1 |
| arTal_v1_Chr3_+_20842145_20842145 | 1.58 |
AT3G56170.1
|
CAN
|
Ca-2+ dependent nuclease |
| arTal_v1_Chr3_-_18718396_18718396 | 1.58 |
AT3G50440.1
|
MES10
|
methylesterase |
| arTal_v1_Chr1_+_26122080_26122080 | 1.58 |
AT1G69490.1
|
NAP
|
NAC-like, activated by AP3/PI |
| arTal_v1_Chr1_+_6759859_6759965 | 1.58 |
AT1G19520.1
AT1G19520.2 |
NFD5
|
pentatricopeptide (PPR) repeat-containing protein |
| arTal_v1_Chr5_-_18189523_18189523 | 1.57 |
AT5G45070.1
|
PP2-A8
|
phloem protein 2-A8 |
| arTal_v1_Chr5_-_23117403_23117686 | 1.57 |
AT5G57110.3
AT5G57110.1 AT5G57110.2 |
ACA8
|
autoinhibited Ca2+ -ATPase, isoform 8 |
| arTal_v1_Chr1_-_1894019_1894194 | 1.57 |
AT1G06190.4
AT1G06190.2 AT1G06190.5 AT1G06190.1 AT1G06190.3 |
RHON1
|
Rho termination factor |
| arTal_v1_Chr5_-_22944970_22944993 | 1.57 |
AT5G56710.2
AT5G56710.1 |
AT5G56710
|
Ribosomal protein L31e family protein |
| arTal_v1_Chr1_+_24097913_24097913 | 1.56 |
AT1G64860.2
|
SIGA
|
sigma factor A |
| arTal_v1_Chr1_+_25746994_25746994 | 1.56 |
AT1G68570.2
|
AT1G68570
|
Major facilitator superfamily protein |
| arTal_v1_Chr1_+_14158452_14158452 | 1.56 |
AT1G37130.1
|
NIA2
|
nitrate reductase 2 |
| arTal_v1_Chr4_+_9560078_9560135 | 1.56 |
AT4G16990.16
AT4G16990.17 AT4G16990.1 AT4G16990.3 AT4G16990.4 |
RLM3
|
disease resistance protein (TIR-NBS class) |
| arTal_v1_Chr1_+_18701882_18701882 | 1.56 |
AT1G50480.1
|
THFS
|
10-formyltetrahydrofolate synthetase |
| arTal_v1_Chr4_-_843531_843531 | 1.56 |
AT4G01940.1
|
NFU1
|
NFU domain protein 1 |
| arTal_v1_Chr2_-_15783480_15783480 | 1.56 |
AT2G37630.1
|
AS1
|
myb-like HTH transcriptional regulator family protein |
| arTal_v1_Chr5_+_105268_105282 | 1.56 |
AT5G01260.3
AT5G01260.2 AT5G01260.1 |
AT5G01260
|
Carbohydrate-binding-like fold |
| arTal_v1_Chr5_+_579744_579852 | 1.56 |
AT5G02580.1
AT5G02580.3 AT5G02580.2 |
AT5G02580
|
argininosuccinate lyase |
| arTal_v1_Chr1_+_24097736_24097736 | 1.56 |
AT1G64860.1
|
SIGA
|
sigma factor A |
| arTal_v1_Chr1_-_8688246_8688247 | 1.55 |
AT1G24510.1
AT1G24510.2 AT1G24510.3 |
AT1G24510
|
TCP-1/cpn60 chaperonin family protein |
| arTal_v1_Chr1_+_29354944_29354944 | 1.55 |
AT1G78070.1
|
AT1G78070
|
Transducin/WD40 repeat-like superfamily protein |
| arTal_v1_Chr2_-_827994_827994 | 1.55 |
AT2G02850.1
|
ARPN
|
plantacyanin |
| arTal_v1_Chr4_-_12421464_12421464 | 1.55 |
AT4G23890.1
|
NdhS
|
NAD(P)H-quinone oxidoreductase subunit S |
| arTal_v1_Chr1_-_3590928_3590928 | 1.54 |
AT1G10760.1
AT1G10760.3 |
SEX1
|
Pyruvate phosphate dikinase, PEP/pyruvate binding domain-containing protein |
| arTal_v1_Chr3_+_19825267_19825267 | 1.54 |
AT3G53480.1
|
ABCG37
|
pleiotropic drug resistance 9 |
| arTal_v1_Chr3_-_1305879_1305950 | 1.54 |
AT3G04760.2
AT3G04760.1 |
AT3G04760
|
Pentatricopeptide repeat (PPR-like) superfamily protein |
| arTal_v1_Chr3_+_16386395_16386395 | 1.53 |
AT3G44890.1
|
RPL9
|
ribosomal protein L9 |
| arTal_v1_Chr1_-_27732273_27732273 | 1.53 |
AT1G73730.2
|
EIL3
|
ETHYLENE-INSENSITIVE3-like 3 |
| arTal_v1_Chr2_-_15092178_15092178 | 1.53 |
AT2G35940.2
|
BLH1
|
BEL1-like homeodomain 1 |
| arTal_v1_Chr1_-_4921535_4921682 | 1.53 |
AT1G14380.3
AT1G14380.4 AT1G14380.2 AT1G14380.5 AT1G14380.6 AT1G14380.7 AT1G14380.1 |
IQD28
|
IQ-domain 28 |
| arTal_v1_Chr2_+_7267722_7267722 | 1.52 |
AT2G16740.1
|
UBC29
|
ubiquitin-conjugating enzyme 29 |
| arTal_v1_Chr4_-_17564763_17564763 | 1.52 |
AT4G37330.1
|
CYP81D4
|
cytochrome P450, family 81, subfamily D, polypeptide 4 |
| arTal_v1_Chr5_+_26884203_26884303 | 1.52 |
AT5G67385.3
AT5G67385.1 AT5G67385.5 AT5G67385.4 |
AT5G67385
|
Phototropic-responsive NPH3 family protein |
| arTal_v1_Chr4_-_13001948_13001948 | 1.52 |
AT4G25433.1
|
AT4G25433
|
peptidoglycan-binding LysM domain-containing protein |
| arTal_v1_Chr1_+_99865_99872 | 1.51 |
AT1G01240.4
AT1G01240.2 AT1G01240.1 AT1G01240.3 AT1G01240.5 |
AT1G01240
|
transmembrane protein |
| arTal_v1_Chr4_-_16799553_16799823 | 1.51 |
AT4G35300.11
AT4G35300.1 AT4G35300.2 AT4G35300.9 AT4G35300.3 AT4G35300.8 AT4G35300.6 AT4G35300.5 AT4G35300.4 AT4G35300.7 AT4G35300.10 |
TMT2
|
tonoplast monosaccharide transporter2 |
| arTal_v1_Chr5_-_18435469_18435524 | 1.51 |
AT5G45500.3
AT5G45500.6 AT5G45500.2 AT5G45500.9 AT5G45500.1 AT5G45500.4 AT5G45500.7 AT5G45500.8 AT5G45500.5 |
AT5G45500
|
RNI-like superfamily protein |
| arTal_v1_Chr5_-_23431198_23431198 | 1.51 |
AT5G57830.1
|
AT5G57830
|
zein-binding protein (Protein of unknown function, DUF593) |
| arTal_v1_Chr1_+_18870059_18870059 | 1.51 |
AT1G50920.1
|
AT1G50920
|
Nucleolar GTP-binding protein |
| arTal_v1_Chr3_-_9494302_9494302 | 1.50 |
AT3G25930.1
|
AT3G25930
|
Adenine nucleotide alpha hydrolases-like superfamily protein |
| arTal_v1_Chr3_-_3961911_3961920 | 1.50 |
AT3G12490.1
AT3G12490.2 |
CYSB
|
cystatin B |
| arTal_v1_Chr4_+_17739514_17739514 | 1.50 |
AT4G37750.1
|
ANT
|
Integrase-type DNA-binding superfamily protein |
| arTal_v1_Chr4_-_13860745_13860745 | 1.50 |
AT4G27820.1
AT4G27820.2 |
BGLU9
|
beta glucosidase 9 |
| arTal_v1_Chr1_-_6555610_6555610 | 1.49 |
AT1G18970.1
|
GLP4
|
germin-like protein 4 |
| arTal_v1_Chr2_-_11834427_11834427 | 1.49 |
AT2G27770.1
|
AT2G27770
|
DUF868 family protein (DUF868) |
| arTal_v1_Chr5_-_21291928_21291928 | 1.49 |
AT5G52450.1
|
AT5G52450
|
MATE efflux family protein |
| arTal_v1_Chr4_+_12310885_12310885 | 1.48 |
AT4G23600.2
|
CORI3
|
Tyrosine transaminase family protein |
| arTal_v1_Chr1_+_11479763_11479763 | 1.48 |
AT1G31970.1
|
STRS1
|
DEA(D/H)-box RNA helicase family protein |
| arTal_v1_Chr5_-_25676823_25676823 | 1.48 |
AT5G64170.1
AT5G64170.2 AT5G64170.3 |
AT5G64170
|
dentin sialophosphoprotein-like protein |
| arTal_v1_Chr4_-_9171064_9171064 | 1.48 |
AT4G16180.2
|
AT4G16180
|
transmembrane protein |
| arTal_v1_Chr1_+_25701770_25701770 | 1.48 |
AT1G68500.1
|
AT1G68500
|
hypothetical protein |
| arTal_v1_Chr4_-_17830465_17830465 | 1.48 |
AT4G37920.1
|
AT4G37920
|
endoribonuclease E-like protein |
| arTal_v1_Chr4_+_9558571_9558721 | 1.48 |
AT4G16990.5
AT4G16990.8 AT4G16990.7 AT4G16990.6 AT4G16990.2 AT4G16990.9 |
RLM3
|
disease resistance protein (TIR-NBS class) |
| arTal_v1_Chr1_-_22382422_22382422 | 1.47 |
AT1G60790.1
|
TBL2
|
trichome birefringence-like protein (DUF828) |
| arTal_v1_Chr2_+_7964326_7964326 | 1.47 |
AT2G18328.1
|
RL4
|
RAD-like 4 |
| arTal_v1_Chr4_-_10291058_10291058 | 1.47 |
AT4G18700.1
|
CIPK12
|
CBL-interacting protein kinase 12 |
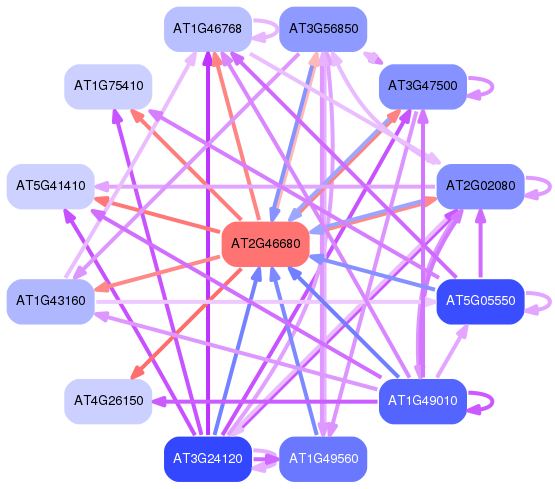
Network of associatons between targets according to the STRING database.

First level regulatory network of AT2G46680
Gene Ontology Analysis
Gene overrepresentation in biological process category:
| Log-likelihood per target | Total log-likelihood | Term | Description |
|---|---|---|---|
| 2.1 | 2.1 | GO:0080028 | nitrile metabolic process(GO:0050898) nitrile biosynthetic process(GO:0080028) |
| 1.5 | 1.5 | GO:0071366 | cellular response to indolebutyric acid stimulus(GO:0071366) |
| 1.4 | 8.7 | GO:0055129 | L-proline biosynthetic process(GO:0055129) |
| 1.1 | 4.5 | GO:0030418 | nicotianamine metabolic process(GO:0030417) nicotianamine biosynthetic process(GO:0030418) tricarboxylic acid biosynthetic process(GO:0072351) |
| 1.0 | 3.1 | GO:0071461 | cellular response to redox state(GO:0071461) |
| 0.9 | 5.7 | GO:1902326 | positive regulation of chlorophyll biosynthetic process(GO:1902326) |
| 0.9 | 2.8 | GO:0071281 | cellular response to iron ion(GO:0071281) |
| 0.8 | 2.5 | GO:0019406 | hexitol metabolic process(GO:0006059) hexitol biosynthetic process(GO:0019406) mannitol biosynthetic process(GO:0019593) mannitol metabolic process(GO:0019594) |
| 0.8 | 2.4 | GO:0010024 | phytochromobilin biosynthetic process(GO:0010024) phytochromobilin metabolic process(GO:0051202) |
| 0.8 | 2.4 | GO:0046898 | response to cycloheximide(GO:0046898) cellular response to external biotic stimulus(GO:0071217) |
| 0.8 | 3.1 | GO:0015675 | nickel cation transport(GO:0015675) |
| 0.8 | 2.3 | GO:0035280 | miRNA loading onto RISC involved in gene silencing by miRNA(GO:0035280) small RNA loading onto RISC(GO:0070922) |
| 0.7 | 5.2 | GO:0010438 | cellular response to sulfur starvation(GO:0010438) |
| 0.7 | 2.2 | GO:0015696 | ammonium transport(GO:0015696) |
| 0.7 | 2.2 | GO:0010028 | xanthophyll cycle(GO:0010028) |
| 0.7 | 3.4 | GO:0010361 | negative regulation of anion channel activity(GO:0010360) regulation of anion channel activity by blue light(GO:0010361) negative regulation of anion channel activity by blue light(GO:0010362) negative regulation of transporter activity(GO:0032410) negative regulation of ion transmembrane transporter activity(GO:0032413) negative regulation of transmembrane transport(GO:0034763) negative regulation of ion transmembrane transport(GO:0034766) negative regulation of anion transport(GO:1903792) negative regulation of anion transmembrane transport(GO:1903960) |
| 0.7 | 3.3 | GO:0010201 | response to continuous far red light stimulus by the high-irradiance response system(GO:0010201) |
| 0.7 | 2.6 | GO:2000769 | establishment or maintenance of cell polarity regulating cell shape(GO:0071963) regulation of establishment or maintenance of cell polarity regulating cell shape(GO:2000769) |
| 0.6 | 3.9 | GO:0010258 | NADH dehydrogenase complex (plastoquinone) assembly(GO:0010258) |
| 0.6 | 2.6 | GO:0034414 | tRNA 3'-trailer cleavage, endonucleolytic(GO:0034414) |
| 0.6 | 2.5 | GO:1901333 | positive regulation of lateral root development(GO:1901333) |
| 0.6 | 0.6 | GO:0018023 | peptidyl-lysine trimethylation(GO:0018023) histone H3-K4 trimethylation(GO:0080182) |
| 0.5 | 4.9 | GO:0010188 | response to microbial phytotoxin(GO:0010188) |
| 0.5 | 1.6 | GO:0060964 | regulation of gene silencing by miRNA(GO:0060964) |
| 0.5 | 1.6 | GO:1900111 | positive regulation of histone H3-K9 dimethylation(GO:1900111) |
| 0.5 | 4.8 | GO:0048363 | mucilage pectin metabolic process(GO:0048363) |
| 0.5 | 2.7 | GO:0006809 | nitric oxide biosynthetic process(GO:0006809) |
| 0.5 | 3.2 | GO:0031116 | positive regulation of microtubule polymerization or depolymerization(GO:0031112) positive regulation of microtubule polymerization(GO:0031116) |
| 0.5 | 6.9 | GO:2000071 | regulation of defense response by callose deposition(GO:2000071) |
| 0.5 | 3.2 | GO:0002230 | positive regulation of defense response to virus by host(GO:0002230) |
| 0.5 | 2.1 | GO:0035494 | SNARE complex disassembly(GO:0035494) |
| 0.5 | 1.6 | GO:0010792 | DNA double-strand break processing involved in repair via single-strand annealing(GO:0010792) double-strand break repair via single-strand annealing(GO:0045002) |
| 0.5 | 1.6 | GO:0009747 | hexokinase-dependent signaling(GO:0009747) |
| 0.5 | 7.2 | GO:0010100 | negative regulation of photomorphogenesis(GO:0010100) |
| 0.5 | 2.1 | GO:0019499 | cyanide metabolic process(GO:0019499) |
| 0.5 | 1.5 | GO:0010444 | guard mother cell differentiation(GO:0010444) |
| 0.5 | 1.4 | GO:0008608 | attachment of spindle microtubules to kinetochore(GO:0008608) |
| 0.5 | 2.4 | GO:2000576 | regulation of microtubule motor activity(GO:2000574) positive regulation of microtubule motor activity(GO:2000576) regulation of ATP-dependent microtubule motor activity, plus-end-directed(GO:2000580) positive regulation of ATP-dependent microtubule motor activity, plus-end-directed(GO:2000582) |
| 0.5 | 1.9 | GO:0033499 | galactose catabolic process(GO:0019388) galactose catabolic process via UDP-galactose(GO:0033499) |
| 0.5 | 2.4 | GO:0035627 | ceramide transport(GO:0035627) |
| 0.5 | 1.4 | GO:0010343 | singlet oxygen-mediated programmed cell death(GO:0010343) |
| 0.5 | 0.9 | GO:0080005 | photosystem stoichiometry adjustment(GO:0080005) |
| 0.5 | 2.8 | GO:0070981 | L-asparagine biosynthetic process(GO:0070981) L-asparagine metabolic process(GO:0070982) |
| 0.5 | 4.2 | GO:0097428 | protein maturation by iron-sulfur cluster transfer(GO:0097428) |
| 0.5 | 1.4 | GO:0042908 | xenobiotic transport(GO:0042908) |
| 0.5 | 3.2 | GO:0010106 | cellular response to iron ion starvation(GO:0010106) |
| 0.5 | 0.9 | GO:1902066 | regulation of cell wall pectin metabolic process(GO:1902066) |
| 0.4 | 1.3 | GO:0018119 | protein nitrosylation(GO:0017014) peptidyl-cysteine S-nitrosylation(GO:0018119) peptidyl-cysteine S-trans-nitrosylation(GO:0035606) |
| 0.4 | 2.6 | GO:0043480 | pigment accumulation in response to UV light(GO:0043478) pigment accumulation in tissues in response to UV light(GO:0043479) pigment accumulation in tissues(GO:0043480) anthocyanin accumulation in tissues in response to UV light(GO:0043481) |
| 0.4 | 1.3 | GO:0048729 | establishment of planar polarity(GO:0001736) morphogenesis of a polarized epithelium(GO:0001738) morphogenesis of an epithelium(GO:0002009) tissue morphogenesis(GO:0048729) |
| 0.4 | 1.7 | GO:0006419 | alanyl-tRNA aminoacylation(GO:0006419) |
| 0.4 | 1.3 | GO:1990884 | rRNA acetylation involved in maturation of SSU-rRNA(GO:1904812) rRNA acetylation(GO:1990882) RNA acetylation(GO:1990884) |
| 0.4 | 2.5 | GO:0045723 | positive regulation of fatty acid biosynthetic process(GO:0045723) |
| 0.4 | 1.6 | GO:1902315 | cell cycle DNA replication initiation(GO:1902292) nuclear cell cycle DNA replication initiation(GO:1902315) mitotic DNA replication initiation(GO:1902975) |
| 0.4 | 2.0 | GO:0019419 | sulfate reduction(GO:0019419) |
| 0.4 | 6.7 | GO:1901259 | chloroplast rRNA processing(GO:1901259) |
| 0.4 | 2.0 | GO:0001732 | formation of cytoplasmic translation initiation complex(GO:0001732) |
| 0.4 | 1.2 | GO:0010069 | zygote asymmetric cytokinesis in embryo sac(GO:0010069) |
| 0.4 | 1.9 | GO:0010599 | production of lsiRNA involved in RNA interference(GO:0010599) |
| 0.4 | 1.1 | GO:0031054 | pre-miRNA processing(GO:0031054) |
| 0.4 | 2.2 | GO:0051410 | detoxification of nitrogen compound(GO:0051410) |
| 0.4 | 2.6 | GO:0031119 | tRNA pseudouridine synthesis(GO:0031119) |
| 0.4 | 1.1 | GO:1990532 | stress response to nickel ion(GO:1990532) |
| 0.4 | 0.7 | GO:0016554 | base conversion or substitution editing(GO:0016553) cytidine to uridine editing(GO:0016554) |
| 0.4 | 1.4 | GO:0009590 | detection of gravity(GO:0009590) |
| 0.4 | 0.7 | GO:0051051 | negative regulation of ion transport(GO:0043271) negative regulation of transport(GO:0051051) |
| 0.4 | 2.5 | GO:0043090 | amino acid import(GO:0043090) |
| 0.4 | 1.1 | GO:0045764 | positive regulation of cellular amine metabolic process(GO:0033240) positive regulation of cellular amino acid metabolic process(GO:0045764) |
| 0.4 | 1.8 | GO:1901006 | ubiquinone-6 metabolic process(GO:1901004) ubiquinone-6 biosynthetic process(GO:1901006) |
| 0.3 | 1.4 | GO:0015669 | gas transport(GO:0015669) |
| 0.3 | 1.4 | GO:0009558 | embryo sac cellularization(GO:0009558) |
| 0.3 | 1.0 | GO:0006348 | chromatin silencing at telomere(GO:0006348) |
| 0.3 | 1.0 | GO:1903530 | regulation of exocytosis(GO:0017157) regulation of secretion(GO:0051046) regulation of secretion by cell(GO:1903530) |
| 0.3 | 4.1 | GO:0018026 | peptidyl-lysine monomethylation(GO:0018026) |
| 0.3 | 2.7 | GO:2000757 | negative regulation of histone acetylation(GO:0035067) negative regulation of protein acetylation(GO:1901984) negative regulation of peptidyl-lysine acetylation(GO:2000757) |
| 0.3 | 2.3 | GO:0046482 | para-aminobenzoic acid metabolic process(GO:0046482) |
| 0.3 | 1.0 | GO:1902446 | regulation of shade avoidance(GO:1902446) positive regulation of shade avoidance(GO:1902448) |
| 0.3 | 5.0 | GO:0005986 | sucrose biosynthetic process(GO:0005986) |
| 0.3 | 2.3 | GO:0010148 | transpiration(GO:0010148) |
| 0.3 | 15.1 | GO:0019759 | S-glycoside catabolic process(GO:0016145) glycosinolate catabolic process(GO:0019759) glucosinolate catabolic process(GO:0019762) |
| 0.3 | 3.0 | GO:0080183 | response to photooxidative stress(GO:0080183) |
| 0.3 | 2.3 | GO:0031930 | mitochondria-nucleus signaling pathway(GO:0031930) |
| 0.3 | 2.3 | GO:0009610 | response to symbiotic fungus(GO:0009610) |
| 0.3 | 2.6 | GO:0034471 | rRNA 5'-end processing(GO:0000967) ncRNA 5'-end processing(GO:0034471) |
| 0.3 | 1.3 | GO:0001578 | microtubule bundle formation(GO:0001578) |
| 0.3 | 1.3 | GO:0009660 | amyloplast organization(GO:0009660) |
| 0.3 | 1.3 | GO:0030856 | regulation of epithelial cell differentiation(GO:0030856) regulation of epidermal cell differentiation(GO:0045604) regulation of epidermis development(GO:0045682) |
| 0.3 | 0.9 | GO:0071481 | cellular response to X-ray(GO:0071481) |
| 0.3 | 0.9 | GO:0009662 | etioplast organization(GO:0009662) |
| 0.3 | 2.2 | GO:0051127 | regulation of Arp2/3 complex-mediated actin nucleation(GO:0034315) regulation of actin nucleation(GO:0051125) positive regulation of actin nucleation(GO:0051127) positive regulation of Arp2/3 complex-mediated actin nucleation(GO:2000601) |
| 0.3 | 0.9 | GO:1902464 | histone H3-K27 trimethylation(GO:0098532) regulation of histone H3-K27 trimethylation(GO:1902464) |
| 0.3 | 1.8 | GO:1900367 | positive regulation of defense response to insect(GO:1900367) |
| 0.3 | 0.9 | GO:0007019 | microtubule depolymerization(GO:0007019) |
| 0.3 | 1.2 | GO:1901600 | lactone metabolic process(GO:1901334) lactone biosynthetic process(GO:1901336) strigolactone metabolic process(GO:1901600) strigolactone biosynthetic process(GO:1901601) |
| 0.3 | 1.5 | GO:0010032 | meiotic chromosome condensation(GO:0010032) |
| 0.3 | 2.0 | GO:0010236 | plastoquinone biosynthetic process(GO:0010236) |
| 0.3 | 1.5 | GO:0046713 | borate transport(GO:0046713) |
| 0.3 | 0.6 | GO:0010322 | regulation of isopentenyl diphosphate biosynthetic process, methylerythritol 4-phosphate pathway(GO:0010322) |
| 0.3 | 0.9 | GO:0080153 | regulation of photosynthesis, dark reaction(GO:0010110) cellular response to anoxia(GO:0071454) regulation of reductive pentose-phosphate cycle(GO:0080152) negative regulation of reductive pentose-phosphate cycle(GO:0080153) |
| 0.3 | 0.6 | GO:0071163 | DNA replication preinitiation complex assembly(GO:0071163) |
| 0.3 | 0.9 | GO:1990116 | ribosome-associated ubiquitin-dependent protein catabolic process(GO:1990116) |
| 0.3 | 1.4 | GO:0090436 | leaf pavement cell development(GO:0090436) |
| 0.3 | 1.1 | GO:0046901 | tetrahydrofolylpolyglutamate biosynthetic process(GO:0046901) |
| 0.3 | 0.8 | GO:0046825 | regulation of protein export from nucleus(GO:0046825) |
| 0.3 | 0.6 | GO:0015717 | triose phosphate transport(GO:0015717) triose phosphate transmembrane transport(GO:0035436) |
| 0.3 | 3.4 | GO:0042814 | monopolar cell growth(GO:0042814) |
| 0.3 | 0.8 | GO:0046505 | sulfolipid metabolic process(GO:0046505) sulfolipid biosynthetic process(GO:0046506) |
| 0.3 | 1.4 | GO:0071277 | cellular response to calcium ion(GO:0071277) |
| 0.3 | 1.7 | GO:0010338 | leaf formation(GO:0010338) |
| 0.3 | 0.5 | GO:1902969 | mitotic DNA replication(GO:1902969) |
| 0.3 | 1.1 | GO:0016099 | monoterpenoid metabolic process(GO:0016098) monoterpenoid biosynthetic process(GO:0016099) |
| 0.3 | 0.8 | GO:0055047 | generative cell mitosis(GO:0055047) |
| 0.3 | 1.1 | GO:0080026 | response to indolebutyric acid(GO:0080026) |
| 0.3 | 0.8 | GO:0048478 | DNA rewinding(GO:0036292) replication fork protection(GO:0048478) |
| 0.3 | 0.5 | GO:0036473 | cell death in response to oxidative stress(GO:0036473) programmed cell death in response to reactive oxygen species(GO:0097468) |
| 0.3 | 0.3 | GO:0040030 | regulation of molecular function, epigenetic(GO:0040030) negative regulation of molecular function, epigenetic(GO:0045857) |
| 0.3 | 1.6 | GO:1901001 | negative regulation of response to salt stress(GO:1901001) |
| 0.3 | 2.4 | GO:0045836 | positive regulation of meiotic nuclear division(GO:0045836) |
| 0.3 | 2.7 | GO:0045962 | positive regulation of development, heterochronic(GO:0045962) |
| 0.3 | 2.1 | GO:0010190 | cytochrome b6f complex assembly(GO:0010190) |
| 0.3 | 1.1 | GO:0006741 | NADP biosynthetic process(GO:0006741) |
| 0.3 | 1.1 | GO:0030643 | cellular phosphate ion homeostasis(GO:0030643) cellular trivalent inorganic anion homeostasis(GO:0072502) |
| 0.3 | 0.3 | GO:0046166 | glyceraldehyde-3-phosphate biosynthetic process(GO:0046166) |
| 0.3 | 2.1 | GO:1901880 | negative regulation of actin filament depolymerization(GO:0030835) negative regulation of protein complex disassembly(GO:0043242) actin filament capping(GO:0051693) negative regulation of protein depolymerization(GO:1901880) |
| 0.3 | 1.1 | GO:0070676 | intralumenal vesicle formation(GO:0070676) |
| 0.3 | 1.0 | GO:0007112 | male meiosis cytokinesis(GO:0007112) |
| 0.3 | 1.0 | GO:1901703 | protein localization involved in auxin polar transport(GO:1901703) |
| 0.3 | 0.3 | GO:0030970 | retrograde protein transport, ER to cytosol(GO:0030970) endoplasmic reticulum to cytosol transport(GO:1903513) |
| 0.3 | 4.1 | GO:0006538 | glutamate catabolic process(GO:0006538) |
| 0.3 | 0.8 | GO:0019482 | uracil catabolic process(GO:0006212) beta-alanine metabolic process(GO:0019482) beta-alanine biosynthetic process(GO:0019483) |
| 0.3 | 1.0 | GO:0045948 | positive regulation of translational initiation(GO:0045948) |
| 0.3 | 0.8 | GO:2000758 | positive regulation of histone acetylation(GO:0035066) positive regulation of protein acetylation(GO:1901985) positive regulation of peptidyl-lysine acetylation(GO:2000758) |
| 0.3 | 1.5 | GO:0048439 | flower morphogenesis(GO:0048439) |
| 0.2 | 1.0 | GO:0042256 | mature ribosome assembly(GO:0042256) |
| 0.2 | 0.5 | GO:0000966 | RNA 5'-end processing(GO:0000966) |
| 0.2 | 6.2 | GO:0051260 | protein homooligomerization(GO:0051260) |
| 0.2 | 2.9 | GO:0006878 | cellular copper ion homeostasis(GO:0006878) |
| 0.2 | 1.2 | GO:0042218 | 1-aminocyclopropane-1-carboxylate biosynthetic process(GO:0042218) |
| 0.2 | 10.7 | GO:0048510 | regulation of timing of meristematic phase transition(GO:0048506) regulation of timing of transition from vegetative to reproductive phase(GO:0048510) |
| 0.2 | 6.5 | GO:2000030 | regulation of response to red or far red light(GO:2000030) |
| 0.2 | 1.0 | GO:0000188 | inactivation of MAPK activity(GO:0000188) |
| 0.2 | 0.9 | GO:0000455 | enzyme-directed rRNA pseudouridine synthesis(GO:0000455) |
| 0.2 | 0.9 | GO:0042178 | xenobiotic catabolic process(GO:0042178) |
| 0.2 | 0.7 | GO:0006432 | phenylalanyl-tRNA aminoacylation(GO:0006432) |
| 0.2 | 0.7 | GO:0043181 | vacuolar sequestering(GO:0043181) |
| 0.2 | 0.9 | GO:0061085 | regulation of histone H3-K27 methylation(GO:0061085) |
| 0.2 | 4.7 | GO:0009306 | protein secretion(GO:0009306) |
| 0.2 | 0.7 | GO:0044208 | 'de novo' AMP biosynthetic process(GO:0044208) |
| 0.2 | 3.2 | GO:0035999 | tetrahydrofolate interconversion(GO:0035999) |
| 0.2 | 0.7 | GO:0005513 | detection of calcium ion(GO:0005513) |
| 0.2 | 1.6 | GO:0009745 | sucrose mediated signaling(GO:0009745) |
| 0.2 | 1.1 | GO:0060148 | positive regulation of posttranscriptional gene silencing(GO:0060148) |
| 0.2 | 0.9 | GO:1902458 | positive regulation of stomatal opening(GO:1902458) |
| 0.2 | 0.7 | GO:0090549 | response to carbon starvation(GO:0090549) |
| 0.2 | 2.0 | GO:0006086 | acetyl-CoA biosynthetic process from pyruvate(GO:0006086) |
| 0.2 | 0.7 | GO:0030031 | cell projection organization(GO:0030030) cell projection assembly(GO:0030031) |
| 0.2 | 0.7 | GO:0015812 | gamma-aminobutyric acid transport(GO:0015812) |
| 0.2 | 1.3 | GO:2000037 | regulation of stomatal complex patterning(GO:2000037) |
| 0.2 | 0.9 | GO:0015697 | quaternary ammonium group transport(GO:0015697) |
| 0.2 | 3.5 | GO:0031425 | chloroplast RNA processing(GO:0031425) |
| 0.2 | 0.7 | GO:0009102 | biotin metabolic process(GO:0006768) biotin biosynthetic process(GO:0009102) |
| 0.2 | 0.7 | GO:0048281 | inflorescence morphogenesis(GO:0048281) |
| 0.2 | 1.1 | GO:0019323 | pentose catabolic process(GO:0019323) |
| 0.2 | 0.7 | GO:0034969 | histone arginine methylation(GO:0034969) |
| 0.2 | 0.7 | GO:2001294 | fatty-acyl-CoA catabolic process(GO:0036115) malonyl-CoA catabolic process(GO:2001294) |
| 0.2 | 5.5 | GO:0046834 | lipid phosphorylation(GO:0046834) phosphatidylinositol phosphorylation(GO:0046854) |
| 0.2 | 2.4 | GO:0048317 | seed morphogenesis(GO:0048317) |
| 0.2 | 1.1 | GO:0009647 | skotomorphogenesis(GO:0009647) |
| 0.2 | 0.7 | GO:0019365 | pyridine nucleotide salvage(GO:0019365) |
| 0.2 | 0.7 | GO:0006528 | asparagine metabolic process(GO:0006528) |
| 0.2 | 0.7 | GO:1900386 | positive regulation of flavonol biosynthetic process(GO:1900386) |
| 0.2 | 2.2 | GO:0000338 | protein deneddylation(GO:0000338) |
| 0.2 | 0.4 | GO:1900384 | regulation of flavonol biosynthetic process(GO:1900384) |
| 0.2 | 1.5 | GO:0070979 | protein K11-linked ubiquitination(GO:0070979) |
| 0.2 | 1.1 | GO:0000393 | spliceosomal conformational changes to generate catalytic conformation(GO:0000393) |
| 0.2 | 0.2 | GO:0051645 | Golgi localization(GO:0051645) |
| 0.2 | 0.8 | GO:0006729 | tetrahydrobiopterin biosynthetic process(GO:0006729) tetrahydrobiopterin metabolic process(GO:0046146) |
| 0.2 | 0.8 | GO:0016598 | protein arginylation(GO:0016598) |
| 0.2 | 2.5 | GO:0005978 | glycogen biosynthetic process(GO:0005978) |
| 0.2 | 0.6 | GO:0033258 | plastid DNA metabolic process(GO:0033258) plastid DNA replication(GO:0033259) |
| 0.2 | 0.6 | GO:0071763 | nuclear membrane organization(GO:0071763) |
| 0.2 | 1.4 | GO:0010067 | procambium histogenesis(GO:0010067) |
| 0.2 | 0.6 | GO:0010288 | response to lead ion(GO:0010288) |
| 0.2 | 2.6 | GO:0051555 | flavone biosynthetic process(GO:0051553) flavonol biosynthetic process(GO:0051555) |
| 0.2 | 1.2 | GO:0000379 | tRNA-type intron splice site recognition and cleavage(GO:0000379) |
| 0.2 | 0.8 | GO:0002164 | nematode larval development(GO:0002119) larval development(GO:0002164) regulation of nematode larval development(GO:0061062) |
| 0.2 | 2.2 | GO:0010050 | vegetative phase change(GO:0010050) |
| 0.2 | 1.0 | GO:0043462 | regulation of ATPase activity(GO:0043462) |
| 0.2 | 2.7 | GO:0006102 | isocitrate metabolic process(GO:0006102) |
| 0.2 | 1.4 | GO:0009446 | putrescine metabolic process(GO:0009445) putrescine biosynthetic process(GO:0009446) putrescine biosynthetic process from arginine(GO:0033388) |
| 0.2 | 1.2 | GO:0009772 | photosynthetic electron transport in photosystem II(GO:0009772) |
| 0.2 | 0.2 | GO:0000050 | urea cycle(GO:0000050) |
| 0.2 | 0.6 | GO:0010184 | cytokinin transport(GO:0010184) |
| 0.2 | 0.4 | GO:0070534 | protein K63-linked ubiquitination(GO:0070534) |
| 0.2 | 0.8 | GO:0001173 | DNA-templated transcriptional start site selection(GO:0001173) |
| 0.2 | 1.2 | GO:0009920 | cell plate formation involved in plant-type cell wall biogenesis(GO:0009920) |
| 0.2 | 1.9 | GO:0010951 | negative regulation of endopeptidase activity(GO:0010951) regulation of endopeptidase activity(GO:0052548) |
| 0.2 | 0.8 | GO:0071415 | cellular response to alkaloid(GO:0071312) cellular response to caffeine(GO:0071313) cellular response to purine-containing compound(GO:0071415) negative regulation of cellular response to caffeine(GO:1901181) |
| 0.2 | 0.8 | GO:0009557 | antipodal cell differentiation(GO:0009557) |
| 0.2 | 0.9 | GO:0010452 | histone H3-K36 methylation(GO:0010452) |
| 0.2 | 0.6 | GO:0010289 | homogalacturonan biosynthetic process(GO:0010289) |
| 0.2 | 1.7 | GO:0009942 | longitudinal axis specification(GO:0009942) |
| 0.2 | 0.7 | GO:0040034 | regulation of development, heterochronic(GO:0040034) |
| 0.2 | 8.1 | GO:0072596 | protein targeting to chloroplast(GO:0045036) establishment of protein localization to chloroplast(GO:0072596) |
| 0.2 | 2.9 | GO:0051123 | RNA polymerase II transcriptional preinitiation complex assembly(GO:0051123) |
| 0.2 | 1.8 | GO:0045040 | outer mitochondrial membrane organization(GO:0007008) protein import into mitochondrial outer membrane(GO:0045040) |
| 0.2 | 0.6 | GO:0060145 | viral gene silencing in virus induced gene silencing(GO:0060145) |
| 0.2 | 0.7 | GO:0097298 | regulation of nucleus size(GO:0097298) |
| 0.2 | 0.4 | GO:0010213 | non-photoreactive DNA repair(GO:0010213) |
| 0.2 | 1.5 | GO:0034724 | DNA replication-independent nucleosome organization(GO:0034724) |
| 0.2 | 1.8 | GO:0007231 | osmosensory signaling pathway(GO:0007231) |
| 0.2 | 1.1 | GO:0048209 | regulation of vesicle targeting, to, from or within Golgi(GO:0048209) |
| 0.2 | 0.5 | GO:0000479 | endonucleolytic cleavage of tricistronic rRNA transcript (SSU-rRNA, 5.8S rRNA, LSU-rRNA)(GO:0000479) |
| 0.2 | 0.9 | GO:1901002 | positive regulation of response to salt stress(GO:1901002) |
| 0.2 | 0.9 | GO:0009298 | GDP-mannose biosynthetic process(GO:0009298) |
| 0.2 | 0.9 | GO:0006103 | 2-oxoglutarate metabolic process(GO:0006103) |
| 0.2 | 0.7 | GO:0032988 | ribonucleoprotein complex disassembly(GO:0032988) |
| 0.2 | 5.0 | GO:0000028 | ribosomal small subunit assembly(GO:0000028) |
| 0.2 | 0.9 | GO:0000212 | meiotic spindle organization(GO:0000212) |
| 0.2 | 1.1 | GO:0034204 | lipid translocation(GO:0034204) |
| 0.2 | 1.6 | GO:0045815 | positive regulation of gene expression, epigenetic(GO:0045815) |
| 0.2 | 0.7 | GO:1905157 | positive regulation of photosynthesis(GO:1905157) |
| 0.2 | 1.2 | GO:0034508 | centromere complex assembly(GO:0034508) |
| 0.2 | 1.8 | GO:0010380 | regulation of chlorophyll biosynthetic process(GO:0010380) |
| 0.2 | 1.9 | GO:0043155 | photoinhibition(GO:0010205) negative regulation of photosynthesis, light reaction(GO:0043155) |
| 0.2 | 0.7 | GO:0009957 | epidermal cell fate specification(GO:0009957) |
| 0.2 | 4.1 | GO:0006614 | cotranslational protein targeting to membrane(GO:0006613) SRP-dependent cotranslational protein targeting to membrane(GO:0006614) |
| 0.2 | 1.9 | GO:1901141 | regulation of lignin biosynthetic process(GO:1901141) |
| 0.2 | 0.5 | GO:0031538 | negative regulation of anthocyanin metabolic process(GO:0031538) |
| 0.2 | 0.8 | GO:0010371 | regulation of gibberellin biosynthetic process(GO:0010371) |
| 0.2 | 5.4 | GO:0051667 | chloroplast relocation(GO:0009902) chloroplast localization(GO:0019750) plastid localization(GO:0051644) establishment of plastid localization(GO:0051667) |
| 0.2 | 2.0 | GO:0031365 | N-terminal protein amino acid modification(GO:0031365) |
| 0.2 | 8.3 | GO:0072665 | protein targeting to vacuole(GO:0006623) protein localization to vacuole(GO:0072665) establishment of protein localization to vacuole(GO:0072666) |
| 0.2 | 0.3 | GO:0072598 | protein localization to chloroplast(GO:0072598) |
| 0.2 | 0.5 | GO:0002100 | tRNA wobble adenosine to inosine editing(GO:0002100) |
| 0.2 | 1.0 | GO:0009800 | cinnamic acid biosynthetic process(GO:0009800) |
| 0.2 | 0.3 | GO:0031204 | posttranslational protein targeting to membrane, translocation(GO:0031204) |
| 0.2 | 1.6 | GO:0006749 | glutathione metabolic process(GO:0006749) |
| 0.2 | 0.5 | GO:0010447 | response to acidic pH(GO:0010447) |
| 0.2 | 0.6 | GO:0015959 | diadenosine polyphosphate metabolic process(GO:0015959) diadenosine tetraphosphate metabolic process(GO:0015965) |
| 0.2 | 2.9 | GO:0080156 | mitochondrial mRNA modification(GO:0080156) |
| 0.2 | 0.6 | GO:0043903 | regulation of symbiosis, encompassing mutualism through parasitism(GO:0043903) regulation of viral process(GO:0050792) |
| 0.2 | 0.6 | GO:0016320 | endoplasmic reticulum membrane fusion(GO:0016320) |
| 0.2 | 0.6 | GO:0009720 | detection of hormone stimulus(GO:0009720) detection of endogenous stimulus(GO:0009726) |
| 0.2 | 4.2 | GO:0010268 | brassinosteroid homeostasis(GO:0010268) |
| 0.2 | 1.1 | GO:0042793 | transcription from plastid promoter(GO:0042793) |
| 0.2 | 3.3 | GO:0008356 | asymmetric cell division(GO:0008356) |
| 0.2 | 3.1 | GO:0010167 | response to nitrate(GO:0010167) |
| 0.2 | 1.4 | GO:0010165 | response to X-ray(GO:0010165) |
| 0.2 | 0.2 | GO:0010065 | primary meristem tissue development(GO:0010065) |
| 0.2 | 0.5 | GO:0015786 | GDP-fucose transport(GO:0015783) UDP-glucose transport(GO:0015786) |
| 0.2 | 0.5 | GO:1990641 | response to iron ion starvation(GO:1990641) |
| 0.2 | 6.4 | GO:0006101 | tricarboxylic acid cycle(GO:0006099) citrate metabolic process(GO:0006101) |
| 0.2 | 0.6 | GO:0097054 | L-glutamate biosynthetic process(GO:0097054) |
| 0.2 | 0.8 | GO:0080121 | AMP transport(GO:0080121) |
| 0.1 | 0.6 | GO:0034367 | DNA-templated transcriptional open complex formation(GO:0001112) transcriptional open complex formation at RNA polymerase II promoter(GO:0001113) protein-DNA complex remodeling(GO:0001120) macromolecular complex remodeling(GO:0034367) |
| 0.1 | 1.5 | GO:0045116 | protein neddylation(GO:0045116) |
| 0.1 | 1.3 | GO:0006656 | phosphatidylcholine biosynthetic process(GO:0006656) |
| 0.1 | 0.4 | GO:0048873 | tissue homeostasis(GO:0001894) homeostasis of number of meristem cells(GO:0007639) homeostasis of number of cells(GO:0048872) homeostasis of number of cells within a tissue(GO:0048873) |
| 0.1 | 1.5 | GO:0046685 | response to arsenic-containing substance(GO:0046685) |
| 0.1 | 1.9 | GO:2000023 | regulation of lateral root development(GO:2000023) |
| 0.1 | 0.7 | GO:0000055 | ribosomal large subunit export from nucleus(GO:0000055) |
| 0.1 | 0.6 | GO:0019586 | uronic acid metabolic process(GO:0006063) galacturonate metabolic process(GO:0019586) |
| 0.1 | 2.0 | GO:0043248 | proteasome assembly(GO:0043248) |
| 0.1 | 0.6 | GO:0019474 | lysine catabolic process(GO:0006554) L-lysine catabolic process to acetyl-CoA(GO:0019474) L-lysine catabolic process(GO:0019477) L-lysine catabolic process to acetyl-CoA via saccharopine(GO:0033512) L-lysine metabolic process(GO:0046440) |
| 0.1 | 0.4 | GO:0043268 | positive regulation of potassium ion transport(GO:0043268) |
| 0.1 | 1.0 | GO:0006488 | dolichol-linked oligosaccharide biosynthetic process(GO:0006488) |
| 0.1 | 9.1 | GO:0016036 | cellular response to phosphate starvation(GO:0016036) |
| 0.1 | 0.8 | GO:0009303 | rRNA transcription(GO:0009303) |
| 0.1 | 0.6 | GO:0048530 | fruit morphogenesis(GO:0048530) |
| 0.1 | 2.5 | GO:0009585 | phototransduction(GO:0007602) red, far-red light phototransduction(GO:0009585) |
| 0.1 | 0.4 | GO:0009093 | cysteine catabolic process(GO:0009093) |
| 0.1 | 0.4 | GO:0051754 | meiotic sister chromatid cohesion, centromeric(GO:0051754) |
| 0.1 | 6.8 | GO:0009631 | cold acclimation(GO:0009631) |
| 0.1 | 0.8 | GO:0042391 | regulation of membrane potential(GO:0042391) |
| 0.1 | 0.8 | GO:0046473 | phosphatidic acid metabolic process(GO:0046473) |
| 0.1 | 0.4 | GO:0043157 | response to cation stress(GO:0043157) |
| 0.1 | 0.8 | GO:0043489 | RNA stabilization(GO:0043489) |
| 0.1 | 1.8 | GO:1901371 | regulation of leaf morphogenesis(GO:1901371) |
| 0.1 | 2.6 | GO:0055075 | potassium ion homeostasis(GO:0055075) |
| 0.1 | 4.3 | GO:0000027 | ribosomal large subunit assembly(GO:0000027) |
| 0.1 | 2.1 | GO:0010109 | regulation of photosynthesis(GO:0010109) |
| 0.1 | 0.4 | GO:0015800 | acidic amino acid transport(GO:0015800) |
| 0.1 | 0.8 | GO:0016926 | protein desumoylation(GO:0016926) |
| 0.1 | 0.7 | GO:0007142 | male meiosis II(GO:0007142) |
| 0.1 | 1.0 | GO:0031125 | rRNA 3'-end processing(GO:0031125) |
| 0.1 | 4.0 | GO:0043562 | cellular response to nitrogen levels(GO:0043562) |
| 0.1 | 0.8 | GO:0045851 | pH reduction(GO:0045851) |
| 0.1 | 0.6 | GO:0033591 | response to L-ascorbic acid(GO:0033591) |
| 0.1 | 0.1 | GO:0042040 | molybdenum incorporation into molybdenum-molybdopterin complex(GO:0018315) metal incorporation into metallo-molybdopterin complex(GO:0042040) |
| 0.1 | 0.1 | GO:0051101 | regulation of DNA binding(GO:0051101) |
| 0.1 | 2.5 | GO:0016117 | tetraterpenoid biosynthetic process(GO:0016109) carotenoid biosynthetic process(GO:0016117) |
| 0.1 | 0.4 | GO:0019343 | L-methionine biosynthetic process from L-homoserine via cystathionine(GO:0019279) cysteine biosynthetic process via cystathionine(GO:0019343) 'de novo' L-methionine biosynthetic process(GO:0071266) |
| 0.1 | 2.3 | GO:0000373 | Group II intron splicing(GO:0000373) |
| 0.1 | 0.4 | GO:0036265 | RNA (guanine-N7)-methylation(GO:0036265) rRNA (guanine-N7)-methylation(GO:0070476) |
| 0.1 | 0.5 | GO:0006651 | diacylglycerol biosynthetic process(GO:0006651) |
| 0.1 | 1.0 | GO:0016444 | somatic cell DNA recombination(GO:0016444) |
| 0.1 | 1.0 | GO:0042182 | lactate metabolic process(GO:0006089) methylglyoxal metabolic process(GO:0009438) methylglyoxal catabolic process to D-lactate via S-lactoyl-glutathione(GO:0019243) ketone catabolic process(GO:0042182) methylglyoxal catabolic process(GO:0051596) methylglyoxal catabolic process to lactate(GO:0061727) |
| 0.1 | 2.5 | GO:0008284 | positive regulation of cell proliferation(GO:0008284) |
| 0.1 | 1.7 | GO:0010332 | response to gamma radiation(GO:0010332) |
| 0.1 | 3.7 | GO:0006612 | protein targeting to membrane(GO:0006612) |
| 0.1 | 2.1 | GO:0006075 | (1->3)-beta-D-glucan metabolic process(GO:0006074) (1->3)-beta-D-glucan biosynthetic process(GO:0006075) |
| 0.1 | 0.5 | GO:0070734 | histone H3-K27 methylation(GO:0070734) |
| 0.1 | 2.7 | GO:0009934 | regulation of meristem structural organization(GO:0009934) |
| 0.1 | 0.4 | GO:0060919 | auxin influx(GO:0060919) |
| 0.1 | 1.3 | GO:1902074 | response to salt(GO:1902074) |
| 0.1 | 0.4 | GO:0048442 | sepal development(GO:0048442) flower calyx development(GO:0048464) |
| 0.1 | 3.4 | GO:0009767 | photosynthetic electron transport chain(GO:0009767) |
| 0.1 | 0.5 | GO:0051346 | negative regulation of hydrolase activity(GO:0051346) |
| 0.1 | 0.6 | GO:0043486 | histone exchange(GO:0043486) |
| 0.1 | 0.3 | GO:0070127 | seryl-tRNA aminoacylation(GO:0006434) tRNA aminoacylation for mitochondrial protein translation(GO:0070127) selenocysteinyl-tRNA(Sec) biosynthetic process(GO:0097056) |
| 0.1 | 0.5 | GO:0019048 | modulation by virus of host morphology or physiology(GO:0019048) |
| 0.1 | 0.3 | GO:0045739 | positive regulation of DNA repair(GO:0045739) |
| 0.1 | 0.3 | GO:0010677 | negative regulation of cellular carbohydrate metabolic process(GO:0010677) |
| 0.1 | 0.2 | GO:0018027 | peptidyl-lysine dimethylation(GO:0018027) |
| 0.1 | 0.8 | GO:0055070 | copper ion homeostasis(GO:0055070) |
| 0.1 | 0.4 | GO:0006428 | isoleucyl-tRNA aminoacylation(GO:0006428) |
| 0.1 | 0.4 | GO:0010508 | positive regulation of autophagy(GO:0010508) |
| 0.1 | 0.4 | GO:0051569 | regulation of histone H3-K4 methylation(GO:0051569) |
| 0.1 | 2.6 | GO:0080022 | primary root development(GO:0080022) |
| 0.1 | 0.4 | GO:1903321 | negative regulation of protein modification by small protein conjugation or removal(GO:1903321) |
| 0.1 | 0.6 | GO:0047484 | regulation of response to osmotic stress(GO:0047484) |
| 0.1 | 0.3 | GO:0071596 | ubiquitin-dependent protein catabolic process via the N-end rule pathway(GO:0071596) |
| 0.1 | 0.3 | GO:0042126 | nitrate metabolic process(GO:0042126) nitrate assimilation(GO:0042128) |
| 0.1 | 3.7 | GO:0006333 | chromatin assembly or disassembly(GO:0006333) |
| 0.1 | 2.4 | GO:0071472 | cellular response to salt stress(GO:0071472) |
| 0.1 | 1.6 | GO:0010039 | response to iron ion(GO:0010039) |
| 0.1 | 2.0 | GO:0051788 | response to misfolded protein(GO:0051788) cellular response to misfolded protein(GO:0071218) |
| 0.1 | 0.5 | GO:0006370 | 7-methylguanosine mRNA capping(GO:0006370) |
| 0.1 | 0.9 | GO:0006734 | NADH metabolic process(GO:0006734) |
| 0.1 | 0.5 | GO:0009635 | response to herbicide(GO:0009635) |
| 0.1 | 0.5 | GO:0006556 | S-adenosylmethionine biosynthetic process(GO:0006556) |
| 0.1 | 0.1 | GO:0048863 | stem cell differentiation(GO:0048863) regulation of stem cell population maintenance(GO:2000036) regulation of stem cell differentiation(GO:2000736) |
| 0.1 | 0.7 | GO:1900056 | negative regulation of leaf senescence(GO:1900056) |
| 0.1 | 1.1 | GO:0006002 | fructose 6-phosphate metabolic process(GO:0006002) |
| 0.1 | 4.1 | GO:0009788 | negative regulation of abscisic acid-activated signaling pathway(GO:0009788) |
| 0.1 | 0.4 | GO:0051189 | Mo-molybdopterin cofactor biosynthetic process(GO:0006777) Mo-molybdopterin cofactor metabolic process(GO:0019720) molybdopterin cofactor biosynthetic process(GO:0032324) molybdopterin cofactor metabolic process(GO:0043545) prosthetic group metabolic process(GO:0051189) |
| 0.1 | 1.1 | GO:0010192 | mucilage biosynthetic process(GO:0010192) |
| 0.1 | 0.4 | GO:0006409 | tRNA export from nucleus(GO:0006409) tRNA transport(GO:0051031) tRNA-containing ribonucleoprotein complex export from nucleus(GO:0071431) |
| 0.1 | 1.0 | GO:0010206 | photosystem II repair(GO:0010206) |
| 0.1 | 1.8 | GO:0010072 | primary shoot apical meristem specification(GO:0010072) |
| 0.1 | 1.0 | GO:0051443 | positive regulation of ubiquitin-protein transferase activity(GO:0051443) positive regulation of ubiquitin protein ligase activity(GO:1904668) |
| 0.1 | 1.0 | GO:0000460 | maturation of 5.8S rRNA(GO:0000460) |
| 0.1 | 0.8 | GO:0010233 | vascular transport(GO:0010232) phloem transport(GO:0010233) |
| 0.1 | 0.2 | GO:0000256 | allantoin catabolic process(GO:0000256) |
| 0.1 | 0.3 | GO:0009805 | coumarin biosynthetic process(GO:0009805) |
| 0.1 | 0.6 | GO:0070212 | protein ADP-ribosylation(GO:0006471) protein poly-ADP-ribosylation(GO:0070212) |
| 0.1 | 0.4 | GO:0006065 | aminoglycan biosynthetic process(GO:0006023) glycosaminoglycan biosynthetic process(GO:0006024) UDP-glucuronate biosynthetic process(GO:0006065) glycosaminoglycan metabolic process(GO:0030203) |
| 0.1 | 1.1 | GO:0016559 | peroxisome fission(GO:0016559) |
| 0.1 | 4.4 | GO:0002181 | cytoplasmic translation(GO:0002181) |
| 0.1 | 0.7 | GO:0009854 | oxidative photosynthetic carbon pathway(GO:0009854) |
| 0.1 | 0.6 | GO:2000779 | regulation of double-strand break repair(GO:2000779) |
| 0.1 | 0.3 | GO:0030100 | regulation of endocytosis(GO:0030100) |
| 0.1 | 0.9 | GO:0006596 | polyamine biosynthetic process(GO:0006596) |
| 0.1 | 1.2 | GO:0009704 | de-etiolation(GO:0009704) |
| 0.1 | 0.3 | GO:0006750 | glutathione biosynthetic process(GO:0006750) nonribosomal peptide biosynthetic process(GO:0019184) |
| 0.1 | 0.9 | GO:0090158 | endoplasmic reticulum membrane organization(GO:0090158) |
| 0.1 | 0.5 | GO:0051131 | chaperone-mediated protein complex assembly(GO:0051131) |
| 0.1 | 1.1 | GO:0010540 | basipetal auxin transport(GO:0010540) |
| 0.1 | 0.9 | GO:0048017 | phosphatidylinositol-mediated signaling(GO:0048015) inositol lipid-mediated signaling(GO:0048017) |
| 0.1 | 0.9 | GO:0006112 | glycogen metabolic process(GO:0005977) energy reserve metabolic process(GO:0006112) |
| 0.1 | 0.9 | GO:0009649 | entrainment of circadian clock(GO:0009649) |
| 0.1 | 2.9 | GO:0042594 | response to starvation(GO:0042594) |
| 0.1 | 0.7 | GO:0006526 | arginine biosynthetic process(GO:0006526) |
| 0.1 | 2.1 | GO:0000245 | spliceosomal complex assembly(GO:0000245) |
| 0.1 | 2.5 | GO:0030490 | maturation of SSU-rRNA(GO:0030490) |
| 0.1 | 1.8 | GO:0042744 | hydrogen peroxide catabolic process(GO:0042744) |
| 0.1 | 2.7 | GO:0010143 | cutin biosynthetic process(GO:0010143) |
| 0.1 | 1.7 | GO:0030042 | actin filament depolymerization(GO:0030042) |
| 0.1 | 0.5 | GO:0015857 | pyrimidine nucleobase transport(GO:0015855) uracil transport(GO:0015857) |
| 0.1 | 0.3 | GO:1904356 | regulation of telomere maintenance via telomerase(GO:0032210) regulation of telomere maintenance via telomere lengthening(GO:1904356) negative regulation of DNA biosynthetic process(GO:2000279) |
| 0.1 | 0.8 | GO:1902182 | shoot apical meristem development(GO:1902182) |
| 0.1 | 0.7 | GO:0006655 | phosphatidylglycerol biosynthetic process(GO:0006655) |
| 0.1 | 0.5 | GO:0031056 | regulation of histone modification(GO:0031056) |
| 0.1 | 0.4 | GO:0072599 | protein targeting to ER(GO:0045047) establishment of protein localization to endoplasmic reticulum(GO:0072599) |
| 0.1 | 0.4 | GO:0010155 | regulation of proton transport(GO:0010155) |
| 0.1 | 0.5 | GO:0002697 | regulation of immune effector process(GO:0002697) regulation of defense response to virus(GO:0050688) |
| 0.1 | 1.4 | GO:0032981 | mitochondrial respiratory chain complex I assembly(GO:0032981) mitochondrial respiratory chain complex I biogenesis(GO:0097031) |
| 0.1 | 0.8 | GO:0044003 | modification of morphology or physiology of other organism(GO:0035821) modification by symbiont of host morphology or physiology(GO:0044003) modification of morphology or physiology of other organism involved in symbiotic interaction(GO:0051817) |
| 0.1 | 0.4 | GO:0071715 | icosanoid secretion(GO:0032309) arachidonic acid secretion(GO:0050482) icosanoid transport(GO:0071715) fatty acid derivative transport(GO:1901571) arachidonate transport(GO:1903963) |
| 0.1 | 0.3 | GO:0010623 | programmed cell death involved in cell development(GO:0010623) |
| 0.1 | 0.7 | GO:1903830 | magnesium ion transmembrane transport(GO:1903830) |
| 0.1 | 0.3 | GO:1902914 | regulation of protein polyubiquitination(GO:1902914) positive regulation of protein polyubiquitination(GO:1902916) |
| 0.1 | 2.5 | GO:0006338 | chromatin remodeling(GO:0006338) |
| 0.1 | 0.4 | GO:0090116 | C-5 methylation of cytosine(GO:0090116) |
| 0.1 | 1.0 | GO:0009294 | genetic transfer(GO:0009292) DNA mediated transformation(GO:0009294) |
| 0.1 | 2.2 | GO:0010286 | heat acclimation(GO:0010286) |
| 0.1 | 1.3 | GO:0031167 | rRNA methylation(GO:0031167) |
| 0.1 | 0.5 | GO:0034308 | primary alcohol metabolic process(GO:0034308) |
| 0.1 | 0.2 | GO:1900032 | regulation of trichome patterning(GO:1900032) negative regulation of trichome patterning(GO:1900033) |
| 0.1 | 0.3 | GO:0015693 | magnesium ion transport(GO:0015693) |
| 0.1 | 0.9 | GO:0009051 | pentose-phosphate shunt, oxidative branch(GO:0009051) |
| 0.1 | 1.1 | GO:0042631 | cellular response to water deprivation(GO:0042631) cellular response to water stimulus(GO:0071462) |
| 0.1 | 0.6 | GO:0042177 | negative regulation of protein catabolic process(GO:0042177) |
| 0.1 | 0.5 | GO:0010375 | stomatal complex patterning(GO:0010375) |
| 0.1 | 0.1 | GO:0018279 | peptidyl-asparagine modification(GO:0018196) protein N-linked glycosylation via asparagine(GO:0018279) |
| 0.1 | 0.4 | GO:0000919 | cell plate assembly(GO:0000919) |
| 0.1 | 2.0 | GO:0042026 | protein refolding(GO:0042026) |
| 0.1 | 0.8 | GO:0006265 | DNA topological change(GO:0006265) |
| 0.1 | 0.7 | GO:0033108 | mitochondrial respiratory chain complex assembly(GO:0033108) |
| 0.1 | 0.7 | GO:0006515 | misfolded or incompletely synthesized protein catabolic process(GO:0006515) |
| 0.1 | 0.7 | GO:1990069 | stomatal opening(GO:1990069) |
| 0.1 | 0.3 | GO:0010821 | regulation of mitochondrion organization(GO:0010821) |
| 0.1 | 0.3 | GO:0001682 | tRNA 5'-leader removal(GO:0001682) |
| 0.1 | 0.2 | GO:0043171 | peptide catabolic process(GO:0043171) |
| 0.1 | 2.8 | GO:0090487 | toxin catabolic process(GO:0009407) secondary metabolite catabolic process(GO:0090487) |
| 0.1 | 7.5 | GO:0006457 | protein folding(GO:0006457) |
| 0.1 | 0.6 | GO:0010082 | regulation of root meristem growth(GO:0010082) |
| 0.1 | 1.7 | GO:0007030 | Golgi organization(GO:0007030) |
| 0.1 | 1.3 | GO:0009395 | phospholipid catabolic process(GO:0009395) |
| 0.1 | 0.7 | GO:0006662 | glycerol ether metabolic process(GO:0006662) |
| 0.1 | 1.6 | GO:0022904 | respiratory electron transport chain(GO:0022904) |
| 0.1 | 0.3 | GO:0015691 | cadmium ion transport(GO:0015691) |
| 0.1 | 0.5 | GO:0042776 | mitochondrial ATP synthesis coupled proton transport(GO:0042776) |
| 0.1 | 2.4 | GO:0009910 | negative regulation of flower development(GO:0009910) |
| 0.1 | 1.0 | GO:0015937 | coenzyme A biosynthetic process(GO:0015937) |
| 0.1 | 0.9 | GO:0010215 | cellulose microfibril organization(GO:0010215) |
| 0.1 | 0.6 | GO:0016131 | phytosteroid metabolic process(GO:0016128) brassinosteroid metabolic process(GO:0016131) |
| 0.1 | 0.1 | GO:0035308 | negative regulation of dephosphorylation(GO:0035305) negative regulation of protein dephosphorylation(GO:0035308) |
| 0.1 | 1.5 | GO:0006368 | transcription elongation from RNA polymerase II promoter(GO:0006368) |
| 0.1 | 0.5 | GO:0034311 | sphingosine metabolic process(GO:0006670) diol metabolic process(GO:0034311) diol biosynthetic process(GO:0034312) sphingosine biosynthetic process(GO:0046512) |
| 0.1 | 0.2 | GO:0043982 | histone H4-K8 acetylation(GO:0043982) |
| 0.1 | 0.6 | GO:0009088 | threonine biosynthetic process(GO:0009088) |
| 0.1 | 0.2 | GO:0043247 | protection from non-homologous end joining at telomere(GO:0031848) telomere maintenance in response to DNA damage(GO:0043247) |
| 0.1 | 0.1 | GO:0080175 | phragmoplast microtubule organization(GO:0080175) |
| 0.1 | 0.6 | GO:0001676 | long-chain fatty acid metabolic process(GO:0001676) |
| 0.1 | 3.0 | GO:0042176 | regulation of protein catabolic process(GO:0042176) |
| 0.1 | 0.1 | GO:0006501 | C-terminal protein lipidation(GO:0006501) C-terminal protein amino acid modification(GO:0018410) |
| 0.1 | 0.2 | GO:1900363 | regulation of mRNA polyadenylation(GO:1900363) |
| 0.1 | 2.5 | GO:0043038 | amino acid activation(GO:0043038) tRNA aminoacylation(GO:0043039) |
| 0.1 | 1.9 | GO:0042023 | DNA endoreduplication(GO:0042023) |
| 0.1 | 0.2 | GO:0006561 | proline biosynthetic process(GO:0006561) |
| 0.1 | 0.6 | GO:0010017 | red or far-red light signaling pathway(GO:0010017) cellular response to red or far red light(GO:0071489) |
| 0.1 | 0.5 | GO:0071248 | cellular response to metal ion(GO:0071248) |
| 0.1 | 0.2 | GO:0042304 | regulation of fatty acid biosynthetic process(GO:0042304) |
| 0.1 | 1.6 | GO:0051225 | spindle assembly(GO:0051225) |
| 0.1 | 0.9 | GO:0002238 | response to molecule of fungal origin(GO:0002238) |
| 0.1 | 0.4 | GO:0006828 | manganese ion transport(GO:0006828) |
| 0.1 | 0.4 | GO:0010088 | phloem development(GO:0010088) |
| 0.1 | 0.5 | GO:0010089 | xylem development(GO:0010089) |
| 0.1 | 0.2 | GO:0006678 | glycosylceramide metabolic process(GO:0006677) glucosylceramide metabolic process(GO:0006678) glucosylceramide catabolic process(GO:0006680) glycosphingolipid metabolic process(GO:0006687) glycolipid catabolic process(GO:0019377) glycosylceramide catabolic process(GO:0046477) glycosphingolipid catabolic process(GO:0046479) ceramide catabolic process(GO:0046514) |
| 0.1 | 1.4 | GO:0006367 | transcription initiation from RNA polymerase II promoter(GO:0006367) |
| 0.1 | 0.5 | GO:0017182 | peptidyl-diphthamide metabolic process(GO:0017182) peptidyl-diphthamide biosynthetic process from peptidyl-histidine(GO:0017183) peptidyl-histidine modification(GO:0018202) |
| 0.1 | 0.8 | GO:0006270 | DNA replication initiation(GO:0006270) |
| 0.1 | 0.4 | GO:0042274 | ribosomal small subunit biogenesis(GO:0042274) |
| 0.1 | 0.2 | GO:0046386 | deoxyribonucleoside triphosphate catabolic process(GO:0009204) deoxyribose phosphate catabolic process(GO:0046386) |
| 0.1 | 0.5 | GO:0006771 | riboflavin metabolic process(GO:0006771) riboflavin biosynthetic process(GO:0009231) |
| 0.1 | 0.5 | GO:0009089 | lysine biosynthetic process via diaminopimelate(GO:0009089) diaminopimelate metabolic process(GO:0046451) |
| 0.1 | 0.6 | GO:0016556 | mRNA modification(GO:0016556) |
| 0.1 | 1.0 | GO:0032543 | mitochondrial translation(GO:0032543) |
| 0.0 | 2.0 | GO:0016485 | protein processing(GO:0016485) |
| 0.0 | 0.5 | GO:1990937 | xylan acetylation(GO:1990937) |
| 0.0 | 0.3 | GO:0080190 | lateral growth(GO:0080190) |
| 0.0 | 0.1 | GO:0042325 | regulation of phosphorylation(GO:0042325) |
| 0.0 | 1.0 | GO:0030150 | protein import into mitochondrial matrix(GO:0030150) |
| 0.0 | 2.1 | GO:0006972 | hyperosmotic response(GO:0006972) |
| 0.0 | 3.4 | GO:0006364 | rRNA processing(GO:0006364) |
| 0.0 | 0.3 | GO:0009396 | folic acid-containing compound biosynthetic process(GO:0009396) |
| 0.0 | 1.4 | GO:0009833 | plant-type primary cell wall biogenesis(GO:0009833) |
| 0.0 | 0.5 | GO:0044030 | regulation of DNA methylation(GO:0044030) |
| 0.0 | 0.5 | GO:0006904 | vesicle docking involved in exocytosis(GO:0006904) |
| 0.0 | 0.8 | GO:0006636 | unsaturated fatty acid biosynthetic process(GO:0006636) |
| 0.0 | 3.3 | GO:0016579 | protein deubiquitination(GO:0016579) |
| 0.0 | 1.8 | GO:0010119 | regulation of stomatal movement(GO:0010119) |
| 0.0 | 3.0 | GO:0010941 | regulation of cell death(GO:0010941) |
| 0.0 | 5.9 | GO:0009451 | RNA modification(GO:0009451) |
| 0.0 | 1.1 | GO:0010197 | karyogamy(GO:0000741) polar nucleus fusion(GO:0010197) |
| 0.0 | 0.2 | GO:0006228 | UTP biosynthetic process(GO:0006228) UTP metabolic process(GO:0046051) |
| 0.0 | 0.2 | GO:0071588 | hydrogen peroxide mediated signaling pathway(GO:0071588) |
| 0.0 | 0.7 | GO:0000387 | spliceosomal snRNP assembly(GO:0000387) |
| 0.0 | 0.3 | GO:0010262 | somatic embryogenesis(GO:0010262) |
| 0.0 | 2.4 | GO:0007005 | mitochondrion organization(GO:0007005) |
| 0.0 | 0.5 | GO:0010218 | response to far red light(GO:0010218) |
| 0.0 | 0.2 | GO:0000184 | nuclear-transcribed mRNA catabolic process, nonsense-mediated decay(GO:0000184) |
| 0.0 | 2.0 | GO:0007018 | microtubule-based movement(GO:0007018) |
| 0.0 | 2.7 | GO:0015979 | photosynthesis(GO:0015979) |
| 0.0 | 0.1 | GO:0090332 | stomatal closure(GO:0090332) |
| 0.0 | 0.6 | GO:0006863 | purine nucleobase transport(GO:0006863) |
| 0.0 | 0.3 | GO:0036065 | fucosylation(GO:0036065) |
| 0.0 | 1.4 | GO:0000209 | protein polyubiquitination(GO:0000209) |
| 0.0 | 1.3 | GO:0006897 | endocytosis(GO:0006897) |
| 0.0 | 0.1 | GO:0008615 | pyridoxine biosynthetic process(GO:0008615) |
| 0.0 | 0.8 | GO:0046219 | tryptophan biosynthetic process(GO:0000162) indolalkylamine biosynthetic process(GO:0046219) |
| 0.0 | 0.9 | GO:0010499 | proteasomal ubiquitin-independent protein catabolic process(GO:0010499) |
| 0.0 | 1.2 | GO:0009637 | response to blue light(GO:0009637) |
| 0.0 | 0.5 | GO:0052546 | cell wall pectin metabolic process(GO:0052546) |
| 0.0 | 0.1 | GO:0010062 | negative regulation of cell fate specification(GO:0009996) negative regulation of trichoblast fate specification(GO:0010062) negative regulation of cell fate commitment(GO:0010454) negative regulation of plant epidermal cell differentiation(GO:1903889) |
| 0.0 | 9.9 | GO:0043043 | peptide biosynthetic process(GO:0043043) |
| 0.0 | 0.8 | GO:0042127 | regulation of cell proliferation(GO:0042127) |
| 0.0 | 0.2 | GO:0032973 | amino acid export(GO:0032973) |
| 0.0 | 0.4 | GO:0006535 | cysteine biosynthetic process from serine(GO:0006535) |
| 0.0 | 0.6 | GO:0042752 | regulation of circadian rhythm(GO:0042752) |
| 0.0 | 0.4 | GO:0010030 | positive regulation of seed germination(GO:0010030) |
| 0.0 | 1.0 | GO:0015995 | chlorophyll biosynthetic process(GO:0015995) |
| 0.0 | 0.1 | GO:0032922 | circadian regulation of gene expression(GO:0032922) |
| 0.0 | 0.1 | GO:0046459 | short-chain fatty acid metabolic process(GO:0046459) |
| 0.0 | 0.3 | GO:0070973 | protein localization to endoplasmic reticulum exit site(GO:0070973) |
| 0.0 | 0.3 | GO:0006891 | intra-Golgi vesicle-mediated transport(GO:0006891) |
| 0.0 | 0.3 | GO:0015986 | ATP biosynthetic process(GO:0006754) energy coupled proton transport, down electrochemical gradient(GO:0015985) ATP synthesis coupled proton transport(GO:0015986) |
| 0.0 | 0.0 | GO:0055122 | response to very low light intensity stimulus(GO:0055122) |
| 0.0 | 0.4 | GO:0007064 | mitotic sister chromatid cohesion(GO:0007064) |
| 0.0 | 0.8 | GO:0009817 | defense response to fungus, incompatible interaction(GO:0009817) |
| 0.0 | 0.4 | GO:0016226 | iron-sulfur cluster assembly(GO:0016226) metallo-sulfur cluster assembly(GO:0031163) |
| 0.0 | 1.1 | GO:0006081 | cellular aldehyde metabolic process(GO:0006081) |
| 0.0 | 0.6 | GO:2000652 | regulation of secondary cell wall biogenesis(GO:2000652) |
| 0.0 | 1.0 | GO:0006090 | pyruvate metabolic process(GO:0006090) |
| 0.0 | 0.8 | GO:0090305 | nucleic acid phosphodiester bond hydrolysis(GO:0090305) |
| 0.0 | 1.5 | GO:0009658 | chloroplast organization(GO:0009658) |
| 0.0 | 0.1 | GO:1900457 | regulation of brassinosteroid mediated signaling pathway(GO:1900457) |
| 0.0 | 0.1 | GO:0000023 | maltose metabolic process(GO:0000023) |
| 0.0 | 0.4 | GO:0034968 | histone lysine methylation(GO:0034968) |
| 0.0 | 0.5 | GO:0006383 | transcription from RNA polymerase III promoter(GO:0006383) |
| 0.0 | 0.0 | GO:0009855 | determination of bilateral symmetry(GO:0009855) |
| 0.0 | 0.6 | GO:0006305 | DNA alkylation(GO:0006305) DNA methylation(GO:0006306) |
| 0.0 | 0.1 | GO:2000067 | regulation of root morphogenesis(GO:2000067) |
| 0.0 | 0.1 | GO:0044000 | movement in host(GO:0044000) transport of virus in multicellular host(GO:0046739) transport of virus(GO:0046794) movement in other organism involved in symbiotic interaction(GO:0051814) movement in host environment(GO:0052126) movement in environment of other organism involved in symbiotic interaction(GO:0052192) |
| 0.0 | 0.1 | GO:0015936 | coenzyme A metabolic process(GO:0015936) |
| 0.0 | 0.1 | GO:0006517 | protein deglycosylation(GO:0006517) |
| 0.0 | 0.0 | GO:0006747 | FAD biosynthetic process(GO:0006747) FAD metabolic process(GO:0046443) flavin adenine dinucleotide biosynthetic process(GO:0072388) |
| 0.0 | 0.3 | GO:0018394 | internal protein amino acid acetylation(GO:0006475) histone acetylation(GO:0016573) internal peptidyl-lysine acetylation(GO:0018393) peptidyl-lysine acetylation(GO:0018394) |
| 0.0 | 0.1 | GO:0009831 | plant-type cell wall modification involved in multidimensional cell growth(GO:0009831) |
| 0.0 | 0.7 | GO:0045454 | cell redox homeostasis(GO:0045454) |
| 0.0 | 0.2 | GO:0010077 | maintenance of inflorescence meristem identity(GO:0010077) |
| 0.0 | 1.1 | GO:0007017 | microtubule-based process(GO:0007017) |
| 0.0 | 0.1 | GO:0007130 | synaptonemal complex assembly(GO:0007130) synaptonemal complex organization(GO:0070193) |
| 0.0 | 0.1 | GO:0006552 | leucine catabolic process(GO:0006552) |
| 0.0 | 2.5 | GO:0046777 | protein autophosphorylation(GO:0046777) |
| 0.0 | 0.5 | GO:0010090 | trichome morphogenesis(GO:0010090) |
| 0.0 | 11.1 | GO:0006468 | protein phosphorylation(GO:0006468) |
| 0.0 | 0.1 | GO:0010449 | root meristem growth(GO:0010449) |
| 0.0 | 0.3 | GO:0009749 | response to glucose(GO:0009749) |
| 0.0 | 0.0 | GO:0010189 | vitamin E biosynthetic process(GO:0010189) vitamin E metabolic process(GO:0042360) |
| 0.0 | 0.1 | GO:0032784 | regulation of DNA-templated transcription, elongation(GO:0032784) |
| 0.0 | 0.2 | GO:0009789 | positive regulation of abscisic acid-activated signaling pathway(GO:0009789) |
| 0.0 | 0.1 | GO:0010497 | plasmodesmata-mediated intercellular transport(GO:0010497) |
| 0.0 | 0.0 | GO:0090056 | positive regulation of cofactor metabolic process(GO:0051194) regulation of chlorophyll metabolic process(GO:0090056) regulation of tetrapyrrole metabolic process(GO:1901401) positive regulation of tetrapyrrole metabolic process(GO:1901403) |
| 0.0 | 0.3 | GO:0009853 | photorespiration(GO:0009853) |
| 0.0 | 0.1 | GO:0046247 | carotene catabolic process(GO:0016121) terpene catabolic process(GO:0046247) |
| 0.0 | 0.6 | GO:0009411 | response to UV(GO:0009411) |
| 0.0 | 0.1 | GO:0070413 | trehalose metabolism in response to stress(GO:0070413) |
| 0.0 | 0.4 | GO:0000381 | regulation of alternative mRNA splicing, via spliceosome(GO:0000381) |
| 0.0 | 0.1 | GO:0015824 | proline transport(GO:0015824) |
| 0.0 | 0.1 | GO:0006730 | one-carbon metabolic process(GO:0006730) |
Gene overrepresentation in cellular component category:
| Log-likelihood per target | Total log-likelihood | Term | Description |
|---|---|---|---|
| 0.8 | 2.3 | GO:0005785 | signal recognition particle receptor complex(GO:0005785) |
| 0.6 | 1.8 | GO:0016328 | lateral plasma membrane(GO:0016328) |
| 0.5 | 1.0 | GO:0042788 | polysomal ribosome(GO:0042788) |
| 0.5 | 2.0 | GO:0005967 | mitochondrial pyruvate dehydrogenase complex(GO:0005967) |
| 0.5 | 1.0 | GO:0045254 | pyruvate dehydrogenase complex(GO:0045254) |
| 0.5 | 2.4 | GO:0030286 | dynein complex(GO:0030286) |
| 0.4 | 3.0 | GO:0005854 | nascent polypeptide-associated complex(GO:0005854) |
| 0.4 | 1.3 | GO:0042709 | succinate-CoA ligase complex(GO:0042709) |
| 0.4 | 6.4 | GO:0048471 | perinuclear region of cytoplasm(GO:0048471) |
| 0.4 | 1.2 | GO:0035101 | FACT complex(GO:0035101) |
| 0.4 | 4.1 | GO:0000427 | plastid-encoded plastid RNA polymerase complex(GO:0000427) |
| 0.3 | 0.7 | GO:0005850 | eukaryotic translation initiation factor 2 complex(GO:0005850) |
| 0.3 | 3.7 | GO:0005832 | chaperonin-containing T-complex(GO:0005832) |
| 0.3 | 5.1 | GO:0010598 | NAD(P)H dehydrogenase complex (plastoquinone)(GO:0010598) |
| 0.3 | 3.0 | GO:0017119 | Golgi transport complex(GO:0017119) |
| 0.3 | 1.5 | GO:0034515 | proteasome storage granule(GO:0034515) |
| 0.3 | 1.2 | GO:0009330 | DNA topoisomerase complex (ATP-hydrolyzing)(GO:0009330) |
| 0.3 | 0.9 | GO:1990112 | RQC complex(GO:1990112) |
| 0.3 | 0.8 | GO:0043186 | P granule(GO:0043186) pole plasm(GO:0045495) germ plasm(GO:0060293) |
| 0.3 | 2.7 | GO:0031209 | SCAR complex(GO:0031209) |
| 0.3 | 1.1 | GO:0008278 | cohesin complex(GO:0008278) |
| 0.3 | 15.3 | GO:0009707 | chloroplast outer membrane(GO:0009707) |
| 0.3 | 1.5 | GO:0000311 | plastid large ribosomal subunit(GO:0000311) |
| 0.3 | 2.3 | GO:0000275 | mitochondrial proton-transporting ATP synthase complex, catalytic core F(1)(GO:0000275) |
| 0.3 | 2.3 | GO:0009368 | endopeptidase Clp complex(GO:0009368) |
| 0.2 | 1.5 | GO:0000796 | condensin complex(GO:0000796) |
| 0.2 | 1.7 | GO:0033180 | proton-transporting V-type ATPase, V1 domain(GO:0033180) |
| 0.2 | 1.0 | GO:0005672 | transcription factor TFIIA complex(GO:0005672) |
| 0.2 | 3.5 | GO:0000229 | cytoplasmic chromosome(GO:0000229) |
| 0.2 | 0.7 | GO:0030684 | preribosome(GO:0030684) |
| 0.2 | 0.9 | GO:0009509 | chromoplast(GO:0009509) |
| 0.2 | 1.7 | GO:0005677 | chromatin silencing complex(GO:0005677) |
| 0.2 | 1.3 | GO:0044545 | NSL complex(GO:0044545) |
| 0.2 | 1.2 | GO:0009360 | DNA polymerase III complex(GO:0009360) |
| 0.2 | 2.0 | GO:0071014 | post-mRNA release spliceosomal complex(GO:0071014) |
| 0.2 | 0.6 | GO:0033281 | TAT protein transport complex(GO:0033281) |
| 0.2 | 1.2 | GO:0000214 | tRNA-intron endonuclease complex(GO:0000214) |
| 0.2 | 3.9 | GO:0035097 | histone methyltransferase complex(GO:0035097) |
| 0.2 | 1.7 | GO:0016471 | vacuolar proton-transporting V-type ATPase complex(GO:0016471) |
| 0.2 | 0.8 | GO:0000312 | plastid small ribosomal subunit(GO:0000312) |
| 0.2 | 1.0 | GO:0033597 | mitotic checkpoint complex(GO:0033597) |
| 0.2 | 3.3 | GO:0008023 | transcription elongation factor complex(GO:0008023) |
| 0.2 | 3.3 | GO:0016602 | CCAAT-binding factor complex(GO:0016602) |
| 0.2 | 8.1 | GO:0009543 | chloroplast thylakoid lumen(GO:0009543) plastid thylakoid lumen(GO:0031978) |
| 0.2 | 1.0 | GO:0034388 | Pwp2p-containing subcomplex of 90S preribosome(GO:0034388) |
| 0.2 | 0.5 | GO:0005658 | alpha DNA polymerase:primase complex(GO:0005658) |
| 0.2 | 0.7 | GO:0034663 | endoplasmic reticulum chaperone complex(GO:0034663) |
| 0.2 | 4.0 | GO:0005871 | kinesin complex(GO:0005871) |
| 0.2 | 0.3 | GO:0055037 | recycling endosome(GO:0055037) |
| 0.2 | 1.6 | GO:0042555 | MCM complex(GO:0042555) |
| 0.2 | 1.4 | GO:0045252 | oxoglutarate dehydrogenase complex(GO:0045252) |
| 0.2 | 1.6 | GO:0035861 | site of double-strand break(GO:0035861) |
| 0.2 | 1.1 | GO:0000778 | condensed nuclear chromosome kinetochore(GO:0000778) |
| 0.2 | 3.3 | GO:0009574 | preprophase band(GO:0009574) |
| 0.2 | 0.5 | GO:0032299 | ribonuclease H2 complex(GO:0032299) |
| 0.1 | 0.4 | GO:0034457 | Mpp10 complex(GO:0034457) |
| 0.1 | 6.4 | GO:0016592 | mediator complex(GO:0016592) |
| 0.1 | 0.7 | GO:0005782 | peroxisomal matrix(GO:0005782) microbody lumen(GO:0031907) |
| 0.1 | 0.9 | GO:0035145 | exon-exon junction complex(GO:0035145) |
| 0.1 | 2.8 | GO:0000148 | 1,3-beta-D-glucan synthase complex(GO:0000148) |
| 0.1 | 1.4 | GO:0010168 | ER body(GO:0010168) |
| 0.1 | 2.5 | GO:0031965 | nuclear membrane(GO:0031965) |
| 0.1 | 1.4 | GO:0000776 | kinetochore(GO:0000776) |
| 0.1 | 5.2 | GO:0000137 | Golgi cis cisterna(GO:0000137) |
| 0.1 | 7.9 | GO:0005797 | Golgi medial cisterna(GO:0005797) |
| 0.1 | 1.0 | GO:0042406 | extrinsic component of endoplasmic reticulum membrane(GO:0042406) |
| 0.1 | 1.7 | GO:0008180 | COP9 signalosome(GO:0008180) |
| 0.1 | 1.4 | GO:0070461 | SAGA-type complex(GO:0070461) |
| 0.1 | 0.5 | GO:0000811 | GINS complex(GO:0000811) |
| 0.1 | 1.3 | GO:0016272 | prefoldin complex(GO:0016272) |
| 0.1 | 17.7 | GO:0000790 | nuclear chromatin(GO:0000790) |
| 0.1 | 0.4 | GO:0005674 | transcription factor TFIIF complex(GO:0005674) |
| 0.1 | 0.7 | GO:0071541 | eukaryotic translation initiation factor 3 complex, eIF3m(GO:0071541) |
| 0.1 | 0.8 | GO:0009533 | chloroplast stromal thylakoid(GO:0009533) |
| 0.1 | 1.6 | GO:0030140 | trans-Golgi network transport vesicle(GO:0030140) |
| 0.1 | 13.3 | GO:0022627 | cytosolic small ribosomal subunit(GO:0022627) |
| 0.1 | 1.0 | GO:0070531 | BRCA1-A complex(GO:0070531) |
| 0.1 | 0.5 | GO:0000153 | cytoplasmic ubiquitin ligase complex(GO:0000153) |
| 0.1 | 25.4 | GO:0022626 | cytosolic ribosome(GO:0022626) |
| 0.1 | 1.2 | GO:0030686 | 90S preribosome(GO:0030686) |
| 0.1 | 0.8 | GO:0005664 | origin recognition complex(GO:0000808) nuclear origin of replication recognition complex(GO:0005664) |
| 0.1 | 0.9 | GO:0005956 | protein kinase CK2 complex(GO:0005956) |
| 0.1 | 0.8 | GO:0031428 | box C/D snoRNP complex(GO:0031428) |
| 0.1 | 1.6 | GO:0048500 | signal recognition particle(GO:0048500) |
| 0.1 | 1.4 | GO:0045283 | mitochondrial respiratory chain complex II, succinate dehydrogenase complex (ubiquinone)(GO:0005749) succinate dehydrogenase complex (ubiquinone)(GO:0045257) fumarate reductase complex(GO:0045283) |
| 0.1 | 0.9 | GO:0005697 | telomerase holoenzyme complex(GO:0005697) |
| 0.1 | 0.4 | GO:0032807 | DNA ligase IV complex(GO:0032807) |
| 0.1 | 0.4 | GO:0043076 | megasporocyte nucleus(GO:0043076) polar nucleus(GO:0043078) |
| 0.1 | 1.2 | GO:0030131 | clathrin adaptor complex(GO:0030131) |
| 0.1 | 1.2 | GO:0008540 | proteasome regulatory particle, base subcomplex(GO:0008540) |
| 0.1 | 0.7 | GO:0005753 | mitochondrial proton-transporting ATP synthase complex(GO:0005753) |
| 0.1 | 0.7 | GO:0030897 | HOPS complex(GO:0030897) |
| 0.1 | 10.0 | GO:0005667 | transcription factor complex(GO:0005667) |
| 0.1 | 0.6 | GO:0031205 | endoplasmic reticulum Sec complex(GO:0031205) |
| 0.1 | 0.5 | GO:0005845 | mRNA cap binding complex(GO:0005845) |
| 0.1 | 0.4 | GO:0031298 | replication fork protection complex(GO:0031298) |
| 0.1 | 0.6 | GO:0044815 | DNA packaging complex(GO:0044815) |
| 0.1 | 0.9 | GO:0019773 | proteasome core complex, alpha-subunit complex(GO:0019773) |
| 0.1 | 0.6 | GO:0017053 | transcriptional repressor complex(GO:0017053) |
| 0.1 | 5.2 | GO:0005635 | nuclear envelope(GO:0005635) |
| 0.1 | 0.7 | GO:0031371 | ubiquitin conjugating enzyme complex(GO:0031371) UBC13-MMS2 complex(GO:0031372) |
| 0.1 | 3.3 | GO:0009504 | cell plate(GO:0009504) |
| 0.1 | 2.4 | GO:0010494 | cytoplasmic stress granule(GO:0010494) |
| 0.1 | 8.6 | GO:0016604 | nuclear body(GO:0016604) |
| 0.1 | 1.2 | GO:0045298 | tubulin complex(GO:0045298) |
| 0.1 | 0.9 | GO:1902554 | serine/threonine protein kinase complex(GO:1902554) |
| 0.1 | 1.7 | GO:0005852 | eukaryotic translation initiation factor 3 complex(GO:0005852) |
| 0.1 | 0.2 | GO:0030904 | retromer complex(GO:0030904) |
| 0.1 | 2.2 | GO:0055028 | cortical microtubule(GO:0055028) |
| 0.1 | 1.0 | GO:0048226 | Casparian strip(GO:0048226) |
| 0.1 | 1.2 | GO:0005819 | spindle(GO:0005819) |
| 0.1 | 1.0 | GO:0005742 | mitochondrial outer membrane translocase complex(GO:0005742) |
| 0.1 | 1.2 | GO:0034399 | nuclear periphery(GO:0034399) |
| 0.1 | 1.2 | GO:0000784 | chromosome, telomeric region(GO:0000781) nuclear chromosome, telomeric region(GO:0000784) |
| 0.1 | 0.4 | GO:0071007 | U2-type catalytic step 2 spliceosome(GO:0071007) |
| 0.1 | 0.5 | GO:0033588 | Elongator holoenzyme complex(GO:0033588) |
| 0.1 | 2.0 | GO:0005875 | microtubule associated complex(GO:0005875) |
| 0.1 | 1.7 | GO:0005680 | anaphase-promoting complex(GO:0005680) |
| 0.1 | 0.8 | GO:0072546 | ER membrane protein complex(GO:0072546) |
| 0.1 | 1.2 | GO:0019897 | extrinsic component of plasma membrane(GO:0019897) |
| 0.1 | 0.4 | GO:0016281 | eukaryotic translation initiation factor 4F complex(GO:0016281) |
| 0.1 | 0.9 | GO:0015935 | small ribosomal subunit(GO:0015935) |
| 0.1 | 1.2 | GO:0022624 | proteasome regulatory particle(GO:0005838) proteasome accessory complex(GO:0022624) |
| 0.1 | 2.7 | GO:0005764 | lysosome(GO:0005764) |
| 0.1 | 1.9 | GO:0009524 | phragmoplast(GO:0009524) |
| 0.1 | 7.7 | GO:0080008 | Cul4-RING E3 ubiquitin ligase complex(GO:0080008) |
| 0.1 | 15.8 | GO:0009579 | thylakoid(GO:0009579) |
| 0.1 | 0.7 | GO:0005682 | U5 snRNP(GO:0005682) |
| 0.1 | 1.1 | GO:0032040 | small-subunit processome(GO:0032040) |
| 0.1 | 1.1 | GO:0016459 | myosin complex(GO:0016459) |
| 0.1 | 3.7 | GO:0005770 | late endosome(GO:0005770) |
| 0.1 | 0.2 | GO:0016323 | basal plasma membrane(GO:0009925) basolateral plasma membrane(GO:0016323) basal part of cell(GO:0045178) |
| 0.1 | 2.4 | GO:0010319 | stromule(GO:0010319) |
| 0.1 | 0.3 | GO:0034657 | GID complex(GO:0034657) |
| 0.1 | 0.2 | GO:0031417 | N-terminal protein acetyltransferase complex(GO:0031414) NatC complex(GO:0031417) |
| 0.1 | 0.4 | GO:0005787 | signal peptidase complex(GO:0005787) |
| 0.1 | 0.3 | GO:0035619 | root hair tip(GO:0035619) |
| 0.1 | 0.4 | GO:0035267 | NuA4 histone acetyltransferase complex(GO:0035267) H4/H2A histone acetyltransferase complex(GO:0043189) H4 histone acetyltransferase complex(GO:1902562) |
| 0.1 | 0.4 | GO:0030688 | preribosome, small subunit precursor(GO:0030688) |
| 0.1 | 1.6 | GO:0016591 | DNA-directed RNA polymerase II, holoenzyme(GO:0016591) |
| 0.1 | 0.8 | GO:0019898 | extrinsic component of membrane(GO:0019898) |
| 0.1 | 13.7 | GO:0005730 | nucleolus(GO:0005730) |
| 0.1 | 0.3 | GO:0030127 | COPII vesicle coat(GO:0030127) |
| 0.1 | 1.0 | GO:0005744 | mitochondrial inner membrane presequence translocase complex(GO:0005744) |
| 0.1 | 1.3 | GO:0030117 | membrane coat(GO:0030117) coated membrane(GO:0048475) |
| 0.1 | 31.7 | GO:0009532 | plastid stroma(GO:0009532) |
| 0.1 | 0.3 | GO:0030141 | secretory granule(GO:0030141) |
| 0.1 | 1.2 | GO:0031307 | intrinsic component of mitochondrial outer membrane(GO:0031306) integral component of mitochondrial outer membrane(GO:0031307) |
| 0.1 | 11.2 | GO:0005802 | trans-Golgi network(GO:0005802) |
| 0.1 | 1.8 | GO:0000145 | exocyst(GO:0000145) |
| 0.1 | 2.2 | GO:0005795 | Golgi stack(GO:0005795) |
| 0.0 | 0.3 | GO:0031379 | RNA-directed RNA polymerase complex(GO:0031379) nuclear RNA-directed RNA polymerase complex(GO:0031380) |
| 0.0 | 113.5 | GO:0005829 | cytosol(GO:0005829) |
| 0.0 | 0.1 | GO:0005769 | early endosome(GO:0005769) |
| 0.0 | 1.8 | GO:0045271 | mitochondrial respiratory chain complex I(GO:0005747) NADH dehydrogenase complex(GO:0030964) respiratory chain complex I(GO:0045271) |
| 0.0 | 0.2 | GO:0005662 | DNA replication factor A complex(GO:0005662) |
| 0.0 | 7.0 | GO:0042579 | peroxisome(GO:0005777) microbody(GO:0042579) |
| 0.0 | 0.1 | GO:0034045 | pre-autophagosomal structure membrane(GO:0034045) Atg12-Atg5-Atg16 complex(GO:0034274) |
| 0.0 | 0.2 | GO:0005847 | mRNA cleavage and polyadenylation specificity factor complex(GO:0005847) |
| 0.0 | 0.8 | GO:0030134 | ER to Golgi transport vesicle(GO:0030134) |
| 0.0 | 0.1 | GO:0043240 | Fanconi anaemia nuclear complex(GO:0043240) |
| 0.0 | 0.6 | GO:0005666 | DNA-directed RNA polymerase III complex(GO:0005666) |
| 0.0 | 0.2 | GO:0000164 | protein phosphatase type 1 complex(GO:0000164) |
| 0.0 | 1.2 | GO:0010008 | endosome membrane(GO:0010008) |
| 0.0 | 0.1 | GO:0097196 | Shu complex(GO:0097196) |
| 0.0 | 0.2 | GO:0030915 | Smc5-Smc6 complex(GO:0030915) |
| 0.0 | 90.0 | GO:0009536 | plastid(GO:0009536) |
| 0.0 | 2.9 | GO:0000151 | ubiquitin ligase complex(GO:0000151) |
| 0.0 | 0.2 | GO:0031201 | SNARE complex(GO:0031201) |
| 0.0 | 0.5 | GO:0015630 | microtubule cytoskeleton(GO:0015630) |
| 0.0 | 1.0 | GO:0044217 | host(GO:0018995) host cell part(GO:0033643) host intracellular part(GO:0033646) host intracellular organelle(GO:0033647) host intracellular membrane-bounded organelle(GO:0033648) host cell nucleus(GO:0042025) intracellular region of host(GO:0043656) host cell(GO:0043657) other organism(GO:0044215) other organism cell(GO:0044216) other organism part(GO:0044217) |
| 0.0 | 26.4 | GO:0005886 | plasma membrane(GO:0005886) |
| 0.0 | 0.1 | GO:0000445 | transcription export complex(GO:0000346) THO complex part of transcription export complex(GO:0000445) |
Gene overrepresentation in molecular function category:
| Log-likelihood per target | Total log-likelihood | Term | Description |
|---|---|---|---|
| 2.1 | 8.4 | GO:0004349 | glutamate 5-kinase activity(GO:0004349) glutamate-5-semialdehyde dehydrogenase activity(GO:0004350) |
| 1.1 | 4.5 | GO:0030410 | nicotianamine synthase activity(GO:0030410) |
| 0.9 | 4.7 | GO:0031957 | very long-chain fatty acid-CoA ligase activity(GO:0031957) |
| 0.9 | 2.8 | GO:0004071 | aspartate-ammonia ligase activity(GO:0004071) |
| 0.9 | 2.7 | GO:0046422 | violaxanthin de-epoxidase activity(GO:0046422) |
| 0.8 | 4.8 | GO:0004121 | cystathionine beta-lyase activity(GO:0004121) |
| 0.8 | 2.3 | GO:0030275 | LRR domain binding(GO:0030275) |
| 0.7 | 2.1 | GO:0003844 | 1,4-alpha-glucan branching enzyme activity(GO:0003844) |
| 0.7 | 6.7 | GO:0004351 | glutamate decarboxylase activity(GO:0004351) |
| 0.7 | 0.7 | GO:0015185 | gamma-aminobutyric acid transmembrane transporter activity(GO:0015185) |
| 0.6 | 1.9 | GO:0004034 | aldose 1-epimerase activity(GO:0004034) |
| 0.6 | 2.6 | GO:0042781 | 3'-tRNA processing endoribonuclease activity(GO:0042781) |
| 0.6 | 1.9 | GO:0009671 | nitrate:proton symporter activity(GO:0009671) |
| 0.6 | 3.0 | GO:0008964 | phosphoenolpyruvate carboxylase activity(GO:0008964) |
| 0.6 | 2.4 | GO:0080002 | UDP-glucose:4-aminobenzoate acylglucosyltransferase activity(GO:0080002) |
| 0.6 | 3.9 | GO:0016781 | phosphotransferase activity, paired acceptors(GO:0016781) |
| 0.5 | 1.6 | GO:0016726 | oxidoreductase activity, acting on CH or CH2 groups, NAD or NADP as acceptor(GO:0016726) |
| 0.5 | 5.9 | GO:0008453 | alanine-glyoxylate transaminase activity(GO:0008453) |
| 0.5 | 1.6 | GO:0070336 | Y-form DNA binding(GO:0000403) flap-structured DNA binding(GO:0070336) |
| 0.5 | 2.1 | GO:0005093 | Rab GDP-dissociation inhibitor activity(GO:0005093) |
| 0.5 | 1.6 | GO:0016661 | oxidoreductase activity, acting on other nitrogenous compounds as donors(GO:0016661) |
| 0.5 | 3.6 | GO:0102391 | decanoate--CoA ligase activity(GO:0102391) |
| 0.5 | 1.9 | GO:0009973 | adenylyl-sulfate reductase activity(GO:0009973) adenylyl-sulfate reductase (glutathione) activity(GO:0033741) |
| 0.5 | 2.4 | GO:0045502 | dynein binding(GO:0045502) dynein intermediate chain binding(GO:0045505) dynein light intermediate chain binding(GO:0051959) |
| 0.5 | 1.9 | GO:0016656 | monodehydroascorbate reductase (NADH) activity(GO:0016656) |
| 0.5 | 2.4 | GO:0035620 | ceramide transporter activity(GO:0035620) sphingolipid transporter activity(GO:0046624) ceramide 1-phosphate binding(GO:1902387) ceramide 1-phosphate transporter activity(GO:1902388) |
| 0.5 | 1.4 | GO:0046524 | sucrose-phosphate synthase activity(GO:0046524) |
| 0.5 | 4.1 | GO:0009882 | blue light photoreceptor activity(GO:0009882) |
| 0.4 | 1.3 | GO:0035605 | peptidyl-cysteine S-nitrosylase activity(GO:0035605) |
| 0.4 | 1.7 | GO:0008395 | steroid hydroxylase activity(GO:0008395) |
| 0.4 | 2.6 | GO:0030544 | Hsp70 protein binding(GO:0030544) |
| 0.4 | 1.3 | GO:0004775 | succinate-CoA ligase activity(GO:0004774) succinate-CoA ligase (ADP-forming) activity(GO:0004775) succinate-CoA ligase (GDP-forming) activity(GO:0004776) |
| 0.4 | 1.7 | GO:0004813 | alanine-tRNA ligase activity(GO:0004813) |
| 0.4 | 2.5 | GO:0018708 | thiol S-methyltransferase activity(GO:0018708) |
| 0.4 | 1.3 | GO:1990883 | rRNA cytidine N-acetyltransferase activity(GO:1990883) |
| 0.4 | 1.7 | GO:0004048 | anthranilate phosphoribosyltransferase activity(GO:0004048) |
| 0.4 | 1.2 | GO:0004450 | isocitrate dehydrogenase (NADP+) activity(GO:0004450) |
| 0.4 | 3.2 | GO:0050307 | sucrose-phosphate phosphatase activity(GO:0050307) |
| 0.4 | 2.8 | GO:0080115 | myosin tail binding(GO:0032029) myosin heavy chain binding(GO:0032036) myosin XI tail binding(GO:0080115) |
| 0.4 | 2.8 | GO:0005047 | signal recognition particle binding(GO:0005047) |
| 0.4 | 1.2 | GO:0022858 | L-alanine transmembrane transporter activity(GO:0015180) alanine transmembrane transporter activity(GO:0022858) |
| 0.4 | 3.1 | GO:0016987 | core DNA-dependent RNA polymerase binding promoter specificity activity(GO:0000996) sigma factor activity(GO:0016987) |
| 0.4 | 1.2 | GO:0050403 | trans-zeatin O-beta-D-glucosyltransferase activity(GO:0050403) cis-zeatin O-beta-D-glucosyltransferase activity(GO:0050502) |
| 0.4 | 2.7 | GO:0004567 | beta-mannosidase activity(GO:0004567) |
| 0.4 | 2.7 | GO:0050897 | cobalt ion binding(GO:0050897) |
| 0.4 | 3.0 | GO:0004738 | pyruvate dehydrogenase activity(GO:0004738) |
| 0.4 | 2.2 | GO:0080109 | indole-3-acetonitrile nitrile hydratase activity(GO:0080109) |
| 0.4 | 1.1 | GO:0017022 | myosin binding(GO:0017022) |
| 0.3 | 12.0 | GO:0050135 | NAD(P)+ nucleosidase activity(GO:0050135) |
| 0.3 | 1.4 | GO:0052924 | trans-octaprenyltranstransferase activity(GO:0050347) all-trans-nonaprenyl-diphosphate synthase (geranylgeranyl-diphosphate specific) activity(GO:0052924) |
| 0.3 | 2.1 | GO:0050017 | L-3-cyanoalanine synthase activity(GO:0050017) |
| 0.3 | 2.0 | GO:0009884 | cytokinin receptor activity(GO:0009884) |
| 0.3 | 2.3 | GO:0004345 | glucose-6-phosphate dehydrogenase activity(GO:0004345) |
| 0.3 | 1.0 | GO:0051777 | ent-kaurenoate oxidase activity(GO:0051777) |
| 0.3 | 2.0 | GO:0030527 | structural constituent of chromatin(GO:0030527) |
| 0.3 | 2.0 | GO:0001102 | RNA polymerase II activating transcription factor binding(GO:0001102) |
| 0.3 | 1.0 | GO:0051669 | levanase activity(GO:0031219) fructan beta-fructosidase activity(GO:0051669) |
| 0.3 | 2.6 | GO:0004566 | beta-glucuronidase activity(GO:0004566) |
| 0.3 | 7.1 | GO:0008559 | xenobiotic-transporting ATPase activity(GO:0008559) |
| 0.3 | 3.6 | GO:0032453 | histone demethylase activity (H3-K4 specific)(GO:0032453) histone demethylase activity (H3-trimethyl-K4 specific)(GO:0034647) |
| 0.3 | 1.0 | GO:0043425 | bHLH transcription factor binding(GO:0043425) |
| 0.3 | 2.9 | GO:0000285 | 1-phosphatidylinositol-3-phosphate 5-kinase activity(GO:0000285) |
| 0.3 | 4.1 | GO:1990939 | ATP-dependent microtubule motor activity(GO:1990939) |
| 0.3 | 1.9 | GO:0005483 | soluble NSF attachment protein activity(GO:0005483) |
| 0.3 | 2.2 | GO:0051018 | protein kinase A regulatory subunit binding(GO:0034237) protein kinase A binding(GO:0051018) Arp2/3 complex binding(GO:0071933) |
| 0.3 | 2.4 | GO:0019137 | thioglucosidase activity(GO:0019137) |
| 0.3 | 1.8 | GO:0010328 | auxin influx transmembrane transporter activity(GO:0010328) |
| 0.3 | 1.2 | GO:0046481 | digalactosyldiacylglycerol synthase activity(GO:0046481) |
| 0.3 | 1.2 | GO:0004534 | 5'-3' exoribonuclease activity(GO:0004534) |
| 0.3 | 1.5 | GO:0034511 | U3 snoRNA binding(GO:0034511) |
| 0.3 | 1.2 | GO:0015603 | iron chelate transmembrane transporter activity(GO:0015603) iron-nicotianamine transmembrane transporter activity(GO:0051980) |
| 0.3 | 3.3 | GO:0016723 | ferric-chelate reductase activity(GO:0000293) oxidoreductase activity, oxidizing metal ions, NAD or NADP as acceptor(GO:0016723) |
| 0.3 | 0.9 | GO:0019788 | NEDD8 transferase activity(GO:0019788) |
| 0.3 | 0.9 | GO:0005344 | oxygen transporter activity(GO:0005344) |
| 0.3 | 0.9 | GO:0000824 | inositol-1,4,5-trisphosphate 6-kinase activity(GO:0000823) inositol tetrakisphosphate 3-kinase activity(GO:0000824) inositol-1,4,5-trisphosphate 3-kinase activity(GO:0008440) inositol tetrakisphosphate 5-kinase activity(GO:0047326) |
| 0.3 | 1.5 | GO:0046715 | borate transmembrane transporter activity(GO:0046715) borate efflux transmembrane transporter activity(GO:0080139) |
| 0.3 | 2.5 | GO:0004869 | cysteine-type endopeptidase inhibitor activity(GO:0004869) |
| 0.3 | 1.1 | GO:0016433 | rRNA (adenine) methyltransferase activity(GO:0016433) |
| 0.3 | 1.1 | GO:0002151 | G-quadruplex RNA binding(GO:0002151) |
| 0.3 | 0.5 | GO:0048365 | Rac GTPase binding(GO:0048365) |
| 0.3 | 4.4 | GO:0035064 | methylated histone binding(GO:0035064) |
| 0.3 | 1.8 | GO:0001047 | core promoter sequence-specific DNA binding(GO:0001046) core promoter binding(GO:0001047) |
| 0.3 | 1.5 | GO:0016312 | inositol bisphosphate phosphatase activity(GO:0016312) |
| 0.3 | 2.8 | GO:0043878 | glyceraldehyde-3-phosphate dehydrogenase (NAD+) (non-phosphorylating) activity(GO:0043878) |
| 0.3 | 0.8 | GO:0004042 | acetyl-CoA:L-glutamate N-acetyltransferase activity(GO:0004042) |
| 0.2 | 1.0 | GO:0045548 | phenylalanine ammonia-lyase activity(GO:0045548) |
| 0.2 | 1.2 | GO:0030943 | mitochondrion targeting sequence binding(GO:0030943) |
| 0.2 | 4.6 | GO:0008536 | Ran GTPase binding(GO:0008536) |
| 0.2 | 1.7 | GO:0010485 | H4 histone acetyltransferase activity(GO:0010485) |
| 0.2 | 3.4 | GO:0016207 | 4-coumarate-CoA ligase activity(GO:0016207) |
| 0.2 | 1.0 | GO:0017017 | MAP kinase tyrosine/serine/threonine phosphatase activity(GO:0017017) |
| 0.2 | 0.7 | GO:0004826 | phenylalanine-tRNA ligase activity(GO:0004826) |
| 0.2 | 0.9 | GO:0004791 | thioredoxin-disulfide reductase activity(GO:0004791) |
| 0.2 | 1.4 | GO:0005092 | GDP-dissociation inhibitor activity(GO:0005092) |
| 0.2 | 0.7 | GO:0016842 | amidine-lyase activity(GO:0016842) |
| 0.2 | 0.7 | GO:0030941 | chloroplast targeting sequence binding(GO:0030941) |
| 0.2 | 1.1 | GO:0042800 | histone methyltransferase activity (H3-K4 specific)(GO:0042800) |
| 0.2 | 0.7 | GO:0016504 | peptidase activator activity(GO:0016504) |
| 0.2 | 1.1 | GO:0004326 | tetrahydrofolylpolyglutamate synthase activity(GO:0004326) |
| 0.2 | 0.9 | GO:0004475 | mannose-1-phosphate guanylyltransferase activity(GO:0004475) |
| 0.2 | 0.9 | GO:0070034 | telomerase RNA binding(GO:0070034) |
| 0.2 | 1.1 | GO:0016768 | spermine synthase activity(GO:0016768) |
| 0.2 | 0.9 | GO:1990269 | phosphoserine binding(GO:0050815) RNA polymerase II C-terminal domain phosphoserine binding(GO:1990269) |
| 0.2 | 0.7 | GO:0003986 | acetyl-CoA hydrolase activity(GO:0003986) |
| 0.2 | 2.2 | GO:0072349 | modified amino acid transmembrane transporter activity(GO:0072349) |
| 0.2 | 0.7 | GO:0004514 | nicotinate-nucleotide diphosphorylase (carboxylating) activity(GO:0004514) |
| 0.2 | 1.1 | GO:0004614 | phosphoglucomutase activity(GO:0004614) |
| 0.2 | 0.9 | GO:0019156 | isoamylase activity(GO:0019156) |
| 0.2 | 0.9 | GO:0047517 | 1,4-beta-D-xylan synthase activity(GO:0047517) |
| 0.2 | 0.8 | GO:0004057 | arginyltransferase activity(GO:0004057) |
| 0.2 | 0.6 | GO:0050377 | UDP-L-rhamnose synthase activity(GO:0010280) UDP-glucose 4,6-dehydratase activity(GO:0050377) |
| 0.2 | 1.9 | GO:0008083 | growth factor activity(GO:0008083) |
| 0.2 | 2.7 | GO:0004430 | 1-phosphatidylinositol 4-kinase activity(GO:0004430) |
| 0.2 | 1.0 | GO:0050664 | NAD(P)H oxidase activity(GO:0016174) oxidoreductase activity, acting on NAD(P)H, oxygen as acceptor(GO:0050664) |
| 0.2 | 0.4 | GO:0003777 | microtubule motor activity(GO:0003777) |
| 0.2 | 1.0 | GO:0070139 | ubiquitin-like protein-specific endopeptidase activity(GO:0070137) SUMO-specific endopeptidase activity(GO:0070139) |
| 0.2 | 4.7 | GO:0051539 | 4 iron, 4 sulfur cluster binding(GO:0051539) |
| 0.2 | 1.4 | GO:0003872 | 6-phosphofructokinase activity(GO:0003872) |
| 0.2 | 1.0 | GO:0043682 | copper-transporting ATPase activity(GO:0043682) |
| 0.2 | 0.6 | GO:0010283 | pinoresinol reductase activity(GO:0010283) |
| 0.2 | 1.0 | GO:0004594 | pantothenate kinase activity(GO:0004594) |
| 0.2 | 5.1 | GO:0016655 | oxidoreductase activity, acting on NAD(P)H, quinone or similar compound as acceptor(GO:0016655) |
| 0.2 | 1.3 | GO:0047274 | galactinol-sucrose galactosyltransferase activity(GO:0047274) |
| 0.2 | 2.5 | GO:0009815 | 1-aminocyclopropane-1-carboxylate oxidase activity(GO:0009815) |
| 0.2 | 2.3 | GO:0070180 | large ribosomal subunit rRNA binding(GO:0070180) |
| 0.2 | 2.1 | GO:2001070 | starch binding(GO:2001070) |
| 0.2 | 0.6 | GO:1990404 | protein ADP-ribosylase activity(GO:1990404) |
| 0.2 | 1.3 | GO:0070905 | glycine hydroxymethyltransferase activity(GO:0004372) serine binding(GO:0070905) |
| 0.2 | 1.1 | GO:0050378 | UDP-glucuronate 4-epimerase activity(GO:0050378) |
| 0.2 | 0.5 | GO:0008481 | sphinganine kinase activity(GO:0008481) |
| 0.2 | 0.5 | GO:0008661 | 1-deoxy-D-xylulose-5-phosphate synthase activity(GO:0008661) |
| 0.2 | 0.9 | GO:0000062 | fatty-acyl-CoA binding(GO:0000062) |
| 0.2 | 2.0 | GO:0008725 | alkylbase DNA N-glycosylase activity(GO:0003905) DNA-3-methyladenine glycosylase activity(GO:0008725) DNA-3-methylbase glycosylase activity(GO:0043733) |
| 0.2 | 0.5 | GO:0070678 | preprotein binding(GO:0070678) |
| 0.2 | 18.1 | GO:0051082 | unfolded protein binding(GO:0051082) |
| 0.2 | 0.9 | GO:0034432 | bis(5'-adenosyl)-pentaphosphatase activity(GO:0034432) |
| 0.2 | 1.2 | GO:0045431 | flavonol synthase activity(GO:0045431) |
| 0.2 | 2.6 | GO:0000993 | RNA polymerase II core binding(GO:0000993) |
| 0.2 | 0.5 | GO:0008174 | mRNA methyltransferase activity(GO:0008174) |
| 0.2 | 0.7 | GO:0030942 | endoplasmic reticulum signal peptide binding(GO:0030942) |
| 0.2 | 0.7 | GO:0019825 | oxygen binding(GO:0019825) |
| 0.2 | 3.4 | GO:0009982 | pseudouridine synthase activity(GO:0009982) |
| 0.2 | 0.5 | GO:0050997 | phosphatidylcholine binding(GO:0031210) quaternary ammonium group binding(GO:0050997) |
| 0.2 | 0.8 | GO:0030267 | glyoxylate reductase (NADP) activity(GO:0030267) |
| 0.2 | 1.3 | GO:0004392 | heme oxygenase (decyclizing) activity(GO:0004392) |
| 0.2 | 1.0 | GO:0004416 | hydroxyacylglutathione hydrolase activity(GO:0004416) |
| 0.2 | 2.3 | GO:0051087 | chaperone binding(GO:0051087) |
| 0.2 | 0.7 | GO:0008469 | histone-arginine N-methyltransferase activity(GO:0008469) |
| 0.2 | 7.5 | GO:0003713 | transcription coactivator activity(GO:0003713) |
| 0.2 | 3.1 | GO:0004525 | ribonuclease III activity(GO:0004525) double-stranded RNA-specific ribonuclease activity(GO:0032296) |
| 0.2 | 0.5 | GO:0046976 | histone methyltransferase activity (H3-K27 specific)(GO:0046976) |
| 0.2 | 1.3 | GO:0005536 | glucose binding(GO:0005536) mannokinase activity(GO:0019158) |
| 0.2 | 0.5 | GO:0004046 | aminoacylase activity(GO:0004046) |
| 0.2 | 9.7 | GO:0043621 | protein self-association(GO:0043621) |
| 0.2 | 1.1 | GO:0050551 | myrcene synthase activity(GO:0050551) |
| 0.2 | 0.5 | GO:0004029 | aldehyde dehydrogenase (NAD) activity(GO:0004029) |
| 0.2 | 3.1 | GO:0015562 | efflux transmembrane transporter activity(GO:0015562) |
| 0.2 | 2.9 | GO:0015086 | cadmium ion transmembrane transporter activity(GO:0015086) |
| 0.2 | 2.5 | GO:0051117 | ATPase binding(GO:0051117) |
| 0.2 | 7.2 | GO:0102483 | scopolin beta-glucosidase activity(GO:0102483) |
| 0.2 | 0.9 | GO:0004448 | isocitrate dehydrogenase activity(GO:0004448) isocitrate dehydrogenase (NAD+) activity(GO:0004449) |
| 0.2 | 2.0 | GO:0004714 | transmembrane receptor protein tyrosine kinase activity(GO:0004714) |
| 0.2 | 0.6 | GO:0015930 | glutamate synthase activity(GO:0015930) glutamate synthase (NADH) activity(GO:0016040) glutamate synthase activity, NAD(P)H as acceptor(GO:0045181) |
| 0.2 | 0.8 | GO:0030371 | translation repressor activity(GO:0030371) |
| 0.2 | 0.8 | GO:0080122 | AMP transmembrane transporter activity(GO:0080122) |
| 0.1 | 0.6 | GO:0004075 | biotin carboxylase activity(GO:0004075) |
| 0.1 | 0.4 | GO:0015026 | coreceptor activity(GO:0015026) |
| 0.1 | 0.9 | GO:0050302 | aryl-aldehyde oxidase activity(GO:0018488) indole-3-acetaldehyde oxidase activity(GO:0050302) |
| 0.1 | 2.8 | GO:0003843 | 1,3-beta-D-glucan synthase activity(GO:0003843) |
| 0.1 | 2.0 | GO:0031369 | translation initiation factor binding(GO:0031369) |
| 0.1 | 0.6 | GO:0070182 | DNA polymerase binding(GO:0070182) |
| 0.1 | 1.6 | GO:0002161 | aminoacyl-tRNA editing activity(GO:0002161) |
| 0.1 | 0.6 | GO:0016840 | carbon-nitrogen lyase activity(GO:0016840) |
| 0.1 | 0.6 | GO:0016751 | dihydrolipoyllysine-residue succinyltransferase activity(GO:0004149) succinyltransferase activity(GO:0016748) S-succinyltransferase activity(GO:0016751) |
| 0.1 | 2.7 | GO:0003688 | DNA replication origin binding(GO:0003688) |
| 0.1 | 2.0 | GO:0016157 | sucrose synthase activity(GO:0016157) |
| 0.1 | 0.5 | GO:0004831 | tyrosine-tRNA ligase activity(GO:0004831) |
| 0.1 | 10.6 | GO:0003724 | RNA helicase activity(GO:0003724) |
| 0.1 | 4.3 | GO:0005267 | potassium channel activity(GO:0005267) |
| 0.1 | 2.6 | GO:0043295 | glutathione binding(GO:0043295) oligopeptide binding(GO:1900750) |
| 0.1 | 3.9 | GO:0015385 | sodium:proton antiporter activity(GO:0015385) |
| 0.1 | 0.5 | GO:0005247 | voltage-gated chloride channel activity(GO:0005247) chloride channel activity(GO:0005254) |
| 0.1 | 6.3 | GO:0008320 | protein transmembrane transporter activity(GO:0008320) macromolecule transmembrane transporter activity(GO:0022884) |
| 0.1 | 0.4 | GO:0004477 | methenyltetrahydrofolate cyclohydrolase activity(GO:0004477) methylenetetrahydrofolate dehydrogenase (NADP+) activity(GO:0004488) |
| 0.1 | 0.4 | GO:0016435 | rRNA (guanine) methyltransferase activity(GO:0016435) |
| 0.1 | 1.1 | GO:0046933 | proton-transporting ATP synthase activity, rotational mechanism(GO:0046933) |
| 0.1 | 0.9 | GO:0016151 | nickel cation binding(GO:0016151) |
| 0.1 | 0.2 | GO:0004766 | spermidine synthase activity(GO:0004766) |
| 0.1 | 0.4 | GO:0036310 | annealing helicase activity(GO:0036310) |
| 0.1 | 1.7 | GO:0030515 | snoRNA binding(GO:0030515) |
| 0.1 | 0.8 | GO:0008157 | protein phosphatase 1 binding(GO:0008157) |
| 0.1 | 0.8 | GO:0004069 | L-aspartate:2-oxoglutarate aminotransferase activity(GO:0004069) |
| 0.1 | 0.4 | GO:0045485 | omega-6 fatty acid desaturase activity(GO:0045485) |
| 0.1 | 0.5 | GO:0016920 | pyroglutamyl-peptidase activity(GO:0016920) |
| 0.1 | 1.1 | GO:0044183 | protein binding involved in protein folding(GO:0044183) |
| 0.1 | 2.7 | GO:0060090 | binding, bridging(GO:0060090) |
| 0.1 | 4.8 | GO:0019843 | rRNA binding(GO:0019843) |
| 0.1 | 0.7 | GO:0080046 | quercetin 4'-O-glucosyltransferase activity(GO:0080046) |
| 0.1 | 0.6 | GO:0004148 | dihydrolipoyl dehydrogenase activity(GO:0004148) |
| 0.1 | 0.3 | GO:0046920 | alpha-(1->3)-fucosyltransferase activity(GO:0046920) |
| 0.1 | 1.3 | GO:0010857 | calmodulin-dependent protein kinase activity(GO:0004683) calcium-dependent protein serine/threonine kinase activity(GO:0009931) calcium-dependent protein kinase activity(GO:0010857) |
| 0.1 | 0.3 | GO:0004828 | serine-tRNA ligase activity(GO:0004828) |
| 0.1 | 1.2 | GO:0061505 | DNA topoisomerase type II (ATP-hydrolyzing) activity(GO:0003918) DNA topoisomerase II activity(GO:0061505) |
| 0.1 | 0.5 | GO:0005460 | UDP-glucose transmembrane transporter activity(GO:0005460) |
| 0.1 | 1.2 | GO:0033170 | DNA clamp loader activity(GO:0003689) protein-DNA loading ATPase activity(GO:0033170) |
| 0.1 | 0.3 | GO:0004150 | dihydroneopterin aldolase activity(GO:0004150) |
| 0.1 | 0.4 | GO:0015089 | high-affinity copper ion transmembrane transporter activity(GO:0015089) |
| 0.1 | 4.4 | GO:0004707 | MAP kinase activity(GO:0004707) |
| 0.1 | 1.2 | GO:0003954 | NADH dehydrogenase activity(GO:0003954) |
| 0.1 | 0.6 | GO:0004619 | phosphoglycerate mutase activity(GO:0004619) |
| 0.1 | 0.9 | GO:0016624 | oxidoreductase activity, acting on the aldehyde or oxo group of donors, disulfide as acceptor(GO:0016624) |
| 0.1 | 1.1 | GO:0008409 | 5'-3' exonuclease activity(GO:0008409) |
| 0.1 | 1.0 | GO:0003950 | NAD+ ADP-ribosyltransferase activity(GO:0003950) |
| 0.1 | 1.9 | GO:0015386 | potassium:proton antiporter activity(GO:0015386) |
| 0.1 | 0.8 | GO:0019903 | protein phosphatase binding(GO:0019903) |
| 0.1 | 4.0 | GO:0008422 | beta-glucosidase activity(GO:0008422) |
| 0.1 | 0.7 | GO:0052854 | very-long-chain-(S)-2-hydroxy-acid oxidase activity(GO:0052852) long-chain-(S)-2-hydroxy-long-chain-acid oxidase activity(GO:0052853) medium-chain-(S)-2-hydroxy-acid oxidase activity(GO:0052854) |
| 0.1 | 0.2 | GO:0008144 | drug binding(GO:0008144) |
| 0.1 | 0.5 | GO:0004478 | methionine adenosyltransferase activity(GO:0004478) |
| 0.1 | 0.4 | GO:0047498 | calcium-dependent phospholipase A2 activity(GO:0047498) |
| 0.1 | 2.8 | GO:0097602 | cullin family protein binding(GO:0097602) |
| 0.1 | 0.5 | GO:0008251 | adenosine deaminase activity(GO:0004000) tRNA-specific adenosine deaminase activity(GO:0008251) |
| 0.1 | 1.9 | GO:0005227 | calcium activated cation channel activity(GO:0005227) ion gated channel activity(GO:0022839) |
| 0.1 | 1.3 | GO:0042389 | omega-3 fatty acid desaturase activity(GO:0042389) |
| 0.1 | 0.3 | GO:0008821 | crossover junction endodeoxyribonuclease activity(GO:0008821) |
| 0.1 | 0.3 | GO:0004412 | homoserine dehydrogenase activity(GO:0004412) |
| 0.1 | 0.3 | GO:0010354 | homogentisate prenyltransferase activity(GO:0010354) |
| 0.1 | 0.8 | GO:0002020 | protease binding(GO:0002020) |
| 0.1 | 0.7 | GO:0008177 | succinate dehydrogenase (ubiquinone) activity(GO:0008177) |
| 0.1 | 1.0 | GO:1990757 | ubiquitin ligase activator activity(GO:1990757) |
| 0.1 | 0.3 | GO:0008442 | 3-hydroxyisobutyrate dehydrogenase activity(GO:0008442) |
| 0.1 | 3.1 | GO:0004724 | magnesium-dependent protein serine/threonine phosphatase activity(GO:0004724) |
| 0.1 | 0.9 | GO:0019887 | protein kinase regulator activity(GO:0019887) |
| 0.1 | 0.7 | GO:0008022 | protein C-terminus binding(GO:0008022) |
| 0.1 | 0.3 | GO:0046409 | p-coumarate 3-hydroxylase activity(GO:0046409) |
| 0.1 | 1.2 | GO:0015114 | phosphate ion transmembrane transporter activity(GO:0015114) |
| 0.1 | 2.2 | GO:0003756 | protein disulfide isomerase activity(GO:0003756) intramolecular oxidoreductase activity, transposing S-S bonds(GO:0016864) |
| 0.1 | 0.4 | GO:0016034 | maleylacetoacetate isomerase activity(GO:0016034) |
| 0.1 | 11.6 | GO:0000978 | RNA polymerase II core promoter proximal region sequence-specific DNA binding(GO:0000978) |
| 0.1 | 0.8 | GO:0016849 | phosphorus-oxygen lyase activity(GO:0016849) |
| 0.1 | 0.4 | GO:0008301 | DNA binding, bending(GO:0008301) |
| 0.1 | 0.8 | GO:0010429 | methyl-CpNpG binding(GO:0010428) methyl-CpNpN binding(GO:0010429) |
| 0.1 | 2.1 | GO:0031386 | protein tag(GO:0031386) |
| 0.1 | 19.5 | GO:0003735 | structural constituent of ribosome(GO:0003735) |
| 0.1 | 0.1 | GO:0004352 | glutamate dehydrogenase (NAD+) activity(GO:0004352) |
| 0.1 | 0.9 | GO:0003906 | DNA-(apurinic or apyrimidinic site) lyase activity(GO:0003906) |
| 0.1 | 0.3 | GO:0050567 | glutaminyl-tRNA synthase (glutamine-hydrolyzing) activity(GO:0050567) |
| 0.1 | 13.9 | GO:0043531 | ADP binding(GO:0043531) |
| 0.1 | 8.0 | GO:0051015 | actin filament binding(GO:0051015) |
| 0.1 | 0.3 | GO:0001130 | bacterial-type RNA polymerase transcription factor activity, sequence-specific DNA binding(GO:0001130) bacterial-type RNA polymerase transcriptional activator activity, sequence-specific DNA binding(GO:0001216) |
| 0.1 | 1.3 | GO:0008195 | phosphatidate phosphatase activity(GO:0008195) |
| 0.1 | 0.7 | GO:0043539 | protein serine/threonine kinase activator activity(GO:0043539) |
| 0.1 | 0.3 | GO:0004424 | imidazoleglycerol-phosphate dehydratase activity(GO:0004424) |
| 0.1 | 0.7 | GO:0070696 | transmembrane receptor protein serine/threonine kinase binding(GO:0070696) |
| 0.1 | 0.2 | GO:0019902 | phosphatase binding(GO:0019902) |
| 0.1 | 0.3 | GO:0032977 | membrane insertase activity(GO:0032977) |
| 0.1 | 0.8 | GO:0047372 | acylglycerol lipase activity(GO:0047372) |
| 0.1 | 1.4 | GO:0004630 | phospholipase D activity(GO:0004630) N-acylphosphatidylethanolamine-specific phospholipase D activity(GO:0070290) |
| 0.1 | 1.1 | GO:0019210 | kinase inhibitor activity(GO:0019210) |
| 0.1 | 0.3 | GO:0042132 | fructose 1,6-bisphosphate 1-phosphatase activity(GO:0042132) |
| 0.1 | 1.2 | GO:0003951 | NAD+ kinase activity(GO:0003951) |
| 0.1 | 5.3 | GO:0004197 | cysteine-type endopeptidase activity(GO:0004197) |
| 0.1 | 0.5 | GO:0008381 | mechanically-gated ion channel activity(GO:0008381) mechanically gated channel activity(GO:0022833) |
| 0.1 | 1.8 | GO:0051219 | protein phosphorylated amino acid binding(GO:0045309) phosphoprotein binding(GO:0051219) |
| 0.1 | 0.4 | GO:0016629 | 12-oxophytodienoate reductase activity(GO:0016629) |
| 0.1 | 0.2 | GO:1990247 | N6-methyladenosine-containing RNA binding(GO:1990247) |
| 0.1 | 3.8 | GO:0042393 | histone binding(GO:0042393) |
| 0.1 | 1.9 | GO:0005345 | purine nucleobase transmembrane transporter activity(GO:0005345) |
| 0.1 | 0.5 | GO:0004366 | glycerol-3-phosphate O-acyltransferase activity(GO:0004366) |
| 0.1 | 0.3 | GO:0005432 | calcium:sodium antiporter activity(GO:0005432) |
| 0.1 | 0.4 | GO:0003979 | UDP-glucose 6-dehydrogenase activity(GO:0003979) |
| 0.1 | 0.4 | GO:0017108 | 5'-flap endonuclease activity(GO:0017108) |
| 0.1 | 0.5 | GO:0003746 | translation elongation factor activity(GO:0003746) |
| 0.1 | 0.4 | GO:0010179 | IAA-Ala conjugate hydrolase activity(GO:0010179) |
| 0.1 | 0.2 | GO:0008936 | nicotinamidase activity(GO:0008936) |
| 0.1 | 2.9 | GO:0003678 | DNA helicase activity(GO:0003678) |
| 0.1 | 0.6 | GO:0004045 | aminoacyl-tRNA hydrolase activity(GO:0004045) |
| 0.1 | 2.8 | GO:0016279 | lysine N-methyltransferase activity(GO:0016278) protein-lysine N-methyltransferase activity(GO:0016279) |
| 0.1 | 1.5 | GO:0080032 | methyl salicylate esterase activity(GO:0080031) methyl jasmonate esterase activity(GO:0080032) |
| 0.1 | 1.5 | GO:0008353 | RNA polymerase II carboxy-terminal domain kinase activity(GO:0008353) |
| 0.1 | 4.2 | GO:0016859 | cis-trans isomerase activity(GO:0016859) |
| 0.1 | 10.4 | GO:0015631 | tubulin binding(GO:0015631) |
| 0.1 | 15.2 | GO:0005509 | calcium ion binding(GO:0005509) |
| 0.1 | 0.7 | GO:0047938 | glucose-6-phosphate 1-epimerase activity(GO:0047938) |
| 0.1 | 0.5 | GO:0016274 | arginine N-methyltransferase activity(GO:0016273) protein-arginine N-methyltransferase activity(GO:0016274) |
| 0.1 | 0.6 | GO:0016423 | tRNA (guanine) methyltransferase activity(GO:0016423) |
| 0.1 | 0.7 | GO:0016538 | cyclin-dependent protein serine/threonine kinase regulator activity(GO:0016538) |
| 0.1 | 0.3 | GO:0010385 | double-stranded methylated DNA binding(GO:0010385) |
| 0.1 | 0.8 | GO:0016813 | hydrolase activity, acting on carbon-nitrogen (but not peptide) bonds, in linear amidines(GO:0016813) |
| 0.1 | 0.6 | GO:0043023 | ribosomal large subunit binding(GO:0043023) |
| 0.1 | 0.1 | GO:0010521 | telomerase inhibitor activity(GO:0010521) |
| 0.1 | 0.8 | GO:0016308 | 1-phosphatidylinositol-4-phosphate 5-kinase activity(GO:0016308) |
| 0.1 | 0.3 | GO:0050291 | sphingosine N-acyltransferase activity(GO:0050291) |
| 0.1 | 1.8 | GO:0004222 | metalloendopeptidase activity(GO:0004222) |
| 0.1 | 0.4 | GO:0016646 | oxidoreductase activity, acting on the CH-NH group of donors, NAD or NADP as acceptor(GO:0016646) |
| 0.1 | 0.6 | GO:0052747 | sinapyl alcohol dehydrogenase activity(GO:0052747) |
| 0.1 | 0.6 | GO:0035198 | miRNA binding(GO:0035198) |
| 0.1 | 0.3 | GO:0010277 | chlorophyllide a oxygenase [overall] activity(GO:0010277) |
| 0.1 | 0.4 | GO:0017070 | U6 snRNA binding(GO:0017070) |
| 0.1 | 0.2 | GO:0003995 | acyl-CoA dehydrogenase activity(GO:0003995) |
| 0.1 | 3.2 | GO:0061631 | ubiquitin conjugating enzyme activity(GO:0061631) |
| 0.1 | 0.2 | GO:0051731 | polynucleotide 5'-hydroxyl-kinase activity(GO:0051731) |
| 0.1 | 0.9 | GO:0016844 | strictosidine synthase activity(GO:0016844) |
| 0.1 | 2.8 | GO:0042910 | xenobiotic transporter activity(GO:0042910) |
| 0.1 | 0.2 | GO:0080132 | fatty acid alpha-hydroxylase activity(GO:0080132) |
| 0.1 | 0.4 | GO:0017112 | Rab guanyl-nucleotide exchange factor activity(GO:0017112) |
| 0.1 | 0.3 | GO:0046509 | 1,2-diacylglycerol 3-beta-galactosyltransferase activity(GO:0046509) |
| 0.1 | 8.9 | GO:0043492 | hydrolase activity, acting on acid anhydrides, catalyzing transmembrane movement of substances(GO:0016820) ATPase activity, coupled to transmembrane movement of substances(GO:0042626) ATPase activity, coupled to movement of substances(GO:0043492) |
| 0.1 | 0.4 | GO:0016149 | translation release factor activity, codon specific(GO:0016149) |
| 0.1 | 1.5 | GO:0008173 | RNA methyltransferase activity(GO:0008173) |
| 0.1 | 0.9 | GO:0080030 | methyl indole-3-acetate esterase activity(GO:0080030) |
| 0.1 | 0.3 | GO:0046577 | long-chain-alcohol oxidase activity(GO:0046577) |
| 0.1 | 0.9 | GO:0034485 | phosphatidylinositol-3,4,5-trisphosphate 5-phosphatase activity(GO:0034485) |
| 0.1 | 35.8 | GO:0003729 | mRNA binding(GO:0003729) poly(A) RNA binding(GO:0044822) |
| 0.1 | 2.5 | GO:0030145 | manganese ion binding(GO:0030145) |
| 0.1 | 0.7 | GO:0031491 | nucleosome binding(GO:0031491) |
| 0.1 | 0.6 | GO:0070567 | cytidylyltransferase activity(GO:0070567) |
| 0.1 | 1.0 | GO:0016857 | racemase and epimerase activity, acting on carbohydrates and derivatives(GO:0016857) |
| 0.1 | 1.9 | GO:0016876 | aminoacyl-tRNA ligase activity(GO:0004812) ligase activity, forming carbon-oxygen bonds(GO:0016875) ligase activity, forming aminoacyl-tRNA and related compounds(GO:0016876) |
| 0.1 | 0.3 | GO:0004096 | catalase activity(GO:0004096) |
| 0.0 | 0.2 | GO:0004779 | sulfate adenylyltransferase activity(GO:0004779) |
| 0.0 | 0.5 | GO:0005086 | ARF guanyl-nucleotide exchange factor activity(GO:0005086) |
| 0.0 | 1.5 | GO:0031624 | ubiquitin conjugating enzyme binding(GO:0031624) |
| 0.0 | 20.6 | GO:0008270 | zinc ion binding(GO:0008270) |
| 0.0 | 0.8 | GO:0016861 | intramolecular oxidoreductase activity, interconverting aldoses and ketoses(GO:0016861) |
| 0.0 | 2.2 | GO:0003899 | DNA-directed RNA polymerase activity(GO:0003899) |
| 0.0 | 1.3 | GO:0019001 | GTP binding(GO:0005525) guanyl nucleotide binding(GO:0019001) guanyl ribonucleotide binding(GO:0032561) |
| 0.0 | 0.4 | GO:0015112 | nitrate transmembrane transporter activity(GO:0015112) |
| 0.0 | 17.0 | GO:0004674 | protein serine/threonine kinase activity(GO:0004674) |
| 0.0 | 0.6 | GO:0015175 | neutral amino acid transmembrane transporter activity(GO:0015175) |
| 0.0 | 0.4 | GO:0008878 | glucose-1-phosphate adenylyltransferase activity(GO:0008878) |
| 0.0 | 0.2 | GO:0016707 | gibberellin 3-beta-dioxygenase activity(GO:0016707) |
| 0.0 | 0.3 | GO:0003909 | DNA ligase activity(GO:0003909) DNA ligase (ATP) activity(GO:0003910) ligase activity, forming phosphoric ester bonds(GO:0016886) |
| 0.0 | 0.3 | GO:0003968 | RNA-directed RNA polymerase activity(GO:0003968) |
| 0.0 | 0.1 | GO:0045174 | oxidoreductase activity, acting on a sulfur group of donors, quinone or similar compound as acceptor(GO:0016672) glutathione dehydrogenase (ascorbate) activity(GO:0045174) |
| 0.0 | 1.5 | GO:0004364 | glutathione transferase activity(GO:0004364) |
| 0.0 | 0.2 | GO:0017150 | tRNA dihydrouridine synthase activity(GO:0017150) |
| 0.0 | 4.1 | GO:0046982 | protein heterodimerization activity(GO:0046982) |
| 0.0 | 1.3 | GO:0016760 | cellulose synthase (UDP-forming) activity(GO:0016760) |
| 0.0 | 0.3 | GO:0004526 | ribonuclease P activity(GO:0004526) |
| 0.0 | 0.5 | GO:0004743 | pyruvate kinase activity(GO:0004743) potassium ion binding(GO:0030955) alkali metal ion binding(GO:0031420) |
| 0.0 | 0.3 | GO:0016731 | oxidoreductase activity, acting on iron-sulfur proteins as donors, NAD or NADP as acceptor(GO:0016731) |
| 0.0 | 0.3 | GO:0004602 | glutathione peroxidase activity(GO:0004602) |
| 0.0 | 0.0 | GO:0052659 | inositol-polyphosphate 5-phosphatase activity(GO:0004445) inositol-1,3,4,5-tetrakisphosphate 5-phosphatase activity(GO:0052659) inositol tetrakisphosphate phosphatase activity(GO:0052743) |
| 0.0 | 0.4 | GO:0043022 | ribosome binding(GO:0043022) |
| 0.0 | 0.1 | GO:0008883 | glutamyl-tRNA reductase activity(GO:0008883) |
| 0.0 | 1.2 | GO:0004620 | phospholipase activity(GO:0004620) |
| 0.0 | 0.5 | GO:0030276 | clathrin binding(GO:0030276) |
| 0.0 | 1.3 | GO:0001228 | transcriptional activator activity, RNA polymerase II transcription regulatory region sequence-specific binding(GO:0001228) |
| 0.0 | 0.3 | GO:0035252 | UDP-xylosyltransferase activity(GO:0035252) |
| 0.0 | 0.9 | GO:0005085 | guanyl-nucleotide exchange factor activity(GO:0005085) |
| 0.0 | 0.5 | GO:0003714 | transcription corepressor activity(GO:0003714) |
| 0.0 | 7.6 | GO:0004842 | ubiquitin-protein transferase activity(GO:0004842) |
| 0.0 | 0.3 | GO:0008237 | metallopeptidase activity(GO:0008237) |
| 0.0 | 0.3 | GO:0052381 | tRNA dimethylallyltransferase activity(GO:0052381) |
| 0.0 | 0.6 | GO:0003712 | transcription factor activity, transcription factor binding(GO:0000989) transcription cofactor activity(GO:0003712) |
| 0.0 | 8.7 | GO:0004672 | protein kinase activity(GO:0004672) |
| 0.0 | 0.1 | GO:0031683 | G-protein coupled receptor binding(GO:0001664) G-protein beta/gamma-subunit complex binding(GO:0031683) |
| 0.0 | 32.9 | GO:0003700 | nucleic acid binding transcription factor activity(GO:0001071) transcription factor activity, sequence-specific DNA binding(GO:0003700) |
| 0.0 | 0.3 | GO:0051540 | iron-sulfur cluster binding(GO:0051536) metal cluster binding(GO:0051540) |
| 0.0 | 0.2 | GO:0010294 | abscisic acid glucosyltransferase activity(GO:0010294) |
| 0.0 | 0.4 | GO:0019706 | protein-cysteine S-palmitoyltransferase activity(GO:0019706) protein-cysteine S-acyltransferase activity(GO:0019707) |
| 0.0 | 1.3 | GO:0004180 | carboxypeptidase activity(GO:0004180) |
| 0.0 | 0.3 | GO:0004084 | branched-chain-amino-acid transaminase activity(GO:0004084) |
| 0.0 | 0.3 | GO:0017056 | structural constituent of nuclear pore(GO:0017056) |
| 0.0 | 0.9 | GO:0008047 | enzyme activator activity(GO:0008047) |
| 0.0 | 0.8 | GO:0017137 | Rab GTPase binding(GO:0017137) |
| 0.0 | 0.3 | GO:0031418 | L-ascorbic acid binding(GO:0031418) |
| 0.0 | 1.0 | GO:0016879 | ligase activity, forming carbon-nitrogen bonds(GO:0016879) |
| 0.0 | 0.2 | GO:0015095 | magnesium ion transmembrane transporter activity(GO:0015095) |
| 0.0 | 0.1 | GO:0004333 | fumarate hydratase activity(GO:0004333) |
| 0.0 | 0.1 | GO:0051879 | Hsp90 protein binding(GO:0051879) |
| 0.0 | 0.9 | GO:0003682 | chromatin binding(GO:0003682) |
| 0.0 | 0.4 | GO:0004565 | beta-galactosidase activity(GO:0004565) |
| 0.0 | 0.1 | GO:0033925 | mannosyl-glycoprotein endo-beta-N-acetylglucosaminidase activity(GO:0033925) |
| 0.0 | 0.6 | GO:0003779 | actin binding(GO:0003779) |
| 0.0 | 0.8 | GO:0016811 | hydrolase activity, acting on carbon-nitrogen (but not peptide) bonds, in linear amides(GO:0016811) |
| 0.0 | 0.1 | GO:0047429 | nucleoside-triphosphate diphosphatase activity(GO:0047429) |
| 0.0 | 0.1 | GO:0034212 | peptide N-acetyltransferase activity(GO:0034212) |
| 0.0 | 0.0 | GO:0004563 | beta-N-acetylhexosaminidase activity(GO:0004563) |
| 0.0 | 0.1 | GO:0033926 | glycopeptide alpha-N-acetylgalactosaminidase activity(GO:0033926) |
| 0.0 | 0.5 | GO:0101005 | ubiquitinyl hydrolase activity(GO:0101005) |
| 0.0 | 0.1 | GO:0008276 | protein methyltransferase activity(GO:0008276) |
| 0.0 | 3.2 | GO:0003723 | RNA binding(GO:0003723) |
| 0.0 | 0.1 | GO:0043021 | ribonucleoprotein complex binding(GO:0043021) |
| 0.0 | 0.1 | GO:0003825 | alpha,alpha-trehalose-phosphate synthase (UDP-forming) activity(GO:0003825) |
| 0.0 | 1.4 | GO:0003924 | GTPase activity(GO:0003924) |
| 0.0 | 0.1 | GO:0004930 | G-protein coupled receptor activity(GO:0004930) |
| 0.0 | 0.1 | GO:0008417 | fucosyltransferase activity(GO:0008417) |
Gene overrepresentation in curated gene sets: canonical pathways category:
| Log-likelihood per target | Total log-likelihood | Term | Description |
|---|---|---|---|
| 0.7 | 2.1 | SIG CHEMOTAXIS | Genes related to chemotaxis |
| 0.6 | 1.8 | PID HNF3B PATHWAY | FOXA2 and FOXA3 transcription factor networks |
| 0.6 | 0.6 | ST GRANULE CELL SURVIVAL PATHWAY | Granule Cell Survival Pathway is a specific case of more general PAC1 Receptor Pathway. |
| 0.4 | 0.8 | PID INTEGRIN3 PATHWAY | Beta3 integrin cell surface interactions |
| 0.4 | 3.3 | NABA CORE MATRISOME | Ensemble of genes encoding core extracellular matrix including ECM glycoproteins, collagens and proteoglycans |
| 0.4 | 1.9 | PID S1P META PATHWAY | Sphingosine 1-phosphate (S1P) pathway |
| 0.3 | 0.9 | PID NFAT TFPATHWAY | Calcineurin-regulated NFAT-dependent transcription in lymphocytes |
| 0.3 | 1.6 | ST B CELL ANTIGEN RECEPTOR | B Cell Antigen Receptor |
| 0.2 | 1.2 | PID AP1 PATHWAY | AP-1 transcription factor network |
| 0.2 | 0.7 | PID VEGF VEGFR PATHWAY | VEGF and VEGFR signaling network |
| 0.2 | 0.4 | PID HIV NEF PATHWAY | HIV-1 Nef: Negative effector of Fas and TNF-alpha |
| 0.2 | 0.8 | PID SHP2 PATHWAY | SHP2 signaling |
| 0.2 | 1.5 | PID HIF1 TFPATHWAY | HIF-1-alpha transcription factor network |
| 0.1 | 1.0 | PID NOTCH PATHWAY | Notch signaling pathway |
| 0.1 | 0.4 | SIG INSULIN RECEPTOR PATHWAY IN CARDIAC MYOCYTES | Genes related to the insulin receptor pathway |
| 0.1 | 0.7 | PID BARD1 PATHWAY | BARD1 signaling events |
| 0.1 | 0.4 | PID ATM PATHWAY | ATM pathway |
| 0.1 | 0.6 | PID ATR PATHWAY | ATR signaling pathway |
| 0.1 | 0.3 | SA G1 AND S PHASES | Cdk2, 4, and 6 bind cyclin D in G1, while cdk2/cyclin E promotes the G1/S transition. |
| 0.1 | 0.7 | PID ERBB1 DOWNSTREAM PATHWAY | ErbB1 downstream signaling |
| 0.1 | 0.3 | PID PLK1 PATHWAY | PLK1 signaling events |
| 0.0 | 0.3 | PID CMYB PATHWAY | C-MYB transcription factor network |
Gene overrepresentation in curated gene sets: REACTOME pathways category:
| Log-likelihood per target | Total log-likelihood | Term | Description |
|---|---|---|---|
| 2.2 | 6.7 | REACTOME GABA SYNTHESIS RELEASE REUPTAKE AND DEGRADATION | Genes involved in GABA synthesis, release, reuptake and degradation |
| 0.8 | 3.4 | REACTOME RECRUITMENT OF MITOTIC CENTROSOME PROTEINS AND COMPLEXES | Genes involved in Recruitment of mitotic centrosome proteins and complexes |
| 0.7 | 2.0 | REACTOME APOPTOTIC EXECUTION PHASE | Genes involved in Apoptotic execution phase |
| 0.6 | 1.8 | REACTOME POTASSIUM CHANNELS | Genes involved in Potassium Channels |
| 0.5 | 1.4 | REACTOME ABACAVIR TRANSPORT AND METABOLISM | Genes involved in Abacavir transport and metabolism |
| 0.4 | 0.8 | REACTOME DOWNSTREAM SIGNALING OF ACTIVATED FGFR | Genes involved in Downstream signaling of activated FGFR |
| 0.3 | 0.9 | REACTOME TCR SIGNALING | Genes involved in TCR signaling |
| 0.3 | 2.7 | REACTOME SIGNALING BY RHO GTPASES | Genes involved in Signaling by Rho GTPases |
| 0.3 | 1.2 | REACTOME FORMATION OF THE TERNARY COMPLEX AND SUBSEQUENTLY THE 43S COMPLEX | Genes involved in Formation of the ternary complex, and subsequently, the 43S complex |
| 0.3 | 0.9 | REACTOME NEUROTRANSMITTER RECEPTOR BINDING AND DOWNSTREAM TRANSMISSION IN THE POSTSYNAPTIC CELL | Genes involved in Neurotransmitter Receptor Binding And Downstream Transmission In The Postsynaptic Cell |
| 0.2 | 0.7 | REACTOME MRNA DECAY BY 5 TO 3 EXORIBONUCLEASE | Genes involved in mRNA Decay by 5' to 3' Exoribonuclease |
| 0.2 | 0.7 | REACTOME GLYCOSPHINGOLIPID METABOLISM | Genes involved in Glycosphingolipid metabolism |
| 0.2 | 1.6 | REACTOME UNWINDING OF DNA | Genes involved in Unwinding of DNA |
| 0.2 | 0.9 | REACTOME MITOCHONDRIAL PROTEIN IMPORT | Genes involved in Mitochondrial Protein Import |
| 0.2 | 1.7 | REACTOME RNA POL II TRANSCRIPTION PRE INITIATION AND PROMOTER OPENING | Genes involved in RNA Polymerase II Transcription Pre-Initiation And Promoter Opening |
| 0.2 | 0.5 | REACTOME SPHINGOLIPID METABOLISM | Genes involved in Sphingolipid metabolism |
| 0.2 | 0.7 | REACTOME MITOTIC PROMETAPHASE | Genes involved in Mitotic Prometaphase |
| 0.2 | 0.5 | REACTOME HDL MEDIATED LIPID TRANSPORT | Genes involved in HDL-mediated lipid transport |
| 0.2 | 0.8 | REACTOME E2F ENABLED INHIBITION OF PRE REPLICATION COMPLEX FORMATION | Genes involved in E2F-enabled inhibition of pre-replication complex formation |
| 0.1 | 0.7 | REACTOME GLUCOSE TRANSPORT | Genes involved in Glucose transport |
| 0.1 | 0.6 | REACTOME VEGF LIGAND RECEPTOR INTERACTIONS | Genes involved in VEGF ligand-receptor interactions |
| 0.1 | 3.2 | REACTOME NONSENSE MEDIATED DECAY ENHANCED BY THE EXON JUNCTION COMPLEX | Genes involved in Nonsense Mediated Decay Enhanced by the Exon Junction Complex |
| 0.1 | 0.9 | REACTOME INTERFERON SIGNALING | Genes involved in Interferon Signaling |
| 0.1 | 0.4 | REACTOME SIGNALING BY FGFR IN DISEASE | Genes involved in Signaling by FGFR in disease |
| 0.1 | 0.4 | REACTOME HIV LIFE CYCLE | Genes involved in HIV Life Cycle |
| 0.1 | 0.2 | REACTOME NOTCH1 INTRACELLULAR DOMAIN REGULATES TRANSCRIPTION | Genes involved in NOTCH1 Intracellular Domain Regulates Transcription |
| 0.1 | 0.6 | REACTOME PPARA ACTIVATES GENE EXPRESSION | Genes involved in PPARA Activates Gene Expression |
| 0.1 | 1.1 | REACTOME FACTORS INVOLVED IN MEGAKARYOCYTE DEVELOPMENT AND PLATELET PRODUCTION | Genes involved in Factors involved in megakaryocyte development and platelet production |
| 0.1 | 1.9 | REACTOME ABC FAMILY PROTEINS MEDIATED TRANSPORT | Genes involved in ABC-family proteins mediated transport |
| 0.0 | 0.1 | REACTOME TRANSCRIPTIONAL ACTIVITY OF SMAD2 SMAD3 SMAD4 HETEROTRIMER | Genes involved in Transcriptional activity of SMAD2/SMAD3:SMAD4 heterotrimer |
| 0.0 | 0.2 | REACTOME PEROXISOMAL LIPID METABOLISM | Genes involved in Peroxisomal lipid metabolism |
| 0.0 | 0.1 | REACTOME HOST INTERACTIONS OF HIV FACTORS | Genes involved in Host Interactions of HIV factors |
| 0.0 | 0.2 | REACTOME PROTEIN FOLDING | Genes involved in Protein folding |