Project
GSE130291:vernalization in Arabidopsis thaliana
Navigation
Downloads
Results for AT2G45660
Z-value: 0.08
Transcription factors associated with AT2G45660
| Gene Symbol | Gene ID | Gene Info |
|---|---|---|
|
AT2G45660
|
AT2G45660 | AGAMOUS-like 20 |
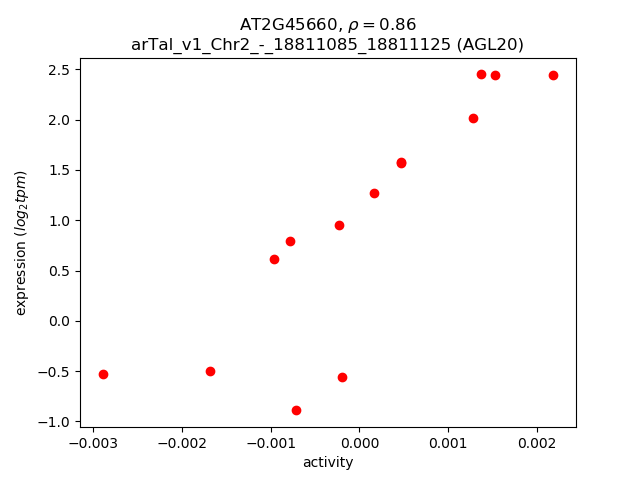
Activity-expression correlation:
| Gene | Promoter | Pearson corr. coef. | P-value | Plot |
|---|---|---|---|---|
| AGL20 | arTal_v1_Chr2_-_18811085_18811125 | 0.86 | 9.0e-05 | Click! |
Activity profile of AT2G45660 motif
Sorted Z-values of AT2G45660 motif
| Promoter | Log-likelihood | Transcript | Gene | Gene Info |
|---|---|---|---|---|
| arTal_v1_Chr2_-_18811085_18811125 | 0.18 |
AT2G45660.2
AT2G45660.1 |
AGL20
|
AGAMOUS-like 20 |
| arTal_v1_Chr1_+_24331373_24331428 | 0.02 |
AT1G65480.2
AT1G65480.1 |
FT
|
PEBP (phosphatidylethanolamine-binding protein) family protein |
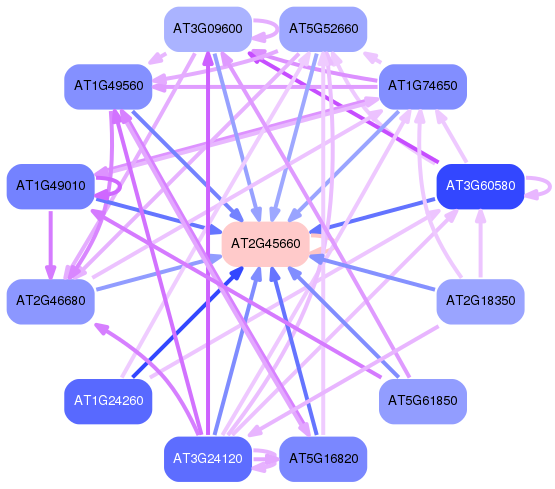
Network of associatons between targets according to the STRING database.

First level regulatory network of AT2G45660
Gene Ontology Analysis
Gene overrepresentation in biological process category:
| Log-likelihood per target | Total log-likelihood | Term | Description |
|---|---|---|---|
| 0.0 | 0.2 | GO:0010077 | maintenance of inflorescence meristem identity(GO:0010077) |