Project
GSE130291:vernalization in Arabidopsis thaliana
Navigation
Downloads
Results for AT2G36010_AT5G02470
Z-value: 0.99
Transcription factors associated with AT2G36010_AT5G02470
| Gene Symbol | Gene ID | Gene Info |
|---|---|---|
|
AT2G36010
|
AT2G36010 | E2F transcription factor 3 |
|
AT5G02470
|
AT5G02470 | Transcription factor DP |
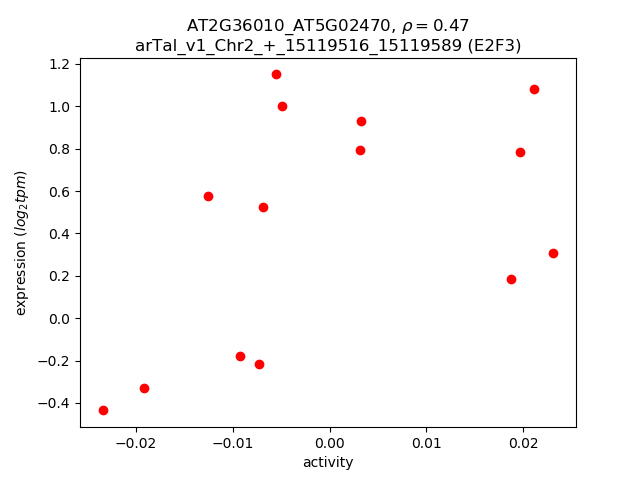
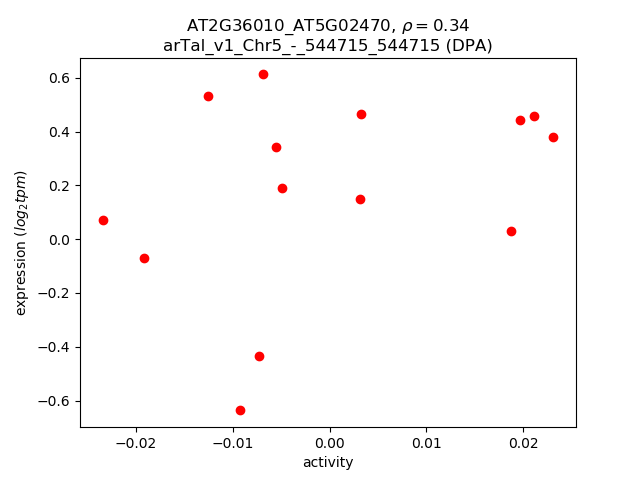
Activity-expression correlation:
| Gene | Promoter | Pearson corr. coef. | P-value | Plot |
|---|---|---|---|---|
| E2F3 | arTal_v1_Chr2_+_15119516_15119589 | 0.47 | 9.0e-02 | Click! |
| DPA | arTal_v1_Chr5_-_544715_544715 | 0.34 | 2.4e-01 | Click! |
Activity profile of AT2G36010_AT5G02470 motif
Sorted Z-values of AT2G36010_AT5G02470 motif
| Promoter | Log-likelihood | Transcript | Gene | Gene Info |
|---|---|---|---|---|
| arTal_v1_Chr3_-_9981620_9981620 | 1.29 |
AT3G27060.1
|
TSO2
|
Ferritin/ribonucleotide reductase-like family protein |
| arTal_v1_Chr1_+_2263037_2263037 | 1.22 |
AT1G07370.1
|
PCNA1
|
proliferating cellular nuclear antigen 1 |
| arTal_v1_Chr1_+_9298670_9298670 | 1.10 |
AT1G26840.1
|
ORC6
|
origin recognition complex protein 6 |
| arTal_v1_Chr2_-_12651753_12651753 | 1.07 |
AT2G29570.1
|
PCNA2
|
proliferating cell nuclear antigen 2 |
| arTal_v1_Chr2_+_9293261_9293261 | 0.98 |
AT2G21790.1
|
RNR1
|
ribonucleotide reductase 1 |
| arTal_v1_Chr5_+_16760846_16760846 | 0.85 |
AT5G41880.1
|
POLA3
|
DNA primase POLA3 |
| arTal_v1_Chr3_-_17288953_17289006 | 0.84 |
AT3G46940.1
AT3G46940.2 |
DUT1
|
DUTP-PYROPHOSPHATASE-LIKE 1 |
| arTal_v1_Chr4_-_7462447_7462447 | 0.83 |
AT4G12620.1
|
ORC1B
|
origin of replication complex 1B |
| arTal_v1_Chr3_+_9143916_9143916 | 0.81 |
AT3G25100.1
|
CDC45
|
cell division cycle 45 |
| arTal_v1_Chr2_+_16934621_16934621 | 0.79 |
AT2G40550.1
|
ETG1
|
E2F target protein 1 (ETG1) |
| arTal_v1_Chr3_-_654480_654487 | 0.79 |
AT3G02920.3
AT3G02920.1 AT3G02920.2 |
RPA32B
|
Replication protein A, subunit RPA32 |
| arTal_v1_Chr5_-_967432_967432 | 0.78 |
AT5G03700.1
|
AT5G03700
|
D-mannose binding lectin protein with Apple-like carbohydrate-binding domain-containing protein |
| arTal_v1_Chr2_-_7130729_7130729 | 0.76 |
AT2G16440.1
|
MCM4
|
Minichromosome maintenance (MCM2/3/5) family protein |
| arTal_v1_Chr3_+_20059671_20059671 | 0.72 |
AT3G54180.1
|
CDKB1%3B1
|
cyclin-dependent kinase B1;1 |
| arTal_v1_Chr2_-_13462431_13462431 | 0.64 |
AT2G31650.1
|
ATX1
|
homologue of trithorax |
| arTal_v1_Chr2_+_13328862_13328862 | 0.63 |
AT2G31270.1
|
CDT1A
|
CDT1-like protein A |
| arTal_v1_Chr4_-_15019771_15019771 | 0.62 |
AT4G30840.1
|
AT4G30840
|
Transducin/WD40 repeat-like superfamily protein |
| arTal_v1_Chr3_+_14751280_14751280 | 0.61 |
AT3G42660.1
|
AT3G42660
|
transducin family protein / WD-40 repeat family protein |
| arTal_v1_Chr3_+_21997052_21997052 | 0.59 |
AT3G59550.1
|
SYN3
|
Rad21/Rec8-like family protein |
| arTal_v1_Chr3_+_5008676_5008742 | 0.58 |
AT3G14890.1
AT3G14890.2 |
AT3G14890
|
phosphoesterase |
| arTal_v1_Chr3_-_20229214_20229214 | 0.56 |
AT3G54650.1
|
FBL17
|
RNI-like superfamily protein |
| arTal_v1_Chr3_-_3919359_3919359 | 0.55 |
AT3G12280.1
|
RBR1
|
retinoblastoma-related 1 |
| arTal_v1_Chr3_-_3919170_3919170 | 0.55 |
AT3G12280.2
|
RBR1
|
retinoblastoma-related 1 |
| arTal_v1_Chr1_-_25208972_25209101 | 0.53 |
AT1G67320.1
AT1G67320.3 AT1G67320.2 |
EMB2813
|
DNA primase, large subunit family |
| arTal_v1_Chr1_+_16970214_16970240 | 0.53 |
AT1G44900.2
AT1G44900.1 |
MCM2
|
minichromosome maintenance (MCM2/3/5) family protein |
| arTal_v1_Chr1_+_30336097_30336135 | 0.49 |
AT1G80720.2
AT1G80720.1 |
AT1G80720
|
Mitochondrial glycoprotein family protein |
| arTal_v1_Chr5_+_15208358_15208358 | 0.49 |
AT5G38110.1
|
ASF1B
|
anti- silencing function 1b |
| arTal_v1_Chr1_-_26253687_26253687 | 0.41 |
AT1G69770.1
|
CMT3
|
chromomethylase 3 |
| arTal_v1_Chr2_-_10400802_10400802 | 0.41 |
AT2G24490.1
|
RPA2
|
replicon protein A2 |
| arTal_v1_Chr4_+_12408950_12409007 | 0.41 |
AT4G23860.3
AT4G23860.2 AT4G23860.1 |
AT4G23860
|
PHD finger protein-like protein |
| arTal_v1_Chr2_-_10400498_10400498 | 0.40 |
AT2G24490.2
|
RPA2
|
replicon protein A2 |
| arTal_v1_Chr4_+_9871761_9871768 | 0.39 |
AT4G17760.2
AT4G17760.1 |
AT4G17760
|
PCNA domain-containing protein |
| arTal_v1_Chr3_-_3346360_3346360 | 0.38 |
AT3G10690.1
|
GYRA
|
DNA GYRASE A |
| arTal_v1_Chr3_+_611490_611524 | 0.38 |
AT3G02820.2
AT3G02820.1 |
AT3G02820
|
zinc knuckle (CCHC-type) family protein |
| arTal_v1_Chr1_-_1331163_1331169 | 0.37 |
AT1G04730.2
AT1G04730.1 AT1G04730.4 |
CTF18
|
P-loop containing nucleoside triphosphate hydrolases superfamily protein |
| arTal_v1_Chr5_-_7890355_7890355 | 0.36 |
AT5G23420.1
|
HMGB6
|
high-mobility group box 6 |
| arTal_v1_Chr5_-_6737496_6737496 | 0.35 |
AT5G19920.1
|
AT5G19920
|
Transducin/WD40 repeat-like superfamily protein |
| arTal_v1_Chr1_+_11057105_11057105 | 0.34 |
AT1G31020.1
|
TO2
|
thioredoxin O2 |
| arTal_v1_Chr5_+_5474366_5474366 | 0.33 |
AT5G16690.2
AT5G16690.1 |
ORC3
|
origin recognition complex subunit 3 |
| arTal_v1_Chr5_+_25574419_25574419 | 0.32 |
AT5G63920.1
|
TOP3A
|
topoisomerase 3alpha |
| arTal_v1_Chr1_+_24892340_24892340 | 0.31 |
AT1G66740.1
|
SGA2
|
ASF1 like histone chaperone |
| arTal_v1_Chr3_+_10232242_10232248 | 0.31 |
AT3G27640.1
AT3G27640.2 |
AT3G27640
|
Transducin/WD40 repeat-like superfamily protein |
| arTal_v1_Chr4_+_12409534_12409534 | 0.30 |
AT4G23860.4
|
AT4G23860
|
PHD finger protein-like protein |
| arTal_v1_Chr1_-_18337513_18337520 | 0.29 |
AT1G49540.2
AT1G49540.1 |
ELP2
|
elongator protein 2 |
| arTal_v1_Chr5_+_26776953_26776971 | 0.29 |
AT5G67100.2
AT5G67100.1 |
ICU2
|
DNA-directed DNA polymerase |
| arTal_v1_Chr5_+_2016566_2016590 | 0.28 |
AT5G06590.2
AT5G06590.1 |
AT5G06590
|
hypothetical protein |
| arTal_v1_Chr5_-_22955739_22955739 | 0.27 |
AT5G56740.1
|
HAG2
|
histone acetyltransferase of the GNAT family 2 |
| arTal_v1_Chr5_-_7890180_7890180 | 0.27 |
AT5G23420.2
|
HMGB6
|
high-mobility group box 6 |
| arTal_v1_Chr5_+_19932114_19932159 | 0.27 |
AT5G49160.1
AT5G49160.2 |
MET1
|
methyltransferase 1 |
| arTal_v1_Chr5_+_9823513_9823513 | 0.26 |
AT5G27740.1
|
EMB2775
|
ATPase family associated with various cellular activities (AAA) |
| arTal_v1_Chr5_-_22955352_22955352 | 0.24 |
AT5G56740.2
|
HAG2
|
histone acetyltransferase of the GNAT family 2 |
| arTal_v1_Chr5_+_25599514_25599514 | 0.24 |
AT5G63960.2
AT5G63960.1 |
AT5G63960
|
DNA polymerase delta subunit 1 |
| arTal_v1_Chr2_-_10621307_10621307 | 0.24 |
AT2G24970.1
|
AT2G24970
|
spindle/kinetochore-associated protein |
| arTal_v1_Chr1_-_2232897_2233017 | 0.22 |
AT1G07270.2
AT1G07270.1 |
AT1G07270
|
Cell division control, Cdc6 |
| arTal_v1_Chr1_+_17052475_17052475 | 0.21 |
AT1G45110.1
|
AT1G45110
|
Tetrapyrrole (Corrin/Porphyrin) Methylase |
| arTal_v1_Chr5_-_21463249_21463327 | 0.21 |
AT5G52910.1
AT5G52910.2 |
ATIM
|
timeless family protein |
| arTal_v1_Chr2_-_19551171_19551171 | 0.20 |
AT2G47680.1
|
AT2G47680
|
zinc finger (CCCH type) helicase family protein |
| arTal_v1_Chr1_-_2547946_2547946 | 0.19 |
AT1G08130.1
|
LIG1
|
DNA ligase 1 |
| arTal_v1_Chr1_+_30158923_30159046 | 0.19 |
AT1G80190.2
AT1G80190.3 AT1G80190.4 AT1G80190.1 AT1G80190.5 AT1G80190.6 |
PSF1
|
partner of SLD five 1 |
| arTal_v1_Chr2_+_801527_801527 | 0.18 |
AT2G02810.1
|
UTR1
|
UDP-galactose transporter 1 |
| arTal_v1_Chr1_-_12122928_12122928 | 0.15 |
AT1G33420.2
|
AT1G33420
|
RING/FYVE/PHD zinc finger superfamily protein |
| arTal_v1_Chr1_-_25348406_25348406 | 0.15 |
AT1G67630.1
|
POLA2
|
DNA polymerase alpha 2 |
| arTal_v1_Chr1_+_12746405_12746486 | 0.15 |
AT1G34770.1
AT1G34770.3 AT1G34770.2 AT1G34770.4 AT1G34770.5 AT1G34770.6 |
AT1G34770
|
melanoma-associated antigen G1-like protein |
| arTal_v1_Chr1_+_4567935_4567935 | 0.14 |
AT1G13330.1
|
AHP2
|
Tat-binding protein 1(Tbp-1)-interacting protein (TBPIP) |
| arTal_v1_Chr1_-_7192794_7192841 | 0.14 |
AT1G20720.1
AT1G20720.2 |
AT1G20720
|
RAD3-like DNA-binding helicase protein |
| arTal_v1_Chr3_+_3880908_3880935 | 0.14 |
AT3G12170.2
AT3G12170.1 |
AT3G12170
|
Chaperone DnaJ-domain superfamily protein |
| arTal_v1_Chr5_-_6202166_6202168 | 0.14 |
AT5G18620.2
AT5G18620.1 |
CHR17
|
chromatin remodeling factor17 |
| arTal_v1_Chr1_-_12123576_12123576 | 0.13 |
AT1G33420.1
|
AT1G33420
|
RING/FYVE/PHD zinc finger superfamily protein |
| arTal_v1_Chr1_+_29582907_29582907 | 0.13 |
AT1G78650.1
|
POLD3
|
DNA-directed DNA polymerase |
| arTal_v1_Chr3_+_1698297_1698297 | 0.11 |
AT3G05740.2
|
RECQI1
|
RECQ helicase l1 |
| arTal_v1_Chr3_-_2966197_2966231 | 0.11 |
AT3G09660.1
AT3G09660.2 AT3G09660.3 |
MCM8
|
minichromosome maintenance 8 |
| arTal_v1_Chr3_+_22421344_22421344 | 0.10 |
AT3G60660.1
|
AT3G60660
|
spindle/kinetochore-associated-like protein |
| arTal_v1_Chr4_-_8273903_8273903 | 0.10 |
AT4G14365.1
|
XBAT34
|
hypothetical protein |
| arTal_v1_Chr1_+_30048519_30048577 | 0.10 |
AT1G79890.1
AT1G79890.2 |
AT1G79890
|
RAD3-like DNA-binding helicase protein |
| arTal_v1_Chr3_+_1698079_1698079 | 0.09 |
AT3G05740.1
|
RECQI1
|
RECQ helicase l1 |
| arTal_v1_Chr4_-_13048262_13048262 | 0.08 |
AT4G25540.1
|
MSH3
|
homolog of DNA mismatch repair protein MSH3 |
| arTal_v1_Chr1_-_1330402_1330402 | 0.07 |
AT1G04730.3
|
CTF18
|
P-loop containing nucleoside triphosphate hydrolases superfamily protein |
| arTal_v1_Chr3_-_23444006_23444088 | 0.07 |
AT3G63480.1
AT3G63480.2 |
AT3G63480
|
ATP binding microtubule motor family protein |
| arTal_v1_Chr2_+_12689581_12689581 | 0.07 |
AT2G29680.1
|
CDC6
|
cell division control 6 |
| arTal_v1_Chr2_-_18556669_18556674 | 0.06 |
AT2G44980.2
AT2G44980.1 AT2G44980.3 |
ASG3
|
SNF2 domain-containing protein / helicase domain-containing protein |
| arTal_v1_Chr1_+_30048739_30048739 | 0.06 |
AT1G79890.3
|
AT1G79890
|
RAD3-like DNA-binding helicase protein |
| arTal_v1_Chr4_-_1080722_1080727 | 0.04 |
AT4G02460.3
AT4G02460.4 AT4G02460.2 AT4G02460.1 |
PMS1
|
DNA mismatch repair protein |
| arTal_v1_Chr2_-_17566237_17566237 | 0.03 |
AT2G42120.2
|
POLD2
|
DNA polymerase delta small subunit |
| arTal_v1_Chr1_+_30049612_30049612 | 0.02 |
AT1G79890.4
|
AT1G79890
|
RAD3-like DNA-binding helicase protein |
| arTal_v1_Chr3_-_8180122_8180122 | 0.01 |
AT3G23020.1
|
AT3G23020
|
Tetratricopeptide repeat (TPR)-like superfamily protein |
| arTal_v1_Chr2_-_17566032_17566032 | 0.01 |
AT2G42120.1
|
POLD2
|
DNA polymerase delta small subunit |
| arTal_v1_Chr1_+_25561638_25561898 | 0.01 |
AT1G68200.1
AT1G68200.3 AT1G68200.2 AT1G68200.4 AT1G68200.5 |
AT1G68200
|
Zinc finger C-x8-C-x5-C-x3-H type family protein |
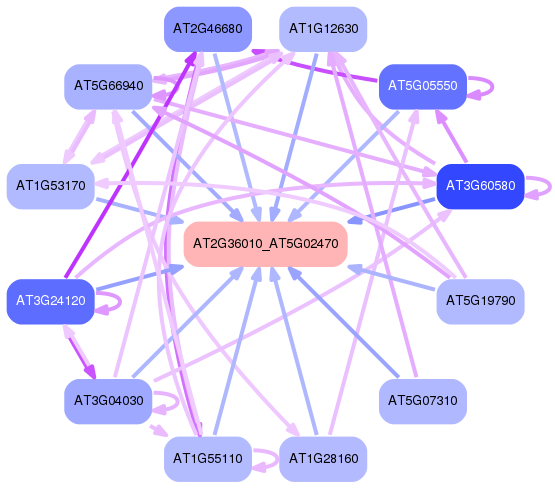
Network of associatons between targets according to the STRING database.

First level regulatory network of AT2G36010_AT5G02470
Gene Ontology Analysis
Gene overrepresentation in biological process category:
| Log-likelihood per target | Total log-likelihood | Term | Description |
|---|---|---|---|
| 0.6 | 1.9 | GO:2000045 | regulation of G1/S transition of mitotic cell cycle(GO:2000045) |
| 0.5 | 3.1 | GO:0009263 | deoxyribonucleotide biosynthetic process(GO:0009263) |
| 0.4 | 2.6 | GO:0006272 | leading strand elongation(GO:0006272) |
| 0.4 | 1.3 | GO:1902315 | cell cycle DNA replication initiation(GO:1902292) nuclear cell cycle DNA replication initiation(GO:1902315) mitotic DNA replication initiation(GO:1902975) |
| 0.3 | 0.6 | GO:0071163 | DNA replication preinitiation complex assembly(GO:0071163) |
| 0.3 | 0.5 | GO:0006348 | chromatin silencing at telomere(GO:0006348) |
| 0.2 | 0.7 | GO:0010069 | zygote asymmetric cytokinesis in embryo sac(GO:0010069) |
| 0.2 | 0.6 | GO:0080182 | histone H3-K4 trimethylation(GO:0080182) |
| 0.2 | 0.6 | GO:0055047 | generative cell mitosis(GO:0055047) |
| 0.1 | 0.8 | GO:0006336 | DNA replication-independent nucleosome assembly(GO:0006336) |
| 0.1 | 2.6 | GO:0006270 | DNA replication initiation(GO:0006270) |
| 0.1 | 0.3 | GO:0031538 | negative regulation of anthocyanin metabolic process(GO:0031538) |
| 0.1 | 0.2 | GO:0048478 | replication fork protection(GO:0048478) |
| 0.1 | 0.6 | GO:0070193 | synaptonemal complex assembly(GO:0007130) synaptonemal complex organization(GO:0070193) |
| 0.1 | 0.7 | GO:0006265 | DNA topological change(GO:0006265) |
| 0.0 | 0.2 | GO:0000012 | single strand break repair(GO:0000012) |
| 0.0 | 0.1 | GO:0006297 | nucleotide-excision repair, DNA gap filling(GO:0006297) |
| 0.0 | 0.1 | GO:0009557 | antipodal cell differentiation(GO:0009557) |
| 0.0 | 3.9 | GO:0006260 | DNA replication(GO:0006260) |
| 0.0 | 0.2 | GO:0015785 | UDP-galactose transport(GO:0015785) UDP-galactose transmembrane transport(GO:0072334) |
| 0.0 | 0.4 | GO:0000077 | DNA damage checkpoint(GO:0000077) |
| 0.0 | 0.1 | GO:1900036 | positive regulation of cellular response to heat(GO:1900036) |
| 0.0 | 0.6 | GO:0000741 | karyogamy(GO:0000741) polar nucleus fusion(GO:0010197) |
| 0.0 | 0.2 | GO:0032392 | DNA geometric change(GO:0032392) DNA duplex unwinding(GO:0032508) |
| 0.0 | 0.8 | GO:0048544 | recognition of pollen(GO:0048544) |
Gene overrepresentation in cellular component category:
| Log-likelihood per target | Total log-likelihood | Term | Description |
|---|---|---|---|
| 0.4 | 1.3 | GO:0005658 | alpha DNA polymerase:primase complex(GO:0005658) |
| 0.4 | 1.1 | GO:0005656 | nuclear pre-replicative complex(GO:0005656) pre-replicative complex(GO:0036387) |
| 0.3 | 1.9 | GO:0000808 | origin recognition complex(GO:0000808) nuclear origin of replication recognition complex(GO:0005664) |
| 0.2 | 2.1 | GO:0042555 | MCM complex(GO:0042555) |
| 0.1 | 0.4 | GO:0030896 | checkpoint clamp complex(GO:0030896) |
| 0.1 | 0.6 | GO:0001673 | male germ cell nucleus(GO:0001673) |
| 0.1 | 0.3 | GO:0030874 | nucleolar chromatin(GO:0030874) |
| 0.1 | 0.4 | GO:0009330 | DNA topoisomerase complex (ATP-hydrolyzing)(GO:0009330) |
| 0.1 | 0.8 | GO:0005662 | DNA replication factor A complex(GO:0005662) |
| 0.1 | 0.6 | GO:0030892 | nuclear cohesin complex(GO:0000798) mitotic cohesin complex(GO:0030892) meiotic cohesin complex(GO:0030893) nuclear mitotic cohesin complex(GO:0034990) nuclear meiotic cohesin complex(GO:0034991) |
| 0.1 | 0.2 | GO:0031298 | replication fork protection complex(GO:0031298) |
| 0.0 | 0.2 | GO:0043625 | delta DNA polymerase complex(GO:0043625) |
| 0.0 | 0.3 | GO:0033588 | Elongator holoenzyme complex(GO:0033588) |
| 0.0 | 0.6 | GO:0048471 | perinuclear region of cytoplasm(GO:0048471) |
| 0.0 | 0.2 | GO:0000777 | condensed chromosome kinetochore(GO:0000777) |
| 0.0 | 0.1 | GO:0000811 | GINS complex(GO:0000811) |
| 0.0 | 0.3 | GO:0005663 | DNA replication factor C complex(GO:0005663) |
| 0.0 | 0.3 | GO:0005657 | replication fork(GO:0005657) |
Gene overrepresentation in molecular function category:
| Log-likelihood per target | Total log-likelihood | Term | Description |
|---|---|---|---|
| 0.8 | 2.3 | GO:0061731 | ribonucleoside-diphosphate reductase activity, thioredoxin disulfide as acceptor(GO:0004748) oxidoreductase activity, acting on CH or CH2 groups, disulfide as acceptor(GO:0016728) ribonucleoside-diphosphate reductase activity(GO:0061731) |
| 0.2 | 1.1 | GO:0001102 | RNA polymerase II activating transcription factor binding(GO:0001102) |
| 0.2 | 3.6 | GO:0003688 | DNA replication origin binding(GO:0003688) |
| 0.2 | 0.6 | GO:0070182 | DNA polymerase binding(GO:0070182) |
| 0.1 | 0.8 | GO:0047429 | nucleoside-triphosphate diphosphatase activity(GO:0047429) |
| 0.1 | 0.7 | GO:0003886 | DNA (cytosine-5-)-methyltransferase activity(GO:0003886) |
| 0.0 | 0.5 | GO:0010485 | H4 histone acetyltransferase activity(GO:0010485) |
| 0.0 | 0.2 | GO:0005460 | UDP-glucose transmembrane transporter activity(GO:0005460) |
| 0.0 | 0.3 | GO:0003917 | DNA topoisomerase type I activity(GO:0003917) |
| 0.0 | 0.4 | GO:0003916 | DNA topoisomerase activity(GO:0003916) DNA topoisomerase type II (ATP-hydrolyzing) activity(GO:0003918) DNA topoisomerase II activity(GO:0061505) |
| 0.0 | 0.2 | GO:0003910 | DNA ligase activity(GO:0003909) DNA ligase (ATP) activity(GO:0003910) |
| 0.0 | 0.6 | GO:1901981 | phosphatidylinositol phosphate binding(GO:1901981) |
| 0.0 | 0.3 | GO:0033170 | DNA clamp loader activity(GO:0003689) protein-DNA loading ATPase activity(GO:0033170) |
| 0.0 | 0.2 | GO:0009378 | four-way junction helicase activity(GO:0009378) |
| 0.0 | 0.9 | GO:0003899 | DNA-directed RNA polymerase activity(GO:0003899) |
| 0.0 | 0.8 | GO:0003697 | single-stranded DNA binding(GO:0003697) |
Gene overrepresentation in curated gene sets: canonical pathways category:
| Log-likelihood per target | Total log-likelihood | Term | Description |
|---|---|---|---|
| 0.1 | 1.4 | PID ATR PATHWAY | ATR signaling pathway |
| 0.1 | 0.8 | PID CMYB PATHWAY | C-MYB transcription factor network |
| 0.0 | 0.3 | PID ATM PATHWAY | ATM pathway |
Gene overrepresentation in curated gene sets: REACTOME pathways category:
| Log-likelihood per target | Total log-likelihood | Term | Description |
|---|---|---|---|
| 0.3 | 2.2 | REACTOME UNWINDING OF DNA | Genes involved in Unwinding of DNA |
| 0.3 | 1.4 | REACTOME E2F ENABLED INHIBITION OF PRE REPLICATION COMPLEX FORMATION | Genes involved in E2F-enabled inhibition of pre-replication complex formation |
| 0.2 | 1.3 | REACTOME PROCESSIVE SYNTHESIS ON THE LAGGING STRAND | Genes involved in Processive synthesis on the lagging strand |
| 0.1 | 0.6 | REACTOME DOPAMINE NEUROTRANSMITTER RELEASE CYCLE | Genes involved in Dopamine Neurotransmitter Release Cycle |
| 0.0 | 0.3 | REACTOME MEIOTIC RECOMBINATION | Genes involved in Meiotic Recombination |
| 0.0 | 0.0 | REACTOME ORC1 REMOVAL FROM CHROMATIN | Genes involved in Orc1 removal from chromatin |