Project
GSE130291:vernalization in Arabidopsis thaliana
Navigation
Downloads
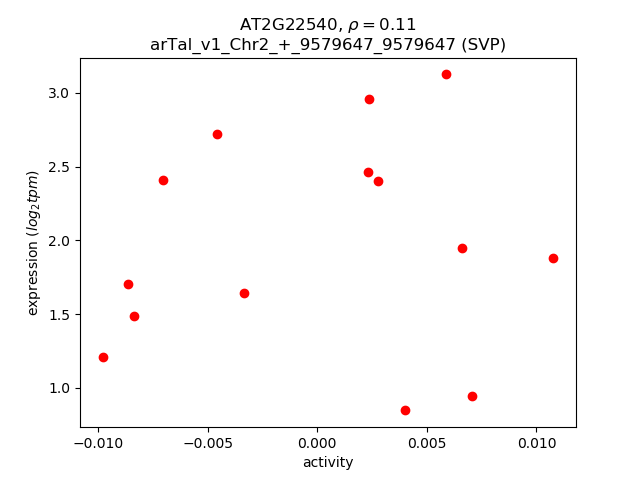
Results for AT2G22540
Z-value: 1.22
Transcription factors associated with AT2G22540
| Gene Symbol | Gene ID | Gene Info |
|---|---|---|
|
AT2G22540
|
AT2G22540 | K-box region and MADS-box transcription factor family protein |
Activity-expression correlation:
| Gene | Promoter | Pearson corr. coef. | P-value | Plot |
|---|---|---|---|---|
| SVP | arTal_v1_Chr2_+_9579647_9579647 | 0.11 | 7.1e-01 | Click! |
Activity profile of AT2G22540 motif
Sorted Z-values of AT2G22540 motif
| Promoter | Log-likelihood | Transcript | Gene | Gene Info |
|---|---|---|---|---|
| arTal_v1_Chr3_-_17441242_17441242 | 0.95 |
AT3G47340.3
AT3G47340.2 |
ASN1
|
glutamine-dependent asparagine synthase 1 |
| arTal_v1_Chr3_-_17441431_17441431 | 0.92 |
AT3G47340.1
|
ASN1
|
glutamine-dependent asparagine synthase 1 |
| arTal_v1_Chr3_-_17440176_17440176 | 0.92 |
AT3G47340.4
|
ASN1
|
glutamine-dependent asparagine synthase 1 |
| arTal_v1_Chr1_+_18546086_18546165 | 0.62 |
AT1G50050.2
AT1G50050.1 |
AT1G50050
|
CAP (Cysteine-rich secretory proteins, Antigen 5, and Pathogenesis-related 1 protein) superfamily protein |
| arTal_v1_Chr1_+_3777236_3777236 | 0.56 |
AT1G11260.1
|
STP1
|
sugar transporter 1 |
| arTal_v1_Chr5_-_7250770_7250770 | 0.53 |
AT5G21940.1
|
AT5G21940
|
hybrid signal transduction histidine kinase M-like protein |
| arTal_v1_Chr4_-_9393650_9393650 | 0.51 |
AT4G16690.1
|
MES16
|
methyl esterase 16 |
| arTal_v1_Chr2_-_9569784_9569784 | 0.51 |
AT2G22510.1
|
AT2G22510
|
hydroxyproline-rich glycoprotein family protein |
| arTal_v1_Chr3_-_16625043_16625043 | 0.50 |
AT3G45300.1
|
IVD
|
isovaleryl-CoA-dehydrogenase |
| arTal_v1_Chr3_-_21293158_21293171 | 0.47 |
AT3G57520.2
AT3G57520.3 AT3G57520.1 |
SIP2
|
seed imbibition 2 |
| arTal_v1_Chr1_+_10900681_10900681 | 0.46 |
AT1G30730.1
|
AT1G30730
|
FAD-binding Berberine family protein |
| arTal_v1_Chr1_+_30241452_30241452 | 0.46 |
AT1G80440.1
|
AT1G80440
|
Galactose oxidase/kelch repeat superfamily protein |
| arTal_v1_Chr5_-_26810116_26810116 | 0.45 |
AT5G67190.1
|
DEAR2
|
DREB and EAR motif protein 2 |
| arTal_v1_Chr2_+_11041331_11041331 | 0.44 |
AT2G25900.2
AT2G25900.1 |
ATCTH
|
Zinc finger C-x8-C-x5-C-x3-H type family protein |
| arTal_v1_Chr1_-_9935264_9935440 | 0.44 |
AT1G28330.3
AT1G28330.2 AT1G28330.4 AT1G28330.1 AT1G28330.6 AT1G28330.5 |
DYL1
|
dormancy-associated protein-like 1 |
| arTal_v1_Chr3_+_4510965_4510965 | 0.44 |
AT3G13750.1
|
BGAL1
|
beta galactosidase 1 |
| arTal_v1_Chr1_-_25176230_25176230 | 0.43 |
AT1G67265.1
|
RTFL21
|
ROTUNDIFOLIA like 21 |
| arTal_v1_Chr4_-_13016235_13016235 | 0.43 |
AT4G25470.1
|
CBF2
|
C-repeat/DRE binding factor 2 |
| arTal_v1_Chr3_-_18718396_18718396 | 0.42 |
AT3G50440.1
|
MES10
|
methylesterase |
| arTal_v1_Chr4_+_12699973_12699973 | 0.42 |
AT4G24600.1
|
AT4G24600
|
hypothetical protein |
| arTal_v1_Chr1_-_20804574_20804574 | 0.41 |
AT1G55675.1
|
AT1G55675
|
transmembrane protein |
| arTal_v1_Chr2_-_16950705_16950705 | 0.41 |
AT2G40610.1
|
EXPA8
|
expansin A8 |
| arTal_v1_Chr1_+_26654768_26654768 | 0.40 |
AT1G70700.3
AT1G70700.2 |
TIFY7
|
TIFY domain/Divergent CCT motif family protein |
| arTal_v1_Chr4_-_16942060_16942060 | 0.40 |
AT4G35750.1
|
AT4G35750
|
SEC14 cytosolic factor family protein / phosphoglyceride transfer family protein |
| arTal_v1_Chr3_-_12451556_12451556 | 0.39 |
AT3G30775.2
AT3G30775.1 |
ERD5
|
Methylenetetrahydrofolate reductase family protein |
| arTal_v1_Chr4_-_12568754_12568866 | 0.39 |
AT4G24230.6
AT4G24230.4 AT4G24230.5 AT4G24230.3 AT4G24230.2 AT4G24230.1 |
ACBP3
|
acyl-CoA-binding domain 3 |
| arTal_v1_Chr4_-_17050608_17050608 | 0.39 |
AT4G36040.1
|
J11
|
Chaperone DnaJ-domain superfamily protein |
| arTal_v1_Chr4_-_14393381_14393381 | 0.38 |
AT4G29190.1
|
OZF2
|
Zinc finger C-x8-C-x5-C-x3-H type family protein |
| arTal_v1_Chr4_-_2332814_2332814 | 0.38 |
AT4G04630.1
|
AT4G04630
|
senescence regulator (Protein of unknown function, DUF584) |
| arTal_v1_Chr1_+_8168443_8168443 | 0.38 |
AT1G23050.1
|
AT1G23050
|
hydroxyproline-rich glycoprotein family protein |
| arTal_v1_Chr5_-_5262840_5262840 | 0.38 |
AT5G16110.1
|
AT5G16110
|
hypothetical protein |
| arTal_v1_Chr1_+_26654529_26654529 | 0.37 |
AT1G70700.1
|
TIFY7
|
TIFY domain/Divergent CCT motif family protein |
| arTal_v1_Chr3_-_22907958_22907958 | 0.37 |
AT3G61880.1
AT3G61880.2 |
CYP78A9
|
cytochrome p450 78a9 |
| arTal_v1_Chr4_-_17672353_17672353 | 0.37 |
AT4G37610.1
|
BT5
|
BTB and TAZ domain protein 5 |
| arTal_v1_Chr1_-_2143977_2143977 | 0.37 |
AT1G06980.1
|
AT1G06980
|
6,7-dimethyl-8-ribityllumazine synthase |
| arTal_v1_Chr1_-_23246949_23246949 | 0.37 |
AT1G62770.1
|
AT1G62770
|
Plant invertase/pectin methylesterase inhibitor superfamily protein |
| arTal_v1_Chr3_+_10524181_10524181 | 0.36 |
AT3G28220.1
|
AT3G28220
|
TRAF-like family protein |
| arTal_v1_Chr3_-_18469962_18469962 | 0.36 |
AT3G49790.1
|
AT3G49790
|
Carbohydrate-binding protein |
| arTal_v1_Chr1_-_2195996_2195996 | 0.35 |
AT1G07150.1
|
MAPKKK13
|
mitogen-activated protein kinase kinase kinase 13 |
| arTal_v1_Chr1_+_28718069_28718168 | 0.35 |
AT1G76530.2
AT1G76530.1 AT1G76530.3 |
AT1G76530
|
Auxin efflux carrier family protein |
| arTal_v1_Chr1_+_12851983_12851983 | 0.35 |
AT1G35140.1
|
PHI-1
|
Phosphate-responsive 1 family protein |
| arTal_v1_Chr1_-_2195798_2195798 | 0.35 |
AT1G07150.2
|
MAPKKK13
|
mitogen-activated protein kinase kinase kinase 13 |
| arTal_v1_Chr1_+_25657757_25657757 | 0.35 |
AT1G68440.1
|
AT1G68440
|
transmembrane protein |
| arTal_v1_Chr2_+_13036814_13036925 | 0.34 |
AT2G30600.4
AT2G30600.5 AT2G30600.1 AT2G30600.3 |
AT2G30600
|
BTB/POZ domain-containing protein |
| arTal_v1_Chr3_+_2347186_2347186 | 0.34 |
AT3G07350.1
|
AT3G07350
|
sulfate/thiosulfate import ATP-binding protein, putative (DUF506) |
| arTal_v1_Chr2_+_13037238_13037238 | 0.33 |
AT2G30600.6
AT2G30600.2 |
AT2G30600
|
BTB/POZ domain-containing protein |
| arTal_v1_Chr1_+_4153641_4153641 | 0.33 |
AT1G12240.1
|
ATBETAFRUCT4
|
Glycosyl hydrolases family 32 protein |
| arTal_v1_Chr2_-_6493512_6493512 | 0.33 |
AT2G15020.1
|
AT2G15020
|
hypothetical protein |
| arTal_v1_Chr1_-_977761_977911 | 0.33 |
AT1G03850.1
AT1G03850.2 AT1G03850.3 |
GRXS13
|
Glutaredoxin family protein |
| arTal_v1_Chr1_-_1559917_1559917 | 0.33 |
AT1G05340.1
|
AT1G05340
|
cysteine-rich TM module stress tolerance protein |
| arTal_v1_Chr5_-_23768111_23768111 | 0.32 |
AT5G58860.1
|
CYP86A1
|
cytochrome P450, family 86, subfamily A, polypeptide 1 |
| arTal_v1_Chr4_-_14820595_14820595 | 0.32 |
AT4G30270.1
|
XTH24
|
xyloglucan endotransglucosylase/hydrolase 24 |
| arTal_v1_Chr1_-_30202349_30202349 | 0.32 |
AT1G80340.1
|
GA3OX2
|
gibberellin 3-oxidase 2 |
| arTal_v1_Chr2_-_5541355_5541479 | 0.32 |
AT2G13360.2
AT2G13360.1 AT2G13360.3 |
AGT
|
alanine:glyoxylate aminotransferase |
| arTal_v1_Chr2_+_2033154_2033154 | 0.32 |
AT2G05540.1
|
AT2G05540
|
Glycine-rich protein family |
| arTal_v1_Chr5_-_3242266_3242380 | 0.31 |
AT5G10310.2
AT5G10310.1 |
AT5G10310
|
EPIDERMAL PATTERNING FACTOR-like protein |
| arTal_v1_Chr1_+_21237839_21237888 | 0.31 |
AT1G56660.1
AT1G56660.2 |
AT1G56660
|
MAEBL domain protein |
| arTal_v1_Chr4_+_2505979_2505979 | 0.31 |
AT4G04925.1
|
AT4G04925
|
transmembrane protein |
| arTal_v1_Chr2_-_16459014_16459014 | 0.31 |
AT2G39415.1
|
AT2G39415
|
F-box family protein |
| arTal_v1_Chr1_+_8544248_8544308 | 0.31 |
AT1G24148.1
AT1G24148.2 |
AT1G24148
|
hypothetical protein |
| arTal_v1_Chr2_-_16603059_16603061 | 0.31 |
AT2G39800.2
AT2G39800.4 AT2G39800.3 |
P5CS1
|
delta1-pyrroline-5-carboxylate synthase 1 |
| arTal_v1_Chr1_+_21652988_21652988 | 0.31 |
AT1G58340.1
|
ZF14
|
MATE efflux family protein |
| arTal_v1_Chr3_+_6840281_6840281 | 0.30 |
AT3G19680.1
|
AT3G19680
|
hypothetical protein (DUF1005) |
| arTal_v1_Chr1_+_12030585_12030585 | 0.30 |
AT1G33180.1
|
AT1G33180
|
|
| arTal_v1_Chr5_-_18360978_18360978 | 0.30 |
AT5G45310.2
|
AT5G45310
|
coiled-coil protein |
| arTal_v1_Chr3_+_17427950_17427950 | 0.30 |
AT3G47295.1
|
AT3G47295
|
hypothetical protein |
| arTal_v1_Chr3_-_2048553_2048553 | 0.30 |
AT3G06570.1
|
AT3G06570
|
Galactose oxidase/kelch repeat superfamily protein |
| arTal_v1_Chr2_-_16603319_16603319 | 0.29 |
AT2G39800.1
|
P5CS1
|
delta1-pyrroline-5-carboxylate synthase 1 |
| arTal_v1_Chr3_-_3651726_3651726 | 0.29 |
AT3G11580.2
AT3G11580.1 AT3G11580.4 |
AT3G11580
|
AP2/B3-like transcriptional factor family protein |
| arTal_v1_Chr2_+_17507343_17507343 | 0.29 |
AT2G41940.1
|
ZFP8
|
zinc finger protein 8 |
| arTal_v1_Chr5_-_16634012_16634012 | 0.29 |
AT5G41590.1
|
AT5G41590
|
LURP-one-like protein (DUF567) |
| arTal_v1_Chr5_-_26052717_26052717 | 0.29 |
AT5G65207.1
|
AT5G65207
|
hypothetical protein |
| arTal_v1_Chr4_-_17674589_17674589 | 0.29 |
AT4G37620.1
|
AT4G37620
|
|
| arTal_v1_Chr5_-_23910082_23910082 | 0.29 |
AT5G59260.1
|
AT5G59260
|
Concanavalin A-like lectin protein kinase family protein |
| arTal_v1_Chr5_-_18361213_18361213 | 0.29 |
AT5G45310.1
|
AT5G45310
|
coiled-coil protein |
| arTal_v1_Chr3_-_3651489_3651553 | 0.29 |
AT3G11580.3
AT3G11580.5 |
AT3G11580
|
AP2/B3-like transcriptional factor family protein |
| arTal_v1_Chr1_+_15891281_15891371 | 0.29 |
AT1G42430.1
AT1G42430.2 |
AT1G42430
|
inactive purple acid phosphatase-like protein |
| arTal_v1_Chr1_-_11972580_11972580 | 0.29 |
AT1G33055.1
|
AT1G33055
|
hypothetical protein |
| arTal_v1_Chr5_+_4630892_4630892 | 0.28 |
AT5G14360.1
|
AT5G14360
|
Ubiquitin-like superfamily protein |
| arTal_v1_Chr5_-_26933286_26933352 | 0.28 |
AT5G67480.1
AT5G67480.3 |
BT4
|
BTB and TAZ domain protein 4 |
| arTal_v1_Chr4_-_12051796_12051891 | 0.28 |
AT4G22990.1
AT4G22990.2 AT4G22990.3 |
AT4G22990
|
Major Facilitator Superfamily with SPX (SYG1/Pho81/XPR1) domain-containing protein |
| arTal_v1_Chr1_+_17686990_17686990 | 0.28 |
AT1G47970.1
|
AT1G47970
|
nucleolin |
| arTal_v1_Chr5_+_17630426_17630426 | 0.28 |
AT5G43860.1
|
CLH2
|
chlorophyllase 2 |
| arTal_v1_Chr3_-_19453212_19453212 | 0.28 |
AT3G52480.1
|
AT3G52480
|
transmembrane protein |
| arTal_v1_Chr3_-_17910736_17910738 | 0.28 |
AT3G48360.3
AT3G48360.1 AT3G48360.2 |
BT2
|
BTB and TAZ domain protein 2 |
| arTal_v1_Chr3_-_17760950_17760950 | 0.28 |
AT3G48100.1
|
RR5
|
response regulator 5 |
| arTal_v1_Chr4_+_2554997_2554997 | 0.28 |
AT4G04990.1
|
AT4G04990
|
serine/arginine repetitive matrix-like protein (DUF761) |
| arTal_v1_Chr1_+_16847684_16847684 | 0.28 |
AT1G44414.1
|
AT1G44414
|
zinc-ribbon domain protein |
| arTal_v1_Chr5_-_24317935_24317935 | 0.28 |
AT5G60460.2
|
AT5G60460
|
Preprotein translocase Sec, Sec61-beta subunit protein |
| arTal_v1_Chr2_+_16877144_16877144 | 0.27 |
AT2G40420.1
|
AT2G40420
|
Transmembrane amino acid transporter family protein |
| arTal_v1_Chr3_-_4657723_4657723 | 0.27 |
AT3G14060.1
|
AT3G14060
|
hypothetical protein |
| arTal_v1_Chr2_-_18811085_18811125 | 0.27 |
AT2G45660.2
AT2G45660.1 |
AGL20
|
AGAMOUS-like 20 |
| arTal_v1_Chr5_-_26932825_26932825 | 0.27 |
AT5G67480.2
|
BT4
|
BTB and TAZ domain protein 4 |
| arTal_v1_Chr3_-_7704958_7704958 | 0.27 |
AT3G21870.1
|
CYCP2%3B1
|
cyclin p2;1 |
| arTal_v1_Chr4_+_15676240_15676240 | 0.27 |
AT4G32480.1
|
AT4G32480
|
sugar phosphate exchanger, putative (DUF506) |
| arTal_v1_Chr3_-_18764056_18764056 | 0.27 |
AT3G50560.1
|
AT3G50560
|
NAD(P)-binding Rossmann-fold superfamily protein |
| arTal_v1_Chr5_+_24323371_24323371 | 0.27 |
AT5G60480.1
|
HB26
|
homeobox protein 26 |
| arTal_v1_Chr3_+_18572624_18572624 | 0.26 |
AT3G50080.1
|
VFB2
|
VIER F-box protein 2 |
| arTal_v1_Chr2_-_13042586_13042586 | 0.26 |
AT2G30615.1
|
AT2G30615
|
F-box/LRR protein |
| arTal_v1_Chr4_+_13839038_13839038 | 0.26 |
AT4G27740.1
|
AT4G27740
|
Yippee family putative zinc-binding protein |
| arTal_v1_Chr1_-_4358894_4358894 | 0.26 |
AT1G12780.1
|
UGE1
|
UDP-D-glucose/UDP-D-galactose 4-epimerase 1 |
| arTal_v1_Chr5_-_5904380_5904380 | 0.26 |
AT5G17860.2
|
CAX7
|
calcium exchanger 7 |
| arTal_v1_Chr3_+_9827682_9827682 | 0.26 |
AT3G26740.1
|
CCL
|
CCR-like protein |
| arTal_v1_Chr1_-_3272110_3272110 | 0.26 |
AT1G10020.1
|
AT1G10020
|
formin-like protein (DUF1005) |
| arTal_v1_Chr4_-_9331646_9331646 | 0.26 |
AT4G16563.1
|
AT4G16563
|
Eukaryotic aspartyl protease family protein |
| arTal_v1_Chr5_+_2315947_2315947 | 0.26 |
AT5G07330.1
|
AT5G07330
|
NFU1 iron-sulfur cluster protein |
| arTal_v1_Chr2_+_15104716_15104740 | 0.26 |
AT2G35950.2
AT2G35950.1 |
EDA12
|
embryo sac development arrest 12 |
| arTal_v1_Chr5_+_17987591_17987591 | 0.26 |
AT5G44590.2
AT5G44590.1 |
AT5G44590
|
S-adenosyl-L-methionine-dependent methyltransferases superfamily protein |
| arTal_v1_Chr5_-_5904532_5904532 | 0.26 |
AT5G17860.1
|
CAX7
|
calcium exchanger 7 |
| arTal_v1_Chr3_-_7626654_7626654 | 0.26 |
AT3G21660.1
AT3G21660.2 |
AT3G21660
|
UBX domain-containing protein |
| arTal_v1_Chr1_+_21868190_21868190 | 0.26 |
AT1G59530.1
|
bZIP4
|
basic leucine-zipper 4 |
| arTal_v1_Chr3_-_18559326_18559326 | 0.26 |
AT3G50060.1
|
MYB77
|
myb domain protein 77 |
| arTal_v1_Chr5_-_24318241_24318241 | 0.25 |
AT5G60460.1
|
AT5G60460
|
Preprotein translocase Sec, Sec61-beta subunit protein |
| arTal_v1_Chr1_-_8310916_8310916 | 0.25 |
AT1G23390.1
|
AT1G23390
|
Kelch repeat-containing F-box family protein |
| arTal_v1_Chr5_-_14586835_14586835 | 0.25 |
AT5G36937.1
|
AT5G36937
|
|
| arTal_v1_Chr4_+_10103866_10103866 | 0.25 |
AT4G18280.1
|
AT4G18280
|
glycine-rich cell wall protein-like protein |
| arTal_v1_Chr3_+_16595099_16595099 | 0.25 |
AT3G45256.1
|
AT3G45256
|
|
| arTal_v1_Chr3_+_5243432_5243432 | 0.25 |
AT3G15510.1
|
NAC2
|
NAC domain containing protein 2 |
| arTal_v1_Chr2_-_10854948_10854948 | 0.25 |
AT2G25500.1
|
AT2G25500
|
Inosine triphosphate pyrophosphatase family protein |
| arTal_v1_Chr2_-_10672892_10672892 | 0.25 |
AT2G25090.1
|
CIPK16
|
CBL-interacting protein kinase 16 |
| arTal_v1_Chr2_+_11985687_11985687 | 0.25 |
AT2G28120.1
|
AT2G28120
|
Major facilitator superfamily protein |
| arTal_v1_Chr3_+_18481027_18481027 | 0.25 |
AT3G49820.1
|
AT3G49820
|
hypothetical protein |
| arTal_v1_Chr2_-_17202848_17202848 | 0.25 |
AT2G41250.1
|
AT2G41250
|
Haloacid dehalogenase-like hydrolase (HAD) superfamily protein |
| arTal_v1_Chr4_-_18459257_18459257 | 0.25 |
AT4G39780.1
|
AT4G39780
|
Integrase-type DNA-binding superfamily protein |
| arTal_v1_Chr1_-_16838562_16838562 | 0.25 |
AT1G44350.1
|
ILL6
|
IAA-amino acid hydrolase ILR1-like 6 |
| arTal_v1_Chr2_-_19412328_19412328 | 0.25 |
AT2G47270.1
|
UPB1
|
transcription factor UPBEAT protein |
| arTal_v1_Chr1_+_27402814_27402878 | 0.25 |
AT1G72820.1
AT1G72820.2 |
AT1G72820
|
Mitochondrial substrate carrier family protein |
| arTal_v1_Chr4_+_12488040_12488040 | 0.25 |
AT4G24040.1
|
TRE1
|
trehalase 1 |
| arTal_v1_Chr4_-_17355891_17356037 | 0.25 |
AT4G36850.3
AT4G36850.4 AT4G36850.2 AT4G36850.1 |
AT4G36850
|
PQ-loop repeat family protein / transmembrane family protein |
| arTal_v1_Chr5_+_6192327_6192443 | 0.25 |
AT5G18610.2
AT5G18610.3 AT5G18610.1 |
AT5G18610
|
Protein kinase superfamily protein |
| arTal_v1_Chr3_+_4583315_4583315 | 0.24 |
AT3G13898.1
|
AT3G13898
|
EPIDERMAL PATTERNING FACTOR-like protein |
| arTal_v1_Chr3_-_6650199_6650199 | 0.24 |
AT3G19200.1
|
AT3G19200
|
hypothetical protein |
| arTal_v1_Chr4_-_8350263_8350263 | 0.24 |
AT4G14550.1
AT4G14550.2 AT4G14550.3 |
IAA14
|
indole-3-acetic acid inducible 14 |
| arTal_v1_Chr3_-_22426369_22426369 | 0.24 |
AT3G60670.1
|
AT3G60670
|
PLATZ transcription factor family protein |
| arTal_v1_Chr4_-_8350030_8350030 | 0.24 |
AT4G14550.4
|
IAA14
|
indole-3-acetic acid inducible 14 |
| arTal_v1_Chr5_-_9011618_9011618 | 0.24 |
AT5G25840.1
|
AT5G25840
|
DUF1677 family protein (DUF1677) |
| arTal_v1_Chr4_-_82040_82040 | 0.24 |
AT4G00190.1
|
PME38
|
pectin methylesterase 38 |
| arTal_v1_Chr1_-_28897120_28897120 | 0.24 |
AT1G76930.2
|
EXT4
|
extensin 4 |
| arTal_v1_Chr1_-_28383769_28383769 | 0.24 |
AT1G75590.1
|
AT1G75590
|
SAUR-like auxin-responsive protein family |
| arTal_v1_Chr3_+_5721225_5721225 | 0.24 |
AT3G16800.3
|
AT3G16800
|
Protein phosphatase 2C family protein |
| arTal_v1_Chr1_+_12709090_12709090 | 0.24 |
AT1G34670.1
|
MYB93
|
myb domain protein 93 |
| arTal_v1_Chr5_-_3457557_3457627 | 0.24 |
AT5G10946.1
AT5G10946.2 |
AT5G10946
|
hypothetical protein |
| arTal_v1_Chr1_-_4526204_4526204 | 0.24 |
AT1G13245.1
|
RTFL17
|
ROTUNDIFOLIA like 17 |
| arTal_v1_Chr1_+_28472357_28472357 | 0.24 |
AT1G75830.1
|
LCR67
|
low-molecular-weight cysteine-rich 67 |
| arTal_v1_Chr2_+_15050498_15050498 | 0.24 |
AT2G35820.2
|
AT2G35820
|
ureidoglycolate hydrolase |
| arTal_v1_Chr5_-_3027114_3027114 | 0.24 |
AT5G09750.1
|
HEC3
|
basic helix-loop-helix (bHLH) DNA-binding superfamily protein |
| arTal_v1_Chr1_-_2163387_2163387 | 0.24 |
AT1G07040.1
|
AT1G07040
|
plant/protein |
| arTal_v1_Chr1_-_6714252_6714252 | 0.24 |
AT1G19400.4
|
AT1G19400
|
Erythronate-4-phosphate dehydrogenase family protein |
| arTal_v1_Chr5_-_22991530_22991530 | 0.24 |
AT5G56860.1
|
GNC
|
GATA type zinc finger transcription factor family protein |
| arTal_v1_Chr2_+_15050677_15050677 | 0.24 |
AT2G35820.1
|
AT2G35820
|
ureidoglycolate hydrolase |
| arTal_v1_Chr1_-_6714483_6714483 | 0.24 |
AT1G19400.3
AT1G19400.2 AT1G19400.1 |
AT1G19400
|
Erythronate-4-phosphate dehydrogenase family protein |
| arTal_v1_Chr1_-_28896883_28896883 | 0.23 |
AT1G76930.1
|
EXT4
|
extensin 4 |
| arTal_v1_Chr5_-_17629363_17629363 | 0.23 |
AT5G43850.1
|
ARD4
|
RmlC-like cupins superfamily protein |
| arTal_v1_Chr3_+_5562558_5562558 | 0.23 |
AT3G16390.1
|
NSP3
|
nitrile specifier protein 3 |
| arTal_v1_Chr4_+_11653234_11653234 | 0.23 |
AT4G21970.1
|
AT4G21970
|
senescence regulator (Protein of unknown function, DUF584) |
| arTal_v1_Chr3_-_1837988_1837988 | 0.23 |
AT3G06080.2
AT3G06080.1 |
TBL10
|
trichome birefringence-like protein (DUF828) |
| arTal_v1_Chr3_-_17506124_17506124 | 0.23 |
AT3G47500.1
|
CDF3
|
cycling DOF factor 3 |
| arTal_v1_Chr2_-_11980003_11980003 | 0.23 |
AT2G28110.1
|
FRA8
|
Exostosin family protein |
| arTal_v1_Chr2_+_13277710_13277710 | 0.23 |
AT2G31160.1
|
LSH3
|
LIGHT-DEPENDENT SHORT HYPOCOTYLS-like protein (DUF640) |
| arTal_v1_Chr1_+_7146636_7146636 | 0.23 |
AT1G20630.1
|
CAT1
|
catalase 1 |
| arTal_v1_Chr1_-_26474786_26474833 | 0.23 |
AT1G70290.2
AT1G70290.1 |
TPS8
|
trehalose-6-phosphatase synthase S8 |
| arTal_v1_Chr5_-_855904_855955 | 0.23 |
AT5G03435.1
AT5G03435.2 |
AT5G03435
|
Ca2+dependent plant phosphoribosyltransferase family protein |
| arTal_v1_Chr3_-_2073991_2074087 | 0.23 |
AT3G06630.7
AT3G06630.1 AT3G06630.5 AT3G06630.3 AT3G06630.4 AT3G06630.2 |
AT3G06630
|
protein kinase family protein |
| arTal_v1_Chr3_+_8610979_8610979 | 0.23 |
AT3G23840.1
|
AT3G23840
|
HXXXD-type acyl-transferase family protein |
| arTal_v1_Chr2_-_12239124_12239146 | 0.23 |
AT2G28560.4
AT2G28560.2 AT2G28560.6 AT2G28560.5 AT2G28560.1 |
RAD51B
|
DNA repair (Rad51) family protein |
| arTal_v1_Chr3_-_9486924_9486924 | 0.23 |
AT3G25905.1
|
CLE27
|
CLAVATA3/ESR-RELATED 27 |
| arTal_v1_Chr1_-_4651549_4651549 | 0.23 |
AT1G13600.1
|
bZIP58
|
basic leucine-zipper 58 |
| arTal_v1_Chr1_+_26403341_26403368 | 0.23 |
AT1G70100.2
AT1G70100.5 AT1G70100.6 |
AT1G70100
|
neurofilament heavy protein |
| arTal_v1_Chr5_-_26531176_26531176 | 0.23 |
AT5G66440.1
|
AT5G66440
|
tRNA-methyltransferase non-catalytic subunit trm6MTase subunit |
| arTal_v1_Chr2_-_1140204_1140204 | 0.23 |
AT2G03730.1
AT2G03730.2 |
ACR5
|
ACT domain repeat 5 |
| arTal_v1_Chr1_+_27601593_27601632 | 0.23 |
AT1G73410.1
AT1G73410.2 |
MYB54
|
myb domain protein 54 |
| arTal_v1_Chr2_-_13946790_13946790 | 0.23 |
AT2G32870.1
AT2G32870.2 |
AT2G32870
|
TRAF-like family protein |
| arTal_v1_Chr5_-_1214439_1214439 | 0.23 |
AT5G04330.1
|
CYP84A4
|
Cytochrome P450 superfamily protein |
| arTal_v1_Chr3_+_5562400_5562400 | 0.22 |
AT3G16390.2
|
NSP3
|
nitrile specifier protein 3 |
| arTal_v1_Chr5_+_6445245_6445245 | 0.22 |
AT5G19170.1
|
AT5G19170
|
NEP-interacting protein, putative (DUF239) |
| arTal_v1_Chr3_+_22804998_22804998 | 0.22 |
AT3G61630.1
|
CRF6
|
cytokinin response factor 6 |
| arTal_v1_Chr3_-_16074929_16074929 | 0.22 |
AT3G44450.1
|
AT3G44450
|
hypothetical protein |
| arTal_v1_Chr5_-_17831336_17831336 | 0.22 |
AT5G44260.1
|
AT5G44260
|
Zinc finger C-x8-C-x5-C-x3-H type family protein |
| arTal_v1_Chr3_-_1643174_1643253 | 0.22 |
AT3G05640.2
AT3G05640.1 AT3G05640.3 |
AT3G05640
|
Protein phosphatase 2C family protein |
| arTal_v1_Chr5_+_4776733_4776733 | 0.22 |
AT5G14780.1
AT5G14780.3 AT5G14780.2 |
FDH
|
formate dehydrogenase |
| arTal_v1_Chr1_+_28740540_28740540 | 0.22 |
AT1G76590.1
|
AT1G76590
|
PLATZ transcription factor family protein |
| arTal_v1_Chr1_+_26402978_26403083 | 0.22 |
AT1G70100.1
AT1G70100.3 AT1G70100.4 |
AT1G70100
|
neurofilament heavy protein |
| arTal_v1_Chr5_+_359107_359107 | 0.22 |
AT5G01920.2
AT5G01920.1 |
STN8
|
Protein kinase superfamily protein |
| arTal_v1_Chr5_+_4555821_4555821 | 0.22 |
AT5G14120.1
|
AT5G14120
|
Major facilitator superfamily protein |
| arTal_v1_Chr5_+_23225951_23225951 | 0.22 |
AT5G57340.2
AT5G57340.1 |
AT5G57340
|
ras guanine nucleotide exchange factor Q-like protein |
| arTal_v1_Chr2_+_11364996_11364996 | 0.22 |
AT2G26695.2
AT2G26695.1 |
AT2G26695
|
Ran BP2/NZF zinc finger-like superfamily protein |
| arTal_v1_Chr3_+_10498177_10498177 | 0.22 |
AT3G28170.1
|
AT3G28170
|
hypothetical protein |
| arTal_v1_Chr5_+_22716917_22716917 | 0.22 |
AT5G56100.1
|
AT5G56100
|
glycine-rich protein / oleosin |
| arTal_v1_Chr5_+_22551734_22551739 | 0.22 |
AT5G55700.1
AT5G55700.2 |
BAM4
|
beta-amylase 4 |
| arTal_v1_Chr1_-_26119710_26119710 | 0.22 |
AT1G69485.1
|
AT1G69485
|
Ribosomal L32p protein family |
| arTal_v1_Chr2_+_8108898_8108898 | 0.22 |
AT2G18700.1
|
TPS11
|
trehalose phosphatase/synthase 11 |
| arTal_v1_Chr4_-_14627631_14627631 | 0.22 |
AT4G29905.1
|
AT4G29905
|
hypothetical protein |
| arTal_v1_Chr4_+_9759203_9759203 | 0.22 |
AT4G17500.1
|
ERF-1
|
ethylene responsive element binding factor 1 |
| arTal_v1_Chr3_+_5234457_5234457 | 0.21 |
AT3G15500.1
|
NAC3
|
NAC domain containing protein 3 |
| arTal_v1_Chr1_-_5645443_5645443 | 0.21 |
AT1G16510.1
|
AT1G16510
|
SAUR-like auxin-responsive protein family |
| arTal_v1_Chr1_-_11759324_11759324 | 0.21 |
AT1G32520.1
|
AT1G32520
|
TLDc domain protein |
| arTal_v1_Chr5_+_26710302_26710302 | 0.21 |
AT5G66880.1
|
SNRK2.3
|
sucrose nonfermenting 1(SNF1)-related protein kinase 2.3 |
| arTal_v1_Chr5_+_26710469_26710469 | 0.21 |
AT5G66880.2
|
SNRK2.3
|
sucrose nonfermenting 1(SNF1)-related protein kinase 2.3 |
| arTal_v1_Chr4_-_12331679_12331876 | 0.21 |
AT4G23660.3
AT4G23660.5 AT4G23660.2 AT4G23660.1 AT4G23660.4 |
PPT1
|
polyprenyltransferase 1 |
| arTal_v1_Chr5_-_10943378_10943378 | 0.21 |
AT5G28920.1
|
AT5G28920
|
hypothetical protein |
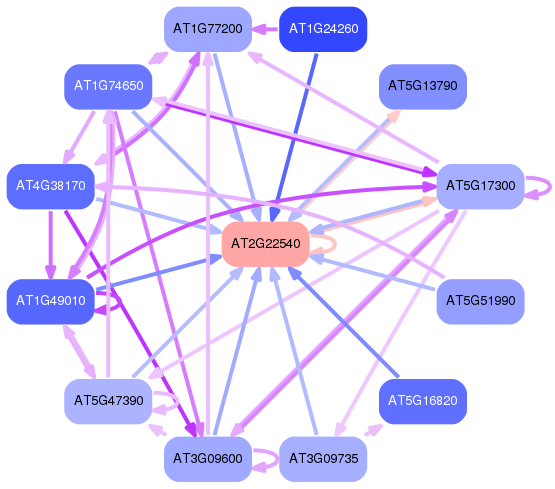
Network of associatons between targets according to the STRING database.

First level regulatory network of AT2G22540
Gene Ontology Analysis
Gene overrepresentation in biological process category:
| Log-likelihood per target | Total log-likelihood | Term | Description |
|---|---|---|---|
| 0.5 | 2.8 | GO:0070981 | cellular response to sucrose starvation(GO:0043617) L-asparagine biosynthetic process(GO:0070981) L-asparagine metabolic process(GO:0070982) |
| 0.1 | 0.4 | GO:0010203 | response to very low fluence red light stimulus(GO:0010203) |
| 0.1 | 0.4 | GO:0033530 | raffinose metabolic process(GO:0033530) |
| 0.1 | 0.4 | GO:0006057 | cell wall mannoprotein biosynthetic process(GO:0000032) mannoprotein metabolic process(GO:0006056) mannoprotein biosynthetic process(GO:0006057) cell wall glycoprotein biosynthetic process(GO:0031506) |
| 0.1 | 0.5 | GO:0097298 | regulation of nucleus size(GO:0097298) |
| 0.1 | 0.4 | GO:0002215 | defense response to nematode(GO:0002215) |
| 0.1 | 0.7 | GO:0043407 | negative regulation of MAP kinase activity(GO:0043407) negative regulation of MAPK cascade(GO:0043409) |
| 0.1 | 0.3 | GO:0016046 | detection of fungus(GO:0016046) |
| 0.1 | 0.3 | GO:0035606 | protein nitrosylation(GO:0017014) peptidyl-cysteine S-nitrosylation(GO:0018119) peptidyl-cysteine S-trans-nitrosylation(GO:0035606) |
| 0.1 | 0.3 | GO:2000029 | regulation of proanthocyanidin biosynthetic process(GO:2000029) |
| 0.1 | 0.3 | GO:0019859 | thymine catabolic process(GO:0006210) thymine metabolic process(GO:0019859) |
| 0.1 | 0.5 | GO:0010077 | maintenance of inflorescence meristem identity(GO:0010077) |
| 0.1 | 0.6 | GO:0055129 | L-proline biosynthetic process(GO:0055129) |
| 0.1 | 0.3 | GO:0035017 | cuticle pattern formation(GO:0035017) |
| 0.1 | 0.3 | GO:0051973 | positive regulation of telomerase activity(GO:0051973) |
| 0.1 | 0.6 | GO:0010929 | positive regulation of auxin mediated signaling pathway(GO:0010929) |
| 0.1 | 0.6 | GO:0006552 | leucine catabolic process(GO:0006552) |
| 0.1 | 0.4 | GO:0019323 | pentose catabolic process(GO:0019323) |
| 0.1 | 0.1 | GO:0009915 | phloem sucrose loading(GO:0009915) |
| 0.1 | 0.5 | GO:0048445 | carpel morphogenesis(GO:0048445) |
| 0.1 | 0.2 | GO:0035970 | peptidyl-threonine dephosphorylation(GO:0035970) |
| 0.1 | 0.5 | GO:0010023 | proanthocyanidin biosynthetic process(GO:0010023) |
| 0.1 | 0.3 | GO:0010606 | positive regulation of cytoplasmic mRNA processing body assembly(GO:0010606) |
| 0.1 | 0.2 | GO:0008645 | hexose transport(GO:0008645) fructose transport(GO:0015755) |
| 0.1 | 0.2 | GO:0009830 | cell wall modification involved in abscission(GO:0009830) cell wall disassembly(GO:0044277) |
| 0.1 | 0.6 | GO:0015749 | monosaccharide transport(GO:0015749) |
| 0.1 | 0.6 | GO:0051214 | RNA virus induced gene silencing(GO:0051214) |
| 0.1 | 0.3 | GO:0010390 | histone monoubiquitination(GO:0010390) |
| 0.1 | 0.4 | GO:0034227 | tRNA thio-modification(GO:0034227) |
| 0.1 | 0.3 | GO:0032418 | lysosome localization(GO:0032418) |
| 0.1 | 0.2 | GO:0055089 | fatty acid homeostasis(GO:0055089) |
| 0.1 | 1.1 | GO:0006814 | sodium ion transport(GO:0006814) |
| 0.1 | 0.8 | GO:0010076 | maintenance of floral meristem identity(GO:0010076) |
| 0.1 | 0.2 | GO:0015802 | basic amino acid transport(GO:0015802) |
| 0.1 | 0.1 | GO:0010116 | positive regulation of abscisic acid biosynthetic process(GO:0010116) |
| 0.1 | 0.2 | GO:0031468 | nuclear envelope reassembly(GO:0031468) |
| 0.1 | 0.2 | GO:0048656 | anther wall tapetum formation(GO:0048656) anther wall tapetum cell differentiation(GO:0048657) |
| 0.1 | 0.2 | GO:0030638 | polyketide metabolic process(GO:0030638) |
| 0.1 | 0.4 | GO:0006560 | proline metabolic process(GO:0006560) |
| 0.1 | 0.3 | GO:0048654 | anther morphogenesis(GO:0048654) anther wall tapetum morphogenesis(GO:0048655) |
| 0.1 | 0.2 | GO:1900459 | positive regulation of brassinosteroid mediated signaling pathway(GO:1900459) |
| 0.1 | 0.4 | GO:0080148 | negative regulation of response to water deprivation(GO:0080148) |
| 0.1 | 0.2 | GO:0046459 | short-chain fatty acid metabolic process(GO:0046459) |
| 0.1 | 0.4 | GO:1902584 | positive regulation of response to water deprivation(GO:1902584) |
| 0.1 | 0.5 | GO:0031204 | posttranslational protein targeting to membrane, translocation(GO:0031204) |
| 0.1 | 0.4 | GO:1901332 | negative regulation of lateral root development(GO:1901332) |
| 0.1 | 0.2 | GO:0009107 | lipoate biosynthetic process(GO:0009107) |
| 0.1 | 0.1 | GO:0032000 | positive regulation of fatty acid beta-oxidation(GO:0032000) positive regulation of lipid catabolic process(GO:0050996) |
| 0.0 | 0.1 | GO:0090227 | regulation of red or far-red light signaling pathway(GO:0090227) |
| 0.0 | 0.2 | GO:0009831 | plant-type cell wall modification involved in multidimensional cell growth(GO:0009831) |
| 0.0 | 0.1 | GO:0060964 | regulation of gene silencing by miRNA(GO:0060964) |
| 0.0 | 0.4 | GO:0042360 | vitamin E biosynthetic process(GO:0010189) vitamin E metabolic process(GO:0042360) |
| 0.0 | 0.1 | GO:0071421 | manganese ion transmembrane transport(GO:0071421) |
| 0.0 | 0.1 | GO:0010353 | response to trehalose(GO:0010353) |
| 0.0 | 0.2 | GO:1905157 | positive regulation of photosynthesis(GO:1905157) |
| 0.0 | 0.2 | GO:1904589 | regulation of protein import(GO:1904589) |
| 0.0 | 0.2 | GO:0080005 | photosystem stoichiometry adjustment(GO:0080005) |
| 0.0 | 0.2 | GO:0042549 | photosystem II stabilization(GO:0042549) |
| 0.0 | 0.7 | GO:0070413 | trehalose metabolism in response to stress(GO:0070413) |
| 0.0 | 0.4 | GO:0090506 | axillary shoot meristem initiation(GO:0090506) |
| 0.0 | 0.3 | GO:0009061 | anaerobic respiration(GO:0009061) |
| 0.0 | 0.2 | GO:0051091 | positive regulation of sequence-specific DNA binding transcription factor activity(GO:0051091) |
| 0.0 | 0.2 | GO:0006741 | NADP biosynthetic process(GO:0006741) |
| 0.0 | 0.3 | GO:0000710 | meiotic mismatch repair(GO:0000710) |
| 0.0 | 0.1 | GO:0010344 | seed oilbody biogenesis(GO:0010344) |
| 0.0 | 0.2 | GO:1901336 | lactone metabolic process(GO:1901334) lactone biosynthetic process(GO:1901336) strigolactone metabolic process(GO:1901600) strigolactone biosynthetic process(GO:1901601) |
| 0.0 | 1.1 | GO:0010584 | pollen exine formation(GO:0010584) |
| 0.0 | 0.2 | GO:1901562 | response to paraquat(GO:1901562) |
| 0.0 | 0.2 | GO:0048446 | petal morphogenesis(GO:0048446) |
| 0.0 | 0.2 | GO:1900458 | negative regulation of brassinosteroid mediated signaling pathway(GO:1900458) |
| 0.0 | 0.3 | GO:0097437 | maintenance of seed dormancy(GO:0010231) maintenance of dormancy(GO:0097437) |
| 0.0 | 0.1 | GO:0043570 | maintenance of DNA repeat elements(GO:0043570) |
| 0.0 | 0.1 | GO:1901537 | positive regulation of DNA demethylation(GO:1901537) |
| 0.0 | 0.2 | GO:0010677 | negative regulation of cellular carbohydrate metabolic process(GO:0010677) |
| 0.0 | 0.1 | GO:0042766 | nucleosome mobilization(GO:0042766) |
| 0.0 | 0.3 | GO:1901002 | positive regulation of response to salt stress(GO:1901002) |
| 0.0 | 0.3 | GO:0045836 | positive regulation of meiotic nuclear division(GO:0045836) |
| 0.0 | 0.2 | GO:0015846 | polyamine transport(GO:0015846) |
| 0.0 | 0.3 | GO:0000244 | spliceosomal tri-snRNP complex assembly(GO:0000244) |
| 0.0 | 0.1 | GO:0051196 | regulation of coenzyme metabolic process(GO:0051196) |
| 0.0 | 0.3 | GO:1901959 | positive regulation of cutin biosynthetic process(GO:1901959) |
| 0.0 | 0.1 | GO:0045962 | positive regulation of development, heterochronic(GO:0045962) |
| 0.0 | 0.4 | GO:0010161 | red light signaling pathway(GO:0010161) |
| 0.0 | 0.1 | GO:0032491 | detection of molecule of fungal origin(GO:0032491) |
| 0.0 | 0.1 | GO:0019627 | urea metabolic process(GO:0019627) |
| 0.0 | 0.1 | GO:0090392 | sepal giant cell differentiation(GO:0090392) |
| 0.0 | 0.1 | GO:0046037 | GMP biosynthetic process(GO:0006177) GMP metabolic process(GO:0046037) |
| 0.0 | 0.1 | GO:0015855 | pyrimidine nucleobase transport(GO:0015855) uracil transport(GO:0015857) |
| 0.0 | 0.4 | GO:0006621 | protein retention in ER lumen(GO:0006621) |
| 0.0 | 0.3 | GO:0051194 | positive regulation of cofactor metabolic process(GO:0051194) positive regulation of tetrapyrrole metabolic process(GO:1901403) |
| 0.0 | 1.1 | GO:0016102 | diterpenoid biosynthetic process(GO:0016102) |
| 0.0 | 0.2 | GO:2000114 | regulation of establishment of cell polarity(GO:2000114) |
| 0.0 | 0.1 | GO:0048479 | style development(GO:0048479) |
| 0.0 | 0.4 | GO:0010160 | formation of organ boundary(GO:0010160) formation of anatomical boundary(GO:0048859) |
| 0.0 | 0.2 | GO:0044211 | CTP salvage(GO:0044211) |
| 0.0 | 0.1 | GO:2000692 | negative regulation of seed maturation(GO:2000692) |
| 0.0 | 0.3 | GO:0010098 | suspensor development(GO:0010098) |
| 0.0 | 0.2 | GO:0005980 | glycogen catabolic process(GO:0005980) |
| 0.0 | 0.2 | GO:0010422 | regulation of brassinosteroid biosynthetic process(GO:0010422) regulation of steroid metabolic process(GO:0019218) regulation of steroid biosynthetic process(GO:0050810) regulation of steroid hormone biosynthetic process(GO:0090030) |
| 0.0 | 1.1 | GO:0048235 | pollen sperm cell differentiation(GO:0048235) |
| 0.0 | 0.6 | GO:0048829 | root cap development(GO:0048829) |
| 0.0 | 0.2 | GO:0097036 | regulation of plasma membrane sterol distribution(GO:0097036) |
| 0.0 | 0.2 | GO:0060774 | auxin mediated signaling pathway involved in phyllotactic patterning(GO:0060774) |
| 0.0 | 0.1 | GO:2001009 | regulation of plant-type cell wall cellulose biosynthetic process(GO:2001009) |
| 0.0 | 0.1 | GO:0045900 | negative regulation of translational elongation(GO:0045900) |
| 0.0 | 0.3 | GO:0048317 | seed morphogenesis(GO:0048317) |
| 0.0 | 0.2 | GO:0009823 | cytokinin catabolic process(GO:0009823) hormone catabolic process(GO:0042447) |
| 0.0 | 0.3 | GO:0032876 | negative regulation of DNA endoreduplication(GO:0032876) |
| 0.0 | 0.3 | GO:1902025 | nitrate import(GO:1902025) |
| 0.0 | 0.1 | GO:2000058 | protein ubiquitination involved in ubiquitin-dependent protein catabolic process(GO:0042787) regulation of protein ubiquitination involved in ubiquitin-dependent protein catabolic process(GO:2000058) |
| 0.0 | 0.2 | GO:0071588 | hydrogen peroxide mediated signaling pathway(GO:0071588) |
| 0.0 | 0.1 | GO:0030031 | cell projection organization(GO:0030030) cell projection assembly(GO:0030031) |
| 0.0 | 0.1 | GO:0034497 | protein localization to pre-autophagosomal structure(GO:0034497) |
| 0.0 | 0.2 | GO:1904961 | quiescent center organization(GO:1904961) |
| 0.0 | 0.3 | GO:0050898 | nitrile metabolic process(GO:0050898) nitrile biosynthetic process(GO:0080028) |
| 0.0 | 0.1 | GO:0060145 | viral gene silencing in virus induced gene silencing(GO:0060145) |
| 0.0 | 0.0 | GO:0051512 | positive regulation of unidimensional cell growth(GO:0051512) |
| 0.0 | 0.1 | GO:1901379 | regulation of potassium ion transmembrane transport(GO:1901379) regulation of cation transmembrane transport(GO:1904062) |
| 0.0 | 1.5 | GO:0009694 | jasmonic acid metabolic process(GO:0009694) |
| 0.0 | 0.0 | GO:0006808 | regulation of nitrogen utilization(GO:0006808) |
| 0.0 | 0.3 | GO:0006360 | transcription from RNA polymerase I promoter(GO:0006360) |
| 0.0 | 0.3 | GO:0009970 | cellular response to sulfate starvation(GO:0009970) |
| 0.0 | 0.1 | GO:0042276 | error-prone translesion synthesis(GO:0042276) |
| 0.0 | 0.2 | GO:0071901 | negative regulation of protein serine/threonine kinase activity(GO:0071901) |
| 0.0 | 0.2 | GO:0032351 | negative regulation of hormone metabolic process(GO:0032351) negative regulation of auxin metabolic process(GO:0090356) |
| 0.0 | 0.1 | GO:0016560 | protein import into peroxisome matrix, docking(GO:0016560) protein to membrane docking(GO:0022615) |
| 0.0 | 0.1 | GO:0006723 | cuticle hydrocarbon biosynthetic process(GO:0006723) |
| 0.0 | 0.1 | GO:0070550 | establishment of mitotic sister chromatid cohesion(GO:0034087) establishment of protein localization to chromosome(GO:0070199) rDNA condensation(GO:0070550) establishment of protein localization to chromatin(GO:0071169) transcriptional activation by promoter-enhancer looping(GO:0071733) gene looping(GO:0090202) dsDNA loop formation(GO:0090579) |
| 0.0 | 0.3 | GO:0043162 | ubiquitin-dependent protein catabolic process via the multivesicular body sorting pathway(GO:0043162) |
| 0.0 | 0.0 | GO:0060631 | regulation of meiosis I(GO:0060631) |
| 0.0 | 0.1 | GO:0000730 | DNA recombinase assembly(GO:0000730) |
| 0.0 | 0.1 | GO:0032988 | ribonucleoprotein complex disassembly(GO:0032988) |
| 0.0 | 0.3 | GO:0006298 | mismatch repair(GO:0006298) |
| 0.0 | 0.2 | GO:0046461 | neutral lipid catabolic process(GO:0046461) acylglycerol catabolic process(GO:0046464) |
| 0.0 | 0.1 | GO:0046521 | sphingoid catabolic process(GO:0046521) |
| 0.0 | 0.1 | GO:0002100 | tRNA wobble adenosine to inosine editing(GO:0002100) |
| 0.0 | 0.2 | GO:0080183 | response to photooxidative stress(GO:0080183) |
| 0.0 | 0.1 | GO:0006729 | tetrahydrobiopterin biosynthetic process(GO:0006729) tetrahydrobiopterin metabolic process(GO:0046146) |
| 0.0 | 0.1 | GO:0052249 | virus induced gene silencing(GO:0009616) modulation by symbiont of RNA levels in host(GO:0052018) modulation of RNA levels in other organism involved in symbiotic interaction(GO:0052249) |
| 0.0 | 0.1 | GO:0048281 | inflorescence morphogenesis(GO:0048281) |
| 0.0 | 0.6 | GO:0080092 | regulation of pollen tube growth(GO:0080092) |
| 0.0 | 0.1 | GO:0055073 | cadmium ion homeostasis(GO:0055073) |
| 0.0 | 0.1 | GO:0071786 | endoplasmic reticulum tubular network organization(GO:0071786) |
| 0.0 | 0.1 | GO:0007266 | Rho protein signal transduction(GO:0007266) |
| 0.0 | 0.2 | GO:0032365 | intracellular lipid transport(GO:0032365) |
| 0.0 | 0.2 | GO:0010188 | response to microbial phytotoxin(GO:0010188) |
| 0.0 | 0.1 | GO:1902065 | response to L-glutamate(GO:1902065) |
| 0.0 | 0.1 | GO:0001120 | DNA-templated transcriptional open complex formation(GO:0001112) transcriptional open complex formation at RNA polymerase II promoter(GO:0001113) protein-DNA complex remodeling(GO:0001120) macromolecular complex remodeling(GO:0034367) |
| 0.0 | 0.1 | GO:0032011 | ARF protein signal transduction(GO:0032011) regulation of ARF protein signal transduction(GO:0032012) |
| 0.0 | 0.2 | GO:0048363 | mucilage pectin metabolic process(GO:0048363) |
| 0.0 | 0.1 | GO:0045737 | positive regulation of cyclin-dependent protein serine/threonine kinase activity(GO:0045737) positive regulation of cyclin-dependent protein kinase activity(GO:1904031) |
| 0.0 | 0.2 | GO:0015908 | fatty acid transport(GO:0015908) |
| 0.0 | 0.5 | GO:0050826 | response to freezing(GO:0050826) |
| 0.0 | 0.1 | GO:1902457 | negative regulation of stomatal opening(GO:1902457) |
| 0.0 | 1.4 | GO:0031146 | SCF-dependent proteasomal ubiquitin-dependent protein catabolic process(GO:0031146) |
| 0.0 | 0.1 | GO:0080151 | positive regulation of salicylic acid mediated signaling pathway(GO:0080151) |
| 0.0 | 0.3 | GO:0006074 | (1->3)-beta-D-glucan metabolic process(GO:0006074) (1->3)-beta-D-glucan biosynthetic process(GO:0006075) |
| 0.0 | 0.1 | GO:0080065 | 4-alpha-methyl-delta7-sterol oxidation(GO:0080065) |
| 0.0 | 0.6 | GO:0043562 | cellular response to nitrogen levels(GO:0043562) |
| 0.0 | 0.1 | GO:0016540 | protein autoprocessing(GO:0016540) |
| 0.0 | 0.1 | GO:0034052 | positive regulation of plant-type hypersensitive response(GO:0034052) |
| 0.0 | 0.3 | GO:0010274 | hydrotropism(GO:0010274) |
| 0.0 | 0.1 | GO:0043100 | pyrimidine nucleobase salvage(GO:0043100) |
| 0.0 | 0.1 | GO:0046482 | para-aminobenzoic acid metabolic process(GO:0046482) |
| 0.0 | 0.1 | GO:0006557 | S-adenosylmethioninamine biosynthetic process(GO:0006557) S-adenosylmethioninamine metabolic process(GO:0046499) |
| 0.0 | 0.2 | GO:0015996 | chlorophyll catabolic process(GO:0015996) |
| 0.0 | 0.6 | GO:0045168 | cell-cell signaling involved in cell fate commitment(GO:0045168) |
| 0.0 | 0.1 | GO:0042138 | meiotic DNA double-strand break formation(GO:0042138) |
| 0.0 | 0.1 | GO:0010321 | regulation of vegetative phase change(GO:0010321) |
| 0.0 | 0.1 | GO:0015969 | guanosine tetraphosphate metabolic process(GO:0015969) purine ribonucleoside bisphosphate metabolic process(GO:0034035) |
| 0.0 | 0.1 | GO:0080009 | mRNA methylation(GO:0080009) |
| 0.0 | 0.4 | GO:1905177 | tracheary element differentiation(GO:1905177) |
| 0.0 | 0.2 | GO:0046352 | disaccharide catabolic process(GO:0046352) |
| 0.0 | 0.1 | GO:1902914 | regulation of protein polyubiquitination(GO:1902914) positive regulation of protein polyubiquitination(GO:1902916) |
| 0.0 | 0.2 | GO:0080027 | response to herbivore(GO:0080027) |
| 0.0 | 0.1 | GO:0045723 | positive regulation of fatty acid biosynthetic process(GO:0045723) |
| 0.0 | 0.1 | GO:0031929 | TOR signaling(GO:0031929) |
| 0.0 | 0.2 | GO:0009405 | pathogenesis(GO:0009405) |
| 0.0 | 0.0 | GO:0045682 | regulation of epithelial cell differentiation(GO:0030856) regulation of epidermal cell differentiation(GO:0045604) regulation of epidermis development(GO:0045682) |
| 0.0 | 0.1 | GO:0048577 | negative regulation of short-day photoperiodism, flowering(GO:0048577) |
| 0.0 | 0.3 | GO:0016180 | snRNA processing(GO:0016180) |
| 0.0 | 0.1 | GO:2000779 | regulation of double-strand break repair(GO:2000779) |
| 0.0 | 0.1 | GO:0042776 | mitochondrial ATP synthesis coupled proton transport(GO:0042776) |
| 0.0 | 0.2 | GO:0010093 | specification of floral organ identity(GO:0010093) |
| 0.0 | 0.3 | GO:0042593 | glucose homeostasis(GO:0042593) |
| 0.0 | 0.3 | GO:0010048 | vernalization response(GO:0010048) |
| 0.0 | 0.1 | GO:0048209 | regulation of vesicle targeting, to, from or within Golgi(GO:0048209) |
| 0.0 | 0.0 | GO:0001672 | regulation of chromatin assembly or disassembly(GO:0001672) |
| 0.0 | 0.2 | GO:0036065 | fucosylation(GO:0036065) |
| 0.0 | 0.1 | GO:0072659 | protein localization to plasma membrane(GO:0072659) |
| 0.0 | 0.1 | GO:0051569 | regulation of histone H3-K4 methylation(GO:0051569) |
| 0.0 | 0.1 | GO:0043247 | telomere maintenance in response to DNA damage(GO:0043247) |
| 0.0 | 0.3 | GO:0003333 | amino acid transmembrane transport(GO:0003333) |
| 0.0 | 0.1 | GO:0090116 | C-5 methylation of cytosine(GO:0090116) |
| 0.0 | 0.1 | GO:0099636 | cytoplasmic streaming(GO:0099636) |
| 0.0 | 0.5 | GO:0006829 | zinc II ion transport(GO:0006829) |
| 0.0 | 0.0 | GO:0071481 | cellular response to X-ray(GO:0071481) |
| 0.0 | 0.1 | GO:0010047 | fruit dehiscence(GO:0010047) |
| 0.0 | 0.3 | GO:2000652 | regulation of secondary cell wall biogenesis(GO:2000652) |
| 0.0 | 0.1 | GO:0046247 | carotene catabolic process(GO:0016121) terpene catabolic process(GO:0046247) |
| 0.0 | 0.3 | GO:0010022 | meristem determinacy(GO:0010022) |
| 0.0 | 0.1 | GO:0042149 | cellular response to glucose starvation(GO:0042149) |
| 0.0 | 0.1 | GO:0000012 | single strand break repair(GO:0000012) |
| 0.0 | 0.7 | GO:0042542 | response to hydrogen peroxide(GO:0042542) |
| 0.0 | 0.1 | GO:0080187 | floral organ senescence(GO:0080187) |
| 0.0 | 0.3 | GO:0019915 | lipid storage(GO:0019915) |
| 0.0 | 0.1 | GO:0009957 | epidermal cell fate specification(GO:0009957) |
| 0.0 | 0.1 | GO:0046621 | negative regulation of organ growth(GO:0046621) |
| 0.0 | 0.4 | GO:0006506 | GPI anchor metabolic process(GO:0006505) GPI anchor biosynthetic process(GO:0006506) |
| 0.0 | 0.1 | GO:0019310 | inositol catabolic process(GO:0019310) |
| 0.0 | 0.1 | GO:0046654 | tetrahydrofolate biosynthetic process(GO:0046654) |
| 0.0 | 0.1 | GO:0036297 | interstrand cross-link repair(GO:0036297) |
| 0.0 | 0.0 | GO:0009584 | detection of visible light(GO:0009584) |
| 0.0 | 0.2 | GO:0010216 | maintenance of DNA methylation(GO:0010216) |
| 0.0 | 0.1 | GO:0008535 | respiratory chain complex IV assembly(GO:0008535) mitochondrial respiratory chain complex IV assembly(GO:0033617) mitochondrial respiratory chain complex IV biogenesis(GO:0097034) |
| 0.0 | 0.2 | GO:0051762 | sesquiterpene biosynthetic process(GO:0051762) |
| 0.0 | 0.1 | GO:0046373 | L-arabinose metabolic process(GO:0046373) |
| 0.0 | 0.1 | GO:0080168 | abscisic acid transport(GO:0080168) |
| 0.0 | 0.1 | GO:0009750 | response to fructose(GO:0009750) |
| 0.0 | 0.2 | GO:0010588 | cotyledon vascular tissue pattern formation(GO:0010588) |
| 0.0 | 0.0 | GO:0030643 | cellular phosphate ion homeostasis(GO:0030643) cellular trivalent inorganic anion homeostasis(GO:0072502) |
| 0.0 | 0.1 | GO:1900425 | negative regulation of defense response to bacterium(GO:1900425) |
| 0.0 | 0.4 | GO:0006813 | potassium ion transport(GO:0006813) |
| 0.0 | 0.0 | GO:0046503 | glycerolipid catabolic process(GO:0046503) |
| 0.0 | 0.8 | GO:0009736 | cytokinin-activated signaling pathway(GO:0009736) |
| 0.0 | 0.1 | GO:0009769 | photosynthesis, light harvesting in photosystem II(GO:0009769) |
| 0.0 | 0.2 | GO:0010187 | negative regulation of seed germination(GO:0010187) |
| 0.0 | 0.1 | GO:0042391 | regulation of membrane potential(GO:0042391) |
| 0.0 | 0.2 | GO:0010207 | photosystem II assembly(GO:0010207) |
| 0.0 | 0.1 | GO:0030010 | establishment of cell polarity(GO:0030010) |
| 0.0 | 0.0 | GO:0007187 | G-protein coupled receptor signaling pathway, coupled to cyclic nucleotide second messenger(GO:0007187) adenylate cyclase-modulating G-protein coupled receptor signaling pathway(GO:0007188) |
| 0.0 | 0.0 | GO:0043693 | monoterpene biosynthetic process(GO:0043693) |
| 0.0 | 0.3 | GO:0009247 | glycolipid biosynthetic process(GO:0009247) |
| 0.0 | 0.0 | GO:1900457 | regulation of brassinosteroid mediated signaling pathway(GO:1900457) |
| 0.0 | 0.1 | GO:0009554 | megasporogenesis(GO:0009554) |
| 0.0 | 0.1 | GO:0048236 | plant-type spore development(GO:0048236) |
| 0.0 | 0.6 | GO:0006885 | regulation of pH(GO:0006885) |
| 0.0 | 0.2 | GO:0048496 | negative regulation of cell differentiation(GO:0045596) maintenance of organ identity(GO:0048496) maintenance of floral organ identity(GO:0048497) |
| 0.0 | 0.1 | GO:0000082 | G1/S transition of mitotic cell cycle(GO:0000082) |
| 0.0 | 0.4 | GO:2000022 | regulation of jasmonic acid mediated signaling pathway(GO:2000022) |
| 0.0 | 0.1 | GO:0034315 | regulation of Arp2/3 complex-mediated actin nucleation(GO:0034315) regulation of actin nucleation(GO:0051125) positive regulation of actin nucleation(GO:0051127) positive regulation of Arp2/3 complex-mediated actin nucleation(GO:2000601) |
| 0.0 | 0.3 | GO:0009251 | glucan catabolic process(GO:0009251) |
| 0.0 | 0.1 | GO:1990414 | replication-born double-strand break repair via sister chromatid exchange(GO:1990414) |
| 0.0 | 0.1 | GO:0097428 | protein maturation by iron-sulfur cluster transfer(GO:0097428) |
| 0.0 | 0.1 | GO:0001709 | cell fate determination(GO:0001709) |
| 0.0 | 0.1 | GO:2000031 | regulation of salicylic acid mediated signaling pathway(GO:2000031) |
| 0.0 | 0.0 | GO:0010198 | synergid death(GO:0010198) |
| 0.0 | 0.1 | GO:0010452 | histone H3-K36 methylation(GO:0010452) |
| 0.0 | 0.2 | GO:0060688 | regulation of morphogenesis of a branching structure(GO:0060688) regulation of secondary shoot formation(GO:2000032) |
Gene overrepresentation in cellular component category:
| Log-likelihood per target | Total log-likelihood | Term | Description |
|---|---|---|---|
| 0.2 | 0.2 | GO:0043673 | pollen wall(GO:0043667) exine(GO:0043668) sexine(GO:0043673) columella(GO:0043674) |
| 0.2 | 0.5 | GO:0005652 | nuclear lamina(GO:0005652) |
| 0.1 | 0.5 | GO:0033063 | Rad51B-Rad51C-Rad51D-XRCC2 complex(GO:0033063) |
| 0.1 | 0.5 | GO:0031205 | endoplasmic reticulum Sec complex(GO:0031205) |
| 0.1 | 0.2 | GO:0016328 | lateral plasma membrane(GO:0016328) |
| 0.1 | 0.3 | GO:1990124 | messenger ribonucleoprotein complex(GO:1990124) |
| 0.1 | 0.4 | GO:0043073 | germ cell nucleus(GO:0043073) |
| 0.0 | 0.1 | GO:0043240 | Fanconi anaemia nuclear complex(GO:0043240) |
| 0.0 | 0.2 | GO:0031356 | intrinsic component of plastid inner membrane(GO:0031352) integral component of plastid inner membrane(GO:0031353) intrinsic component of chloroplast inner membrane(GO:0031356) integral component of chloroplast inner membrane(GO:0031357) |
| 0.0 | 0.3 | GO:0031082 | BLOC complex(GO:0031082) BLOC-1 complex(GO:0031083) |
| 0.0 | 0.2 | GO:0071818 | BAT3 complex(GO:0071818) |
| 0.0 | 0.1 | GO:1990429 | Pex17p-Pex14p docking complex(GO:1990415) peroxisomal importomer complex(GO:1990429) |
| 0.0 | 0.1 | GO:0030874 | nucleolar chromatin(GO:0030874) |
| 0.0 | 0.1 | GO:0030870 | Mre11 complex(GO:0030870) |
| 0.0 | 0.1 | GO:0070505 | extracellular matrix component(GO:0044420) pollen coat(GO:0070505) |
| 0.0 | 0.2 | GO:0044665 | MLL1/2 complex(GO:0044665) MLL1 complex(GO:0071339) |
| 0.0 | 0.2 | GO:0030915 | Smc5-Smc6 complex(GO:0030915) |
| 0.0 | 0.3 | GO:0017119 | Golgi transport complex(GO:0017119) |
| 0.0 | 0.2 | GO:0046695 | SLIK (SAGA-like) complex(GO:0046695) |
| 0.0 | 0.1 | GO:0005675 | holo TFIIH complex(GO:0005675) carboxy-terminal domain protein kinase complex(GO:0032806) |
| 0.0 | 0.1 | GO:0002178 | palmitoyltransferase complex(GO:0002178) serine C-palmitoyltransferase complex(GO:0017059) endoplasmic reticulum palmitoyltransferase complex(GO:0031211) |
| 0.0 | 0.3 | GO:0016514 | SWI/SNF complex(GO:0016514) BAF-type complex(GO:0090544) |
| 0.0 | 0.2 | GO:0000439 | core TFIIH complex(GO:0000439) |
| 0.0 | 0.6 | GO:0016324 | apical plasma membrane(GO:0016324) |
| 0.0 | 0.2 | GO:0000813 | ESCRT I complex(GO:0000813) |
| 0.0 | 0.1 | GO:0044614 | nuclear pore cytoplasmic filaments(GO:0044614) |
| 0.0 | 0.3 | GO:0005801 | cis-Golgi network(GO:0005801) |
| 0.0 | 1.5 | GO:0019005 | SCF ubiquitin ligase complex(GO:0019005) |
| 0.0 | 0.1 | GO:0016363 | nuclear matrix(GO:0016363) |
| 0.0 | 0.1 | GO:0034045 | pre-autophagosomal structure membrane(GO:0034045) |
| 0.0 | 0.4 | GO:0000148 | 1,3-beta-D-glucan synthase complex(GO:0000148) |
| 0.0 | 0.2 | GO:0071014 | post-mRNA release spliceosomal complex(GO:0071014) |
| 0.0 | 0.1 | GO:0031379 | RNA-directed RNA polymerase complex(GO:0031379) nuclear RNA-directed RNA polymerase complex(GO:0031380) |
| 0.0 | 0.4 | GO:0012511 | monolayer-surrounded lipid storage body(GO:0012511) |
| 0.0 | 0.2 | GO:0098827 | endoplasmic reticulum tubular network(GO:0071782) endoplasmic reticulum subcompartment(GO:0098827) |
| 0.0 | 0.0 | GO:0012510 | trans-Golgi network transport vesicle membrane(GO:0012510) |
| 0.0 | 0.2 | GO:0030131 | clathrin adaptor complex(GO:0030131) |
| 0.0 | 0.2 | GO:0000109 | nucleotide-excision repair complex(GO:0000109) |
| 0.0 | 0.2 | GO:0032300 | mismatch repair complex(GO:0032300) |
| 0.0 | 0.1 | GO:0034657 | GID complex(GO:0034657) |
| 0.0 | 0.2 | GO:0048500 | signal recognition particle(GO:0048500) |
| 0.0 | 0.1 | GO:0005673 | transcription factor TFIIE complex(GO:0005673) |
| 0.0 | 0.1 | GO:0000922 | spindle pole(GO:0000922) |
| 0.0 | 0.2 | GO:0016602 | CCAAT-binding factor complex(GO:0016602) |
| 0.0 | 0.0 | GO:0031932 | TORC2 complex(GO:0031932) |
| 0.0 | 0.1 | GO:0034991 | nuclear cohesin complex(GO:0000798) mitotic cohesin complex(GO:0030892) meiotic cohesin complex(GO:0030893) nuclear mitotic cohesin complex(GO:0034990) nuclear meiotic cohesin complex(GO:0034991) |
| 0.0 | 0.2 | GO:0000178 | exosome (RNase complex)(GO:0000178) |
| 0.0 | 0.1 | GO:0030127 | COPII vesicle coat(GO:0030127) |
| 0.0 | 0.2 | GO:0005689 | U12-type spliceosomal complex(GO:0005689) |
| 0.0 | 0.0 | GO:0032044 | DSIF complex(GO:0032044) |
| 0.0 | 0.3 | GO:0005811 | lipid particle(GO:0005811) |
Gene overrepresentation in molecular function category:
| Log-likelihood per target | Total log-likelihood | Term | Description |
|---|---|---|---|
| 0.4 | 2.8 | GO:0004066 | asparagine synthase (glutamine-hydrolyzing) activity(GO:0004066) |
| 0.2 | 0.5 | GO:0052692 | alpha-galactosidase activity(GO:0004557) raffinose alpha-galactosidase activity(GO:0052692) |
| 0.2 | 0.5 | GO:0003995 | acyl-CoA dehydrogenase activity(GO:0003995) |
| 0.1 | 0.6 | GO:0004350 | glutamate 5-kinase activity(GO:0004349) glutamate-5-semialdehyde dehydrogenase activity(GO:0004350) |
| 0.1 | 0.6 | GO:0005432 | calcium:sodium antiporter activity(GO:0005432) |
| 0.1 | 0.4 | GO:0004476 | mannose-6-phosphate isomerase activity(GO:0004476) |
| 0.1 | 0.4 | GO:0051777 | ent-kaurenoate oxidase activity(GO:0051777) |
| 0.1 | 0.3 | GO:0052627 | 4-aminobenzoate amino acid synthetase activity(GO:0052625) benzoate amino acid synthetase activity(GO:0052626) vanillate amino acid synthetase activity(GO:0052627) 4-hydroxybenzoate amino acid synthetase activity(GO:0052628) |
| 0.1 | 0.3 | GO:0035605 | peptidyl-cysteine S-nitrosylase activity(GO:0035605) |
| 0.1 | 0.3 | GO:0008330 | protein tyrosine/threonine phosphatase activity(GO:0008330) |
| 0.1 | 0.3 | GO:0004353 | glutamate dehydrogenase [NAD(P)+] activity(GO:0004353) |
| 0.1 | 0.5 | GO:0005366 | myo-inositol:proton symporter activity(GO:0005366) |
| 0.1 | 0.4 | GO:0033549 | MAP kinase phosphatase activity(GO:0033549) |
| 0.1 | 0.5 | GO:0000150 | recombinase activity(GO:0000150) |
| 0.1 | 0.4 | GO:0016707 | gibberellin 3-beta-dioxygenase activity(GO:0016707) |
| 0.1 | 0.3 | GO:0052740 | phosphatidylserine 1-acylhydrolase activity(GO:0052739) 1-acyl-2-lysophosphatidylserine acylhydrolase activity(GO:0052740) |
| 0.1 | 0.2 | GO:0052629 | phosphatidylinositol-3-phosphatase activity(GO:0004438) phosphatidylinositol-3,5-bisphosphate 3-phosphatase activity(GO:0052629) |
| 0.1 | 0.5 | GO:0004848 | ureidoglycolate hydrolase activity(GO:0004848) |
| 0.1 | 0.2 | GO:0005046 | KDEL sequence binding(GO:0005046) |
| 0.1 | 0.3 | GO:0031516 | far-red light photoreceptor activity(GO:0031516) |
| 0.1 | 0.4 | GO:0030371 | translation repressor activity(GO:0030371) |
| 0.1 | 0.4 | GO:0000062 | fatty-acyl-CoA binding(GO:0000062) |
| 0.1 | 0.2 | GO:0045485 | omega-6 fatty acid desaturase activity(GO:0045485) |
| 0.1 | 0.7 | GO:0005086 | ARF guanyl-nucleotide exchange factor activity(GO:0005086) |
| 0.1 | 0.2 | GO:0015292 | uniporter activity(GO:0015292) |
| 0.1 | 0.4 | GO:0008970 | phosphatidylcholine 1-acylhydrolase activity(GO:0008970) |
| 0.1 | 0.1 | GO:0008821 | crossover junction endodeoxyribonuclease activity(GO:0008821) |
| 0.1 | 0.2 | GO:0010309 | acireductone dioxygenase [iron(II)-requiring] activity(GO:0010309) |
| 0.1 | 0.2 | GO:0047782 | coniferin beta-glucosidase activity(GO:0047782) |
| 0.1 | 0.6 | GO:0008453 | alanine-glyoxylate transaminase activity(GO:0008453) |
| 0.1 | 0.2 | GO:0004729 | oxygen-dependent protoporphyrinogen oxidase activity(GO:0004729) protoporphyrinogen oxidase activity(GO:0070818) |
| 0.1 | 0.2 | GO:0016979 | lipoate-protein ligase activity(GO:0016979) lipoate synthase activity(GO:0016992) |
| 0.1 | 0.3 | GO:0070547 | L-tyrosine:2-oxoglutarate aminotransferase activity(GO:0004838) L-tyrosine aminotransferase activity(GO:0070547) |
| 0.0 | 0.2 | GO:0047158 | sinapoylglucose-sinapoylglucose O-sinapoyltransferase activity(GO:0047158) |
| 0.0 | 0.1 | GO:0004140 | dephospho-CoA kinase activity(GO:0004140) |
| 0.0 | 0.1 | GO:0051377 | mannose-ethanolamine phosphotransferase activity(GO:0051377) |
| 0.0 | 0.1 | GO:0046027 | phospholipid:diacylglycerol acyltransferase activity(GO:0046027) |
| 0.0 | 0.3 | GO:0010178 | IAA-amino acid conjugate hydrolase activity(GO:0010178) |
| 0.0 | 0.7 | GO:0003825 | alpha,alpha-trehalose-phosphate synthase (UDP-forming) activity(GO:0003825) |
| 0.0 | 0.3 | GO:0010328 | auxin influx transmembrane transporter activity(GO:0010328) |
| 0.0 | 0.1 | GO:0000386 | second spliceosomal transesterification activity(GO:0000386) |
| 0.0 | 0.3 | GO:0052654 | L-leucine transaminase activity(GO:0052654) L-valine transaminase activity(GO:0052655) L-isoleucine transaminase activity(GO:0052656) |
| 0.0 | 0.2 | GO:0017057 | 6-phosphogluconolactonase activity(GO:0017057) |
| 0.0 | 0.3 | GO:0045543 | gibberellin 2-beta-dioxygenase activity(GO:0045543) C-19 gibberellin 2-beta-dioxygenase activity(GO:0052634) |
| 0.0 | 0.9 | GO:0080032 | methyl salicylate esterase activity(GO:0080031) methyl jasmonate esterase activity(GO:0080032) |
| 0.0 | 1.5 | GO:0015385 | sodium:proton antiporter activity(GO:0015385) |
| 0.0 | 0.2 | GO:0004096 | catalase activity(GO:0004096) |
| 0.0 | 0.1 | GO:0080104 | 3-methylthiopropyl glucosinolate S-oxygenase activity(GO:0080102) 5-methylthiopropyl glucosinolate S-oxygenase activity(GO:0080104) 7-methylthiopropyl glucosinolate S-oxygenase activity(GO:0080106) |
| 0.0 | 0.1 | GO:0030620 | U2 snRNA binding(GO:0030620) pre-mRNA intronic binding(GO:0097157) |
| 0.0 | 0.2 | GO:0005313 | L-glutamate transmembrane transporter activity(GO:0005313) |
| 0.0 | 0.2 | GO:0046509 | 1,2-diacylglycerol 3-beta-galactosyltransferase activity(GO:0046509) |
| 0.0 | 0.2 | GO:0004129 | cytochrome-c oxidase activity(GO:0004129) heme-copper terminal oxidase activity(GO:0015002) oxidoreductase activity, acting on a heme group of donors(GO:0016675) oxidoreductase activity, acting on a heme group of donors, oxygen as acceptor(GO:0016676) |
| 0.0 | 0.1 | GO:0005094 | Rho GDP-dissociation inhibitor activity(GO:0005094) |
| 0.0 | 0.2 | GO:0004849 | uridine kinase activity(GO:0004849) |
| 0.0 | 0.2 | GO:0031177 | phosphopantetheine binding(GO:0031177) |
| 0.0 | 0.2 | GO:0008184 | glycogen phosphorylase activity(GO:0008184) |
| 0.0 | 0.3 | GO:0016161 | beta-amylase activity(GO:0016161) |
| 0.0 | 0.1 | GO:0047215 | indole-3-acetate beta-glucosyltransferase activity(GO:0047215) UDP-glucose:4-aminobenzoate acylglucosyltransferase activity(GO:0080002) |
| 0.0 | 0.1 | GO:1990841 | promoter-specific chromatin binding(GO:1990841) |
| 0.0 | 0.5 | GO:0015145 | monosaccharide transmembrane transporter activity(GO:0015145) |
| 0.0 | 0.1 | GO:0002151 | G-quadruplex RNA binding(GO:0002151) |
| 0.0 | 0.1 | GO:0004156 | 2-amino-4-hydroxy-6-hydroxymethyldihydropteridine diphosphokinase activity(GO:0003848) dihydropteroate synthase activity(GO:0004156) |
| 0.0 | 0.2 | GO:0019139 | cytokinin dehydrogenase activity(GO:0019139) |
| 0.0 | 1.3 | GO:0000156 | phosphorelay response regulator activity(GO:0000156) |
| 0.0 | 0.2 | GO:0016629 | 12-oxophytodienoate reductase activity(GO:0016629) |
| 0.0 | 0.1 | GO:0019156 | isoamylase activity(GO:0019156) |
| 0.0 | 0.2 | GO:0030332 | cyclin binding(GO:0030332) |
| 0.0 | 0.2 | GO:0010279 | indole-3-acetic acid amido synthetase activity(GO:0010279) |
| 0.0 | 0.1 | GO:0010331 | gibberellin binding(GO:0010331) |
| 0.0 | 0.2 | GO:0098599 | palmitoyl hydrolase activity(GO:0098599) |
| 0.0 | 0.1 | GO:0050736 | O-malonyltransferase activity(GO:0050736) |
| 0.0 | 0.2 | GO:0008239 | dipeptidyl-peptidase activity(GO:0008239) |
| 0.0 | 0.2 | GO:0018685 | alkane 1-monooxygenase activity(GO:0018685) |
| 0.0 | 0.5 | GO:0005199 | structural constituent of cell wall(GO:0005199) |
| 0.0 | 0.1 | GO:0070259 | tyrosyl-DNA phosphodiesterase activity(GO:0070259) |
| 0.0 | 0.2 | GO:0017080 | ion channel inhibitor activity(GO:0008200) channel inhibitor activity(GO:0016248) sodium channel regulator activity(GO:0017080) sodium channel inhibitor activity(GO:0019871) |
| 0.0 | 0.1 | GO:0004046 | aminoacylase activity(GO:0004046) |
| 0.0 | 0.1 | GO:0016768 | spermine synthase activity(GO:0016768) |
| 0.0 | 0.4 | GO:0004525 | ribonuclease III activity(GO:0004525) double-stranded RNA-specific ribonuclease activity(GO:0032296) |
| 0.0 | 0.1 | GO:0016649 | electron-transferring-flavoprotein dehydrogenase activity(GO:0004174) oxidoreductase activity, acting on the CH-NH group of donors, quinone or similar compound as acceptor(GO:0016649) |
| 0.0 | 0.1 | GO:0042392 | sphingosine-1-phosphate phosphatase activity(GO:0042392) lipid phosphatase activity(GO:0042577) |
| 0.0 | 0.4 | GO:0016645 | oxidoreductase activity, acting on the CH-NH group of donors(GO:0016645) |
| 0.0 | 0.2 | GO:0004806 | triglyceride lipase activity(GO:0004806) |
| 0.0 | 0.1 | GO:0033764 | steroid dehydrogenase activity, acting on the CH-OH group of donors, NAD or NADP as acceptor(GO:0033764) |
| 0.0 | 0.4 | GO:0016861 | intramolecular oxidoreductase activity, interconverting aldoses and ketoses(GO:0016861) |
| 0.0 | 6.4 | GO:0000977 | RNA polymerase II regulatory region sequence-specific DNA binding(GO:0000977) RNA polymerase II regulatory region DNA binding(GO:0001012) |
| 0.0 | 0.2 | GO:0010011 | auxin binding(GO:0010011) |
| 0.0 | 0.1 | GO:0031219 | levanase activity(GO:0031219) fructan beta-fructosidase activity(GO:0051669) |
| 0.0 | 0.2 | GO:0001085 | RNA polymerase II transcription factor binding(GO:0001085) |
| 0.0 | 0.2 | GO:0046975 | histone methyltransferase activity (H3-K36 specific)(GO:0046975) |
| 0.0 | 0.1 | GO:0035671 | enone reductase activity(GO:0035671) |
| 0.0 | 0.2 | GO:0033613 | activating transcription factor binding(GO:0033613) |
| 0.0 | 0.1 | GO:0015186 | L-glutamine transmembrane transporter activity(GO:0015186) |
| 0.0 | 0.1 | GO:0004737 | pyruvate decarboxylase activity(GO:0004737) |
| 0.0 | 0.4 | GO:0030983 | mismatched DNA binding(GO:0030983) |
| 0.0 | 0.1 | GO:0000179 | rRNA (adenine-N6,N6-)-dimethyltransferase activity(GO:0000179) |
| 0.0 | 0.1 | GO:0015152 | hexose phosphate transmembrane transporter activity(GO:0015119) glucose-6-phosphate transmembrane transporter activity(GO:0015152) |
| 0.0 | 0.1 | GO:0004326 | tetrahydrofolylpolyglutamate synthase activity(GO:0004326) |
| 0.0 | 0.2 | GO:0010436 | carotenoid dioxygenase activity(GO:0010436) |
| 0.0 | 0.1 | GO:0061575 | cyclin-dependent protein serine/threonine kinase activator activity(GO:0061575) |
| 0.0 | 0.1 | GO:0005093 | Rab GDP-dissociation inhibitor activity(GO:0005093) |
| 0.0 | 0.2 | GO:0000990 | transcription factor activity, core RNA polymerase binding(GO:0000990) |
| 0.0 | 0.1 | GO:0080025 | phosphatidylinositol-3,5-bisphosphate binding(GO:0080025) |
| 0.0 | 0.3 | GO:0005375 | copper ion transmembrane transporter activity(GO:0005375) |
| 0.0 | 0.2 | GO:1904680 | oligopeptide transmembrane transporter activity(GO:0035673) peptide transmembrane transporter activity(GO:1904680) |
| 0.0 | 0.4 | GO:0003843 | 1,3-beta-D-glucan synthase activity(GO:0003843) |
| 0.0 | 0.4 | GO:0010333 | terpene synthase activity(GO:0010333) |
| 0.0 | 0.1 | GO:0008798 | beta-aspartyl-peptidase activity(GO:0008798) |
| 0.0 | 0.1 | GO:0015203 | polyamine transmembrane transporter activity(GO:0015203) |
| 0.0 | 0.1 | GO:0004014 | adenosylmethionine decarboxylase activity(GO:0004014) |
| 0.0 | 0.1 | GO:0003968 | RNA-directed RNA polymerase activity(GO:0003968) |
| 0.0 | 0.1 | GO:0016454 | serine C-palmitoyltransferase activity(GO:0004758) C-palmitoyltransferase activity(GO:0016454) |
| 0.0 | 0.3 | GO:0005381 | iron ion transmembrane transporter activity(GO:0005381) |
| 0.0 | 0.2 | GO:0016308 | 1-phosphatidylinositol-4-phosphate 5-kinase activity(GO:0016308) |
| 0.0 | 0.1 | GO:0050017 | L-3-cyanoalanine synthase activity(GO:0050017) |
| 0.0 | 0.2 | GO:0052742 | phosphatidylinositol kinase activity(GO:0052742) |
| 0.0 | 0.2 | GO:0051747 | cytosine C-5 DNA demethylase activity(GO:0051747) |
| 0.0 | 0.1 | GO:0015271 | outward rectifier potassium channel activity(GO:0015271) |
| 0.0 | 0.1 | GO:0004617 | phosphoglycerate dehydrogenase activity(GO:0004617) |
| 0.0 | 0.1 | GO:0008506 | sucrose:proton symporter activity(GO:0008506) |
| 0.0 | 0.1 | GO:0030544 | Hsp70 protein binding(GO:0030544) |
| 0.0 | 0.1 | GO:0001159 | core promoter proximal region sequence-specific DNA binding(GO:0000987) core promoter proximal region DNA binding(GO:0001159) |
| 0.0 | 0.4 | GO:0031490 | chromatin DNA binding(GO:0031490) |
| 0.0 | 0.0 | GO:0042800 | histone methyltransferase activity (H3-K4 specific)(GO:0042800) |
| 0.0 | 0.7 | GO:0004523 | RNA-DNA hybrid ribonuclease activity(GO:0004523) |
| 0.0 | 0.1 | GO:0004679 | AMP-activated protein kinase activity(GO:0004679) |
| 0.0 | 0.1 | GO:0008253 | 5'-nucleotidase activity(GO:0008253) |
| 0.0 | 0.2 | GO:0004575 | sucrose alpha-glucosidase activity(GO:0004575) |
| 0.0 | 0.1 | GO:0003691 | double-stranded telomeric DNA binding(GO:0003691) |
| 0.0 | 0.1 | GO:0050113 | inositol oxygenase activity(GO:0050113) |
| 0.0 | 0.0 | GO:0004645 | phosphorylase activity(GO:0004645) |
| 0.0 | 0.1 | GO:0004869 | cysteine-type endopeptidase inhibitor activity(GO:0004869) |
| 0.0 | 0.1 | GO:0036456 | L-methionine:thioredoxin-disulfide S-oxidoreductase activity(GO:0033744) L-methionine-(S)-S-oxide reductase activity(GO:0036456) |
| 0.0 | 0.1 | GO:1990269 | phosphoserine binding(GO:0050815) RNA polymerase II C-terminal domain phosphoserine binding(GO:1990269) |
| 0.0 | 0.1 | GO:0008251 | adenosine deaminase activity(GO:0004000) tRNA-specific adenosine deaminase activity(GO:0008251) |
| 0.0 | 0.1 | GO:0015210 | pyrimidine nucleobase transmembrane transporter activity(GO:0005350) uracil transmembrane transporter activity(GO:0015210) |
| 0.0 | 0.0 | GO:0043995 | histone acetyltransferase activity (H4-K5 specific)(GO:0043995) |
| 0.0 | 0.0 | GO:0016165 | linoleate 13S-lipoxygenase activity(GO:0016165) |
| 0.0 | 0.3 | GO:0031624 | ubiquitin conjugating enzyme binding(GO:0031624) |
| 0.0 | 0.4 | GO:0003714 | transcription corepressor activity(GO:0003714) |
| 0.0 | 0.0 | GO:0004861 | cyclin-dependent protein serine/threonine kinase inhibitor activity(GO:0004861) protein serine/threonine kinase inhibitor activity(GO:0030291) |
| 0.0 | 0.2 | GO:0015020 | glucuronosyltransferase activity(GO:0015020) |
| 0.0 | 0.1 | GO:0034237 | protein kinase A regulatory subunit binding(GO:0034237) protein kinase A binding(GO:0051018) Arp2/3 complex binding(GO:0071933) |
| 0.0 | 0.1 | GO:0004142 | diacylglycerol cholinephosphotransferase activity(GO:0004142) |
| 0.0 | 0.2 | GO:0031420 | pyruvate kinase activity(GO:0004743) potassium ion binding(GO:0030955) alkali metal ion binding(GO:0031420) |
| 0.0 | 0.1 | GO:0004416 | hydroxyacylglutathione hydrolase activity(GO:0004416) |
| 0.0 | 0.0 | GO:0015081 | sodium ion transmembrane transporter activity(GO:0015081) |
Gene overrepresentation in curated gene sets: canonical pathways category:
| Log-likelihood per target | Total log-likelihood | Term | Description |
|---|---|---|---|
| 0.0 | 0.1 | PID TAP63 PATHWAY | Validated transcriptional targets of TAp63 isoforms |
| 0.0 | 0.2 | PID SMAD2 3NUCLEAR PATHWAY | Regulation of nuclear SMAD2/3 signaling |
| 0.0 | 0.3 | PID CXCR4 PATHWAY | CXCR4-mediated signaling events |
| 0.0 | 0.1 | PID PI3KCI PATHWAY | Class I PI3K signaling events |
| 0.0 | 0.2 | PID AP1 PATHWAY | AP-1 transcription factor network |
| 0.0 | 0.1 | PID AVB3 OPN PATHWAY | Osteopontin-mediated events |
| 0.0 | 0.0 | ST INTEGRIN SIGNALING PATHWAY | Integrin Signaling Pathway |
Gene overrepresentation in curated gene sets: REACTOME pathways category:
| Log-likelihood per target | Total log-likelihood | Term | Description |
|---|---|---|---|
| 0.1 | 0.3 | REACTOME FORMATION OF TUBULIN FOLDING INTERMEDIATES BY CCT TRIC | Genes involved in Formation of tubulin folding intermediates by CCT/TriC |
| 0.1 | 0.3 | REACTOME GASTRIN CREB SIGNALLING PATHWAY VIA PKC AND MAPK | Genes involved in Gastrin-CREB signalling pathway via PKC and MAPK |
| 0.1 | 0.3 | REACTOME METABOLISM OF NUCLEOTIDES | Genes involved in Metabolism of nucleotides |
| 0.1 | 0.2 | REACTOME TRANSCRIPTIONAL ACTIVITY OF SMAD2 SMAD3 SMAD4 HETEROTRIMER | Genes involved in Transcriptional activity of SMAD2/SMAD3:SMAD4 heterotrimer |
| 0.0 | 0.1 | REACTOME GOLGI ASSOCIATED VESICLE BIOGENESIS | Genes involved in Golgi Associated Vesicle Biogenesis |
| 0.0 | 0.4 | REACTOME METABOLISM OF AMINO ACIDS AND DERIVATIVES | Genes involved in Metabolism of amino acids and derivatives |
| 0.0 | 0.2 | REACTOME PI METABOLISM | Genes involved in PI Metabolism |
| 0.0 | 0.1 | REACTOME G2 M DNA DAMAGE CHECKPOINT | Genes involved in G2/M DNA damage checkpoint |
| 0.0 | 0.5 | REACTOME FACTORS INVOLVED IN MEGAKARYOCYTE DEVELOPMENT AND PLATELET PRODUCTION | Genes involved in Factors involved in megakaryocyte development and platelet production |
| 0.0 | 0.1 | REACTOME G0 AND EARLY G1 | Genes involved in G0 and Early G1 |
| 0.0 | 0.0 | REACTOME NRAGE SIGNALS DEATH THROUGH JNK | Genes involved in NRAGE signals death through JNK |
| 0.0 | 0.1 | REACTOME TRANSCRIPTIONAL REGULATION OF WHITE ADIPOCYTE DIFFERENTIATION | Genes involved in Transcriptional Regulation of White Adipocyte Differentiation |
| 0.0 | 0.1 | REACTOME L1CAM INTERACTIONS | Genes involved in L1CAM interactions |
| 0.0 | 0.0 | REACTOME MRNA DECAY BY 5 TO 3 EXORIBONUCLEASE | Genes involved in mRNA Decay by 5' to 3' Exoribonuclease |
| 0.0 | 0.1 | REACTOME SIGNALING BY PDGF | Genes involved in Signaling by PDGF |
| 0.0 | 0.0 | REACTOME GENERIC TRANSCRIPTION PATHWAY | Genes involved in Generic Transcription Pathway |