Project
GSE130291:vernalization in Arabidopsis thaliana
Navigation
Downloads
Results for AT2G18060
Z-value: 0.75
Transcription factors associated with AT2G18060
| Gene Symbol | Gene ID | Gene Info |
|---|---|---|
|
AT2G18060
|
AT2G18060 | vascular related NAC-domain protein 1 |
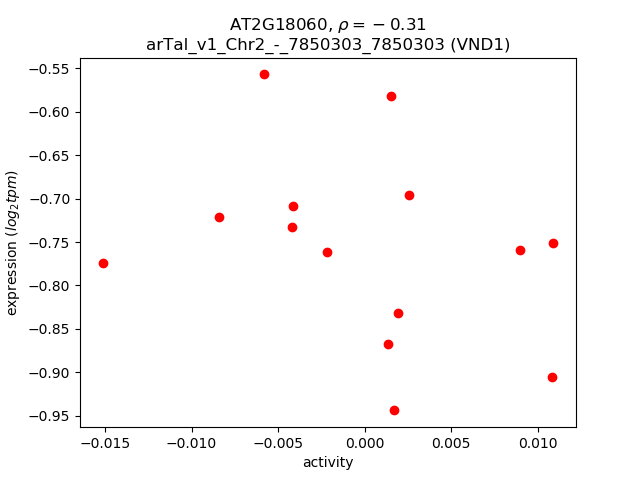
Activity-expression correlation:
| Gene | Promoter | Pearson corr. coef. | P-value | Plot |
|---|---|---|---|---|
| VND1 | arTal_v1_Chr2_-_7850303_7850303 | -0.31 | 2.8e-01 | Click! |
Activity profile of AT2G18060 motif
Sorted Z-values of AT2G18060 motif
| Promoter | Log-likelihood | Transcript | Gene | Gene Info |
|---|---|---|---|---|
| arTal_v1_Chr4_-_13016235_13016235 | 1.40 |
AT4G25470.1
|
CBF2
|
C-repeat/DRE binding factor 2 |
| arTal_v1_Chr5_+_21240717_21240717 | 1.11 |
AT5G52310.1
|
LTI78
|
low-temperature-responsive protein 78 (LTI78) / desiccation-responsive protein 29A (RD29A) |
| arTal_v1_Chr4_-_15954803_15954803 | 1.07 |
AT4G33070.1
|
AT4G33070
|
Thiamine pyrophosphate dependent pyruvate decarboxylase family protein |
| arTal_v1_Chr1_-_10164452_10164452 | 1.06 |
AT1G29090.1
|
AT1G29090
|
Cysteine proteinases superfamily protein |
| arTal_v1_Chr5_-_17199793_17199910 | 0.98 |
AT5G42900.1
AT5G42900.3 AT5G42900.2 |
COR27
|
cold regulated protein 27 |
| arTal_v1_Chr4_+_15451988_15451988 | 0.93 |
AT4G31940.1
|
CYP82C4
|
cytochrome P450, family 82, subfamily C, polypeptide 4 |
| arTal_v1_Chr4_+_14954204_14954204 | 0.93 |
AT4G30650.1
|
AT4G30650
|
Low temperature and salt responsive protein family |
| arTal_v1_Chr1_+_5872024_5872024 | 0.89 |
AT1G17180.1
|
GSTU25
|
glutathione S-transferase TAU 25 |
| arTal_v1_Chr1_-_9275193_9275193 | 0.88 |
AT1G26790.1
|
AT1G26790
|
Dof-type zinc finger DNA-binding family protein |
| arTal_v1_Chr1_+_23168767_23168767 | 0.80 |
AT1G62570.1
|
FMO GS-OX4
|
flavin-monooxygenase glucosinolate S-oxygenase 4 |
| arTal_v1_Chr5_-_7054281_7054281 | 0.79 |
AT5G20830.3
|
SUS1
|
sucrose synthase 1 |
| arTal_v1_Chr4_+_8827600_8827710 | 0.78 |
AT4G15430.2
AT4G15430.1 |
AT4G15430
|
ERD (early-responsive to dehydration stress) family protein |
| arTal_v1_Chr5_-_7054713_7054713 | 0.78 |
AT5G20830.1
|
SUS1
|
sucrose synthase 1 |
| arTal_v1_Chr5_-_7055398_7055398 | 0.78 |
AT5G20830.2
|
SUS1
|
sucrose synthase 1 |
| arTal_v1_Chr2_+_6950041_6950041 | 0.77 |
AT2G15970.2
|
COR413-PM1
|
cold regulated 413 plasma membrane 1 |
| arTal_v1_Chr2_+_6949851_6949851 | 0.77 |
AT2G15970.1
|
COR413-PM1
|
cold regulated 413 plasma membrane 1 |
| arTal_v1_Chr2_+_6893949_6893949 | 0.76 |
AT2G15830.1
|
AT2G15830
|
hypothetical protein |
| arTal_v1_Chr1_-_1248826_1248876 | 0.75 |
AT1G04570.2
AT1G04570.1 |
AT1G04570
|
Major facilitator superfamily protein |
| arTal_v1_Chr5_-_5692920_5692992 | 0.72 |
AT5G17300.2
AT5G17300.1 |
RVE1
|
Homeodomain-like superfamily protein |
| arTal_v1_Chr5_-_18189523_18189523 | 0.72 |
AT5G45070.1
|
PP2-A8
|
phloem protein 2-A8 |
| arTal_v1_Chr3_+_3595694_3595694 | 0.71 |
AT3G11430.1
|
GPAT5
|
glycerol-3-phosphate acyltransferase 5 |
| arTal_v1_Chr1_-_22363854_22363854 | 0.70 |
AT1G60750.1
|
AT1G60750
|
NAD(P)-linked oxidoreductase superfamily protein |
| arTal_v1_Chr4_-_16644928_16644928 | 0.69 |
AT4G34950.1
|
AT4G34950
|
Major facilitator superfamily protein |
| arTal_v1_Chr2_+_19151481_19151481 | 0.68 |
AT2G46650.1
|
CB5-C
|
cytochrome B5 isoform C |
| arTal_v1_Chr3_-_1756924_1756924 | 0.67 |
AT3G05880.1
|
RCI2A
|
Low temperature and salt responsive protein family |
| arTal_v1_Chr1_+_22198266_22198266 | 0.66 |
AT1G60190.1
|
PUB19
|
ARM repeat superfamily protein |
| arTal_v1_Chr2_-_14489767_14489767 | 0.66 |
AT2G34340.1
|
AT2G34340
|
senescence regulator (Protein of unknown function, DUF584) |
| arTal_v1_Chr5_-_19977620_19977620 | 0.65 |
AT5G49280.1
|
AT5G49280
|
hydroxyproline-rich glycoprotein family protein |
| arTal_v1_Chr1_-_22871298_22871358 | 0.65 |
AT1G61890.3
AT1G61890.1 AT1G61890.2 |
AT1G61890
|
MATE efflux family protein |
| arTal_v1_Chr5_-_6547127_6547177 | 0.65 |
AT5G19410.1
AT5G19410.2 |
ABCG23
|
ABC-2 type transporter family protein |
| arTal_v1_Chr1_+_1425539_1425539 | 0.64 |
AT1G05000.3
AT1G05000.1 AT1G05000.2 |
PFA-DSP1
|
Phosphotyrosine protein phosphatases superfamily protein |
| arTal_v1_Chr3_-_8085669_8085669 | 0.64 |
AT3G22840.1
|
ELIP1
|
Chlorophyll A-B binding family protein |
| arTal_v1_Chr4_-_14542565_14542565 | 0.63 |
AT4G29690.1
|
AT4G29690
|
Alkaline-phosphatase-like family protein |
| arTal_v1_Chr2_-_968048_968048 | 0.63 |
AT2G03200.1
|
AT2G03200
|
Eukaryotic aspartyl protease family protein |
| arTal_v1_Chr1_-_507268_507268 | 0.61 |
AT1G02460.1
|
AT1G02460
|
Pectin lyase-like superfamily protein |
| arTal_v1_Chr4_+_10521259_10521379 | 0.61 |
AT4G19230.1
AT4G19230.2 |
CYP707A1
|
cytochrome P450, family 707, subfamily A, polypeptide 1 |
| arTal_v1_Chr5_+_16161449_16161449 | 0.61 |
AT5G40390.1
|
SIP1
|
Raffinose synthase family protein |
| arTal_v1_Chr5_+_23701392_23701392 | 0.60 |
AT5G58660.1
AT5G58660.2 |
AT5G58660
|
2-oxoglutarate (2OG) and Fe(II)-dependent oxygenase superfamily protein |
| arTal_v1_Chr2_+_11012499_11012499 | 0.60 |
AT2G25810.1
|
TIP4%3B1
|
tonoplast intrinsic protein 4;1 |
| arTal_v1_Chr1_+_4342209_4342282 | 0.60 |
AT1G12740.1
AT1G12740.2 AT1G12740.3 AT1G12740.4 |
CYP87A2
|
cytochrome P450, family 87, subfamily A, polypeptide 2 |
| arTal_v1_Chr2_-_15036556_15036556 | 0.59 |
AT2G35770.1
|
scpl28
|
serine carboxypeptidase-like 28 |
| arTal_v1_Chr3_+_19845097_19845172 | 0.58 |
AT3G53530.2
AT3G53530.1 |
NAKR3
|
Chloroplast-targeted copper chaperone protein |
| arTal_v1_Chr5_+_22808641_22808641 | 0.58 |
AT5G56320.2
AT5G56320.1 AT5G56320.3 |
EXPA14
|
expansin A14 |
| arTal_v1_Chr5_-_16252434_16252434 | 0.57 |
AT5G40590.1
|
AT5G40590
|
Cysteine/Histidine-rich C1 domain family protein |
| arTal_v1_Chr4_-_9779939_9779939 | 0.57 |
AT4G17550.1
|
G3Pp4
|
Major facilitator superfamily protein |
| arTal_v1_Chr5_+_20427749_20427749 | 0.56 |
AT5G50175.1
|
AT5G50175
|
transmembrane protein |
| arTal_v1_Chr1_-_3029549_3029549 | 0.56 |
AT1G09380.1
|
UMAMIT25
|
nodulin MtN21 /EamA-like transporter family protein |
| arTal_v1_Chr1_-_37757_37871 | 0.55 |
AT1G01060.3
AT1G01060.2 AT1G01060.4 AT1G01060.1 AT1G01060.6 AT1G01060.7 AT1G01060.5 |
LHY
|
Homeodomain-like superfamily protein |
| arTal_v1_Chr2_+_12706627_12706627 | 0.55 |
AT2G29740.1
|
UGT71C2
|
UDP-glucosyl transferase 71C2 |
| arTal_v1_Chr5_+_880148_880148 | 0.55 |
AT5G03510.1
|
AT5G03510
|
C2H2-type zinc finger family protein |
| arTal_v1_Chr4_-_6718550_6718550 | 0.55 |
AT4G10960.1
|
UGE5
|
UDP-D-glucose/UDP-D-galactose 4-epimerase 5 |
| arTal_v1_Chr3_-_2569700_2569700 | 0.55 |
AT3G08040.2
AT3G08040.1 |
FRD3
|
MATE efflux family protein |
| arTal_v1_Chr1_-_30173109_30173109 | 0.55 |
AT1G80240.1
|
DGR1
|
choice-of-anchor C domain protein, putative (Protein of unknown function, DUF642) |
| arTal_v1_Chr3_+_4408925_4408925 | 0.54 |
AT3G13520.1
|
AGP12
|
arabinogalactan protein 12 |
| arTal_v1_Chr3_-_23046153_23046153 | 0.54 |
AT3G62270.1
|
AT3G62270
|
HCO3- transporter family |
| arTal_v1_Chr5_-_17943283_17943283 | 0.53 |
AT5G44550.1
|
AT5G44550
|
Uncharacterized protein family (UPF0497) |
| arTal_v1_Chr3_+_5535124_5535124 | 0.53 |
AT3G16330.1
|
AT3G16330
|
Avr9/Cf-9 rapidly elicited protein |
| arTal_v1_Chr3_+_22935510_22935510 | 0.52 |
AT3G61930.1
|
AT3G61930
|
hypothetical protein |
| arTal_v1_Chr3_-_20816035_20816035 | 0.52 |
AT3G56090.1
|
FER3
|
ferritin 3 |
| arTal_v1_Chr5_-_17421982_17421982 | 0.52 |
AT5G43380.1
AT5G43380.2 AT5G43380.3 |
TOPP6
|
type one serine/threonine protein phosphatase 6 |
| arTal_v1_Chr1_+_4105223_4105223 | 0.52 |
AT1G12110.1
|
NRT1.1
|
nitrate transporter 1.1 |
| arTal_v1_Chr3_+_5585872_5585944 | 0.52 |
AT3G16440.2
AT3G16440.1 |
MLP-300B
|
myrosinase-binding protein-like protein-300B |
| arTal_v1_Chr5_+_23400715_23400715 | 0.51 |
AT5G57760.1
|
AT5G57760
|
hypothetical protein |
| arTal_v1_Chr5_-_25254318_25254318 | 0.51 |
AT5G62920.1
|
ARR6
|
response regulator 6 |
| arTal_v1_Chr5_+_463073_463073 | 0.51 |
AT5G02260.1
|
EXPA9
|
expansin A9 |
| arTal_v1_Chr5_+_8151907_8151907 | 0.51 |
AT5G24105.1
|
AGP41
|
arabinogalactan protein 41 |
| arTal_v1_Chr1_+_18305445_18305445 | 0.51 |
AT1G49450.1
|
AT1G49450
|
Transducin/WD40 repeat-like superfamily protein |
| arTal_v1_Chr3_+_22298373_22298380 | 0.50 |
AT3G60330.2
AT3G60330.3 |
HA7
|
H[+]-ATPase 7 |
| arTal_v1_Chr3_+_22298549_22298578 | 0.50 |
AT3G60330.4
AT3G60330.1 |
HA7
|
H[+]-ATPase 7 |
| arTal_v1_Chr1_+_28561281_28561281 | 0.50 |
AT1G76130.1
|
AMY2
|
alpha-amylase-like 2 |
| arTal_v1_Chr3_+_18487130_18487130 | 0.50 |
AT3G49845.1
|
WIH3
|
cysteine-rich TM module stress tolerance protein |
| arTal_v1_Chr5_+_21811633_21811633 | 0.49 |
AT5G53740.1
|
AT5G53740
|
hypothetical protein |
| arTal_v1_Chr5_+_1746548_1746548 | 0.49 |
AT5G05810.1
|
ATL43
|
RING/U-box superfamily protein |
| arTal_v1_Chr2_-_16804823_16804823 | 0.49 |
AT2G40230.1
|
AT2G40230
|
HXXXD-type acyl-transferase family protein |
| arTal_v1_Chr5_+_4087689_4087689 | 0.49 |
AT5G12940.1
|
AT5G12940
|
Leucine-rich repeat (LRR) family protein |
| arTal_v1_Chr2_+_19437648_19437648 | 0.49 |
AT2G47360.1
|
AT2G47360
|
transmembrane protein |
| arTal_v1_Chr1_-_24433165_24433165 | 0.49 |
AT1G65690.1
|
AT1G65690
|
Late embryogenesis abundant (LEA) hydroxyproline-rich glycoprotein family |
| arTal_v1_Chr2_+_18537177_18537177 | 0.48 |
AT2G44940.1
|
AT2G44940
|
Integrase-type DNA-binding superfamily protein |
| arTal_v1_Chr3_+_18487411_18487411 | 0.48 |
AT3G49845.2
|
WIH3
|
cysteine-rich TM module stress tolerance protein |
| arTal_v1_Chr5_+_20151163_20151163 | 0.48 |
AT5G49640.1
|
AT5G49640
|
hypothetical protein |
| arTal_v1_Chr1_+_3093644_3093644 | 0.48 |
AT1G09560.1
|
GLP5
|
germin-like protein 5 |
| arTal_v1_Chr1_+_28560629_28560629 | 0.48 |
AT1G76130.2
|
AMY2
|
alpha-amylase-like 2 |
| arTal_v1_Chr4_+_12649985_12649987 | 0.48 |
AT4G24480.2
AT4G24480.1 AT4G24480.3 |
AT4G24480
|
Protein kinase superfamily protein |
| arTal_v1_Chr4_-_9250343_9250343 | 0.48 |
AT4G16370.1
|
OPT3
|
oligopeptide transporter |
| arTal_v1_Chr5_+_21943983_21943983 | 0.48 |
AT5G54070.1
|
HSFA9
|
heat shock transcription factor A9 |
| arTal_v1_Chr3_+_3203988_3203988 | 0.48 |
AT3G10340.1
|
PAL4
|
phenylalanine ammonia-lyase 4 |
| arTal_v1_Chr5_-_21483722_21483797 | 0.48 |
AT5G52980.2
AT5G52980.1 |
AT5G52980
|
ER-based factor for assembly of V-ATPase |
| arTal_v1_Chr3_-_11269228_11269356 | 0.48 |
AT3G29360.2
AT3G29360.1 |
UGD2
|
UDP-glucose 6-dehydrogenase family protein |
| arTal_v1_Chr5_-_2359311_2359311 | 0.47 |
AT5G07450.1
|
CYCP4%3B3
|
cyclin p4;3 |
| arTal_v1_Chr4_-_12295859_12295859 | 0.47 |
AT4G23560.1
|
GH9B15
|
glycosyl hydrolase 9B15 |
| arTal_v1_Chr4_+_16746525_16746525 | 0.46 |
AT4G35190.2
|
LOG5
|
Putative lysine decarboxylase family protein |
| arTal_v1_Chr4_+_12920742_12920742 | 0.46 |
AT4G25220.1
|
G3Pp2
|
root hair specific 15 |
| arTal_v1_Chr3_-_19629204_19629204 | 0.46 |
AT3G52930.1
|
FBA8
|
Aldolase superfamily protein |
| arTal_v1_Chr2_+_19253670_19253670 | 0.46 |
AT2G46860.1
|
PPa3
|
pyrophosphorylase 3 |
| arTal_v1_Chr1_-_22067076_22067076 | 0.46 |
AT1G59940.1
|
ARR3
|
response regulator 3 |
| arTal_v1_Chr3_-_4794417_4794417 | 0.46 |
AT3G14362.1
|
RTFL10
|
ROTUNDIFOLIA like 10 |
| arTal_v1_Chr1_+_2848149_2848149 | 0.45 |
AT1G08890.1
|
AT1G08890
|
Major facilitator superfamily protein |
| arTal_v1_Chr4_-_14740742_14740742 | 0.45 |
AT4G30140.1
|
CDEF1
|
GDSL-like Lipase/Acylhydrolase superfamily protein |
| arTal_v1_Chr5_-_7084859_7084859 | 0.45 |
AT5G20885.1
|
AT5G20885
|
RING/U-box superfamily protein |
| arTal_v1_Chr1_-_25885261_25885261 | 0.44 |
AT1G68850.1
|
AT1G68850
|
Peroxidase superfamily protein |
| arTal_v1_Chr5_+_19135952_19135952 | 0.44 |
AT5G47120.1
|
BI1
|
BAX inhibitor 1 |
| arTal_v1_Chr1_-_37230_37230 | 0.44 |
AT1G01060.8
|
LHY
|
Homeodomain-like superfamily protein |
| arTal_v1_Chr5_+_21771811_21771811 | 0.44 |
AT5G53590.1
|
AT5G53590
|
SAUR-like auxin-responsive protein family |
| arTal_v1_Chr1_-_22067233_22067233 | 0.43 |
AT1G59940.2
|
ARR3
|
response regulator 3 |
| arTal_v1_Chr3_-_20864594_20864727 | 0.43 |
AT3G56240.2
AT3G56240.1 AT3G56240.3 |
CCH
|
copper chaperone |
| arTal_v1_Chr3_-_7101637_7101637 | 0.43 |
AT3G20360.1
|
AT3G20360
|
TRAF-like family protein |
| arTal_v1_Chr1_+_19862821_19862821 | 0.43 |
AT1G53270.1
|
ABCG10
|
ABC-2 type transporter family protein |
| arTal_v1_Chr4_+_16746189_16746189 | 0.43 |
AT4G35190.1
|
LOG5
|
Putative lysine decarboxylase family protein |
| arTal_v1_Chr4_+_13275200_13275200 | 0.43 |
AT4G26200.1
|
ACS7
|
1-amino-cyclopropane-1-carboxylate synthase 7 |
| arTal_v1_Chr5_+_18875382_18875382 | 0.43 |
AT5G46530.1
|
AT5G46530
|
AWPM-19-like family protein |
| arTal_v1_Chr1_+_18205934_18205934 | 0.43 |
AT1G49220.1
|
AT1G49220
|
RING/U-box superfamily protein |
| arTal_v1_Chr1_+_2688880_2688880 | 0.42 |
AT1G08500.1
|
ENODL18
|
early nodulin-like protein 18 |
| arTal_v1_Chr5_+_8148544_8148544 | 0.42 |
AT5G24100.1
|
AT5G24100
|
Leucine-rich repeat protein kinase family protein |
| arTal_v1_Chr3_-_9464676_9464676 | 0.42 |
AT3G25870.1
|
AT3G25870
|
hypothetical protein |
| arTal_v1_Chr1_+_954290_954290 | 0.42 |
AT1G03790.1
|
SOM
|
Zinc finger C-x8-C-x5-C-x3-H type family protein |
| arTal_v1_Chr5_+_7426310_7426310 | 0.42 |
AT5G22410.1
|
RHS18
|
root hair specific 18 |
| arTal_v1_Chr3_-_4496800_4496800 | 0.42 |
AT3G13720.1
|
PRA8
|
PRA1 (Prenylated rab acceptor) family protein |
| arTal_v1_Chr2_-_12343443_12343443 | 0.41 |
AT2G28780.1
|
AT2G28780
|
P-hydroxybenzoic acid efflux pump subunit |
| arTal_v1_Chr1_+_25701770_25701770 | 0.41 |
AT1G68500.1
|
AT1G68500
|
hypothetical protein |
| arTal_v1_Chr4_-_14257965_14257965 | 0.41 |
AT4G28890.1
|
AT4G28890
|
RING/U-box superfamily protein |
| arTal_v1_Chr2_+_14892495_14892495 | 0.41 |
AT2G35380.2
AT2G35380.1 |
AT2G35380
|
Peroxidase superfamily protein |
| arTal_v1_Chr2_-_7757875_7757929 | 0.41 |
AT2G17840.2
AT2G17840.1 |
ERD7
|
Senescence/dehydration-associated protein-like protein |
| arTal_v1_Chr1_-_20976372_20976372 | 0.41 |
AT1G56080.1
|
AT1G56080
|
interactor of constitutive active ROPs protein |
| arTal_v1_Chr5_+_9107944_9107944 | 0.41 |
AT5G26080.1
|
AT5G26080
|
proline-rich family protein |
| arTal_v1_Chr1_+_9259750_9259750 | 0.41 |
AT1G26770.2
|
EXPA10
|
expansin A10 |
| arTal_v1_Chr4_-_12533924_12533924 | 0.40 |
AT4G24140.1
|
AT4G24140
|
alpha/beta-Hydrolases superfamily protein |
| arTal_v1_Chr1_+_12261165_12261165 | 0.40 |
AT1G33800.1
|
GXMT1
|
glucuronoxylan 4-O-methyltransferase-like protein (DUF579) |
| arTal_v1_Chr1_-_10553295_10553295 | 0.40 |
AT1G30080.1
AT1G30080.2 |
AT1G30080
|
Glycosyl hydrolase superfamily protein |
| arTal_v1_Chr5_-_25866972_25867025 | 0.40 |
AT5G64700.2
AT5G64700.1 |
UMAMIT21
|
nodulin MtN21 /EamA-like transporter family protein |
| arTal_v1_Chr3_+_16137576_16137576 | 0.40 |
AT3G44550.1
|
FAR5
|
fatty acid reductase 5 |
| arTal_v1_Chr5_-_2655732_2655870 | 0.40 |
AT5G08250.1
AT5G08250.2 |
AT5G08250
|
Cytochrome P450 superfamily protein |
| arTal_v1_Chr1_+_29354944_29354944 | 0.40 |
AT1G78070.1
|
AT1G78070
|
Transducin/WD40 repeat-like superfamily protein |
| arTal_v1_Chr4_-_18581696_18581696 | 0.40 |
AT4G40090.1
|
AGP3
|
arabinogalactan protein 3 |
| arTal_v1_Chr3_+_17465510_17465510 | 0.40 |
AT3G47400.1
|
AT3G47400
|
Plant invertase/pectin methylesterase inhibitor superfamily |
| arTal_v1_Chr5_-_5310951_5310951 | 0.39 |
AT5G16250.1
|
AT5G16250
|
transmembrane protein |
| arTal_v1_Chr1_+_9259432_9259432 | 0.39 |
AT1G26770.1
|
EXPA10
|
expansin A10 |
| arTal_v1_Chr5_+_16431304_16431391 | 0.39 |
AT5G41040.1
AT5G41040.2 |
RWP1
|
HXXXD-type acyl-transferase family protein |
| arTal_v1_Chr5_-_6968033_6968033 | 0.39 |
AT5G20600.1
|
AT5G20600
|
ribosomal RNA processing-like protein |
| arTal_v1_Chr5_+_25550937_25550937 | 0.39 |
AT5G63850.1
|
AAP4
|
amino acid permease 4 |
| arTal_v1_Chr4_-_11965684_11965769 | 0.39 |
AT4G22770.2
AT4G22770.1 |
AT4G22770
|
AT hook motif DNA-binding family protein |
| arTal_v1_Chr5_+_3111945_3111945 | 0.39 |
AT5G09970.1
|
CYP78A7
|
cytochrome P450, family 78, subfamily A, polypeptide 7 |
| arTal_v1_Chr1_-_1637914_1637914 | 0.39 |
AT1G05530.1
|
UGT75B2
|
UDP-glucosyl transferase 75B2 |
| arTal_v1_Chr4_-_12339967_12339967 | 0.39 |
AT4G23690.1
|
DIR6
|
Disease resistance-responsive (dirigent-like protein) family protein |
| arTal_v1_Chr2_-_15993276_15993326 | 0.39 |
AT2G38170.2
AT2G38170.3 AT2G38170.1 |
CAX1
|
cation exchanger 1 |
| arTal_v1_Chr4_-_17293925_17293925 | 0.39 |
AT4G36680.1
|
AT4G36680
|
Tetratricopeptide repeat (TPR)-like superfamily protein |
| arTal_v1_Chr5_+_18791575_18791575 | 0.39 |
AT5G46330.1
AT5G46330.2 |
FLS2
|
Leucine-rich receptor-like protein kinase family protein |
| arTal_v1_Chr3_+_16138375_16138375 | 0.39 |
AT3G44550.2
|
FAR5
|
fatty acid reductase 5 |
| arTal_v1_Chr5_+_7718118_7718118 | 0.38 |
AT5G23020.1
|
IMS2
|
2-isopropylmalate synthase 2 |
| arTal_v1_Chr4_+_8679754_8679901 | 0.38 |
AT4G15230.2
AT4G15230.3 AT4G15230.1 AT4G15230.4 |
ABCG30
|
pleiotropic drug resistance 2 |
| arTal_v1_Chr3_-_6762754_6762754 | 0.38 |
AT3G19508.1
|
AT3G19508
|
complex 1 protein, LYR family protein |
| arTal_v1_Chr5_+_7676938_7676938 | 0.38 |
AT5G22940.2
|
F8H
|
glucuronoxylan glucuronosyltransferase, putative |
| arTal_v1_Chr1_+_9654475_9654475 | 0.38 |
AT1G27740.1
|
RSL4
|
root hair defective 6-like 4 |
| arTal_v1_Chr5_-_24333144_24333144 | 0.38 |
AT5G60520.1
|
AT5G60520
|
Late embryogenesis abundant (LEA) protein-like protein |
| arTal_v1_Chr4_-_8307934_8307934 | 0.38 |
AT4G14440.1
|
HCD1
|
3-hydroxyacyl-CoA dehydratase 1 |
| arTal_v1_Chr1_-_40945_41017 | 0.38 |
AT1G01070.2
AT1G01070.1 |
UMAMIT28
|
nodulin MtN21 /EamA-like transporter family protein |
| arTal_v1_Chr4_-_11023736_11023851 | 0.38 |
AT4G20440.4
AT4G20440.5 AT4G20440.3 AT4G20440.2 AT4G20440.1 |
smB
|
small nuclear ribonucleoprotein associated protein B |
| arTal_v1_Chr4_-_14733628_14733628 | 0.38 |
AT4G30120.1
|
HMA3
|
heavy metal atpase 3 |
| arTal_v1_Chr3_+_512220_512220 | 0.38 |
AT3G02480.1
|
AT3G02480
|
Late embryogenesis abundant protein (LEA) family protein |
| arTal_v1_Chr5_-_23485014_23485014 | 0.38 |
AT5G58010.1
|
LRL3
|
LJRHL1-like 3 |
| arTal_v1_Chr2_-_19667192_19667192 | 0.37 |
AT2G48080.1
|
AT2G48080
|
oxidoreductase, 2OG-Fe(II) oxygenase family protein |
| arTal_v1_Chr4_-_12147993_12148041 | 0.37 |
AT4G23200.2
AT4G23200.1 |
CRK12
|
cysteine-rich RLK (RECEPTOR-like protein kinase) 12 |
| arTal_v1_Chr1_+_10824637_10824637 | 0.37 |
AT1G30560.1
|
G3Pp3
|
Major facilitator superfamily protein |
| arTal_v1_Chr2_-_16042383_16042521 | 0.37 |
AT2G38290.2
AT2G38290.1 |
AMT2
|
ammonium transporter 2 |
| arTal_v1_Chr5_-_5062087_5062144 | 0.37 |
AT5G15550.2
AT5G15550.3 AT5G15550.1 |
AT5G15550
|
Transducin/WD40 repeat-like superfamily protein |
| arTal_v1_Chr1_-_5194214_5194214 | 0.37 |
AT1G15100.1
|
RHA2A
|
RING-H2 finger A2A |
| arTal_v1_Chr5_-_5356353_5356353 | 0.37 |
AT5G16360.1
|
AT5G16360
|
NC domain-containing protein-like protein |
| arTal_v1_Chr4_-_17267472_17267472 | 0.37 |
AT4G36610.1
|
AT4G36610
|
alpha/beta-Hydrolases superfamily protein |
| arTal_v1_Chr2_-_8192536_8192536 | 0.37 |
AT2G18900.1
|
AT2G18900
|
Transducin/WD40 repeat-like superfamily protein |
| arTal_v1_Chr5_+_25721733_25721733 | 0.37 |
AT5G64310.1
|
AGP1
|
arabinogalactan protein 1 |
| arTal_v1_Chr4_-_13910995_13910995 | 0.37 |
AT4G27950.1
|
CRF4
|
cytokinin response factor 4 |
| arTal_v1_Chr4_-_15045344_15045344 | 0.36 |
AT4G30910.1
AT4G30910.2 |
AT4G30910
|
Cytosol aminopeptidase family protein |
| arTal_v1_Chr2_-_14373901_14373901 | 0.36 |
AT2G34020.1
AT2G34020.2 |
AT2G34020
|
Calcium-binding EF-hand family protein |
| arTal_v1_Chr5_+_7676662_7676662 | 0.36 |
AT5G22940.1
|
F8H
|
glucuronoxylan glucuronosyltransferase, putative |
| arTal_v1_Chr5_+_3550300_3550300 | 0.36 |
AT5G11160.1
AT5G11160.2 |
APT5
|
adenine phosphoribosyltransferase 5 |
| arTal_v1_Chr1_-_20156520_20156520 | 0.36 |
AT1G54000.1
|
GLL22
|
GDSL-like Lipase/Acylhydrolase superfamily protein |
| arTal_v1_Chr1_-_29418994_29418994 | 0.36 |
AT1G78190.1
|
AT1G78190
|
Trm112p-like protein |
| arTal_v1_Chr4_-_6443554_6443554 | 0.36 |
AT4G10390.1
|
AT4G10390
|
Protein kinase superfamily protein |
| arTal_v1_Chr5_+_16968655_16968658 | 0.36 |
AT5G42420.1
AT5G42420.2 |
AT5G42420
|
Nucleotide-sugar transporter family protein |
| arTal_v1_Chr1_+_3086101_3086101 | 0.36 |
AT1G09540.1
|
MYB61
|
myb domain protein 61 |
| arTal_v1_Chr5_-_19974530_19974530 | 0.36 |
AT5G49270.1
|
SHV2
|
COBRA-like extracellular glycosyl-phosphatidyl inositol-anchored protein family |
| arTal_v1_Chr2_+_8491388_8491388 | 0.36 |
AT2G19640.1
|
ASHR2
|
ASH1-related protein 2 |
| arTal_v1_Chr2_-_16115204_16115204 | 0.36 |
AT2G38490.1
|
CIPK22
|
CBL-interacting Serine/Threonine-kinase |
| arTal_v1_Chr3_-_19060036_19060087 | 0.36 |
AT3G51340.1
AT3G51340.3 AT3G51340.4 AT3G51340.2 |
AT3G51340
|
Eukaryotic aspartyl protease family protein |
| arTal_v1_Chr3_-_22280691_22280691 | 0.36 |
AT3G60280.1
|
UCC3
|
uclacyanin 3 |
| arTal_v1_Chr2_-_14677398_14677398 | 0.35 |
AT2G34790.1
|
MEE23
|
FAD-binding Berberine family protein |
| arTal_v1_Chr3_+_17446818_17446818 | 0.35 |
AT3G47350.3
AT3G47350.2 AT3G47350.1 |
HSD2
|
hydroxysteroid dehydrogenase 2 |
| arTal_v1_Chr3_-_17475274_17475274 | 0.35 |
AT3G47420.3
AT3G47420.1 AT3G47420.2 |
G3Pp1
|
putative glycerol-3-phosphate transporter 1 |
| arTal_v1_Chr4_+_14192569_14192569 | 0.35 |
AT4G28720.1
|
YUC8
|
Flavin-binding monooxygenase family protein |
| arTal_v1_Chr1_-_8189220_8189234 | 0.35 |
AT1G23090.4
AT1G23090.1 AT1G23090.3 AT1G23090.2 |
AST91
|
sulfate transporter 91 |
| arTal_v1_Chr4_+_12660687_12660687 | 0.35 |
AT4G24510.1
|
CER2
|
HXXXD-type acyl-transferase family protein |
| arTal_v1_Chr4_+_626220_626220 | 0.35 |
AT4G01480.2
|
PPa5
|
pyrophosphorylase 5 |
| arTal_v1_Chr4_+_564760_564760 | 0.35 |
AT4G01360.1
|
BPS3
|
BPS1-like protein |
| arTal_v1_Chr1_-_23286797_23286797 | 0.35 |
AT1G62870.1
|
AT1G62870
|
hypothetical protein |
| arTal_v1_Chr4_+_626069_626069 | 0.35 |
AT4G01480.1
|
PPa5
|
pyrophosphorylase 5 |
| arTal_v1_Chr2_+_8491192_8491192 | 0.35 |
AT2G19640.2
|
ASHR2
|
ASH1-related protein 2 |
| arTal_v1_Chr4_+_7210807_7210807 | 0.35 |
AT4G12030.4
AT4G12030.3 AT4G12030.2 AT4G12030.1 |
BAT5
|
bile acid transporter 5 |
| arTal_v1_Chr1_-_224351_224351 | 0.35 |
AT1G01610.1
|
GPAT4
|
glycerol-3-phosphate acyltransferase 4 |
| arTal_v1_Chr4_-_14776247_14776247 | 0.35 |
AT4G30190.1
|
HA2
|
H[+]-ATPase 2 |
| arTal_v1_Chr3_+_10911132_10911157 | 0.34 |
AT3G28910.1
AT3G28910.2 |
MYB30
|
myb domain protein 30 |
| arTal_v1_Chr5_+_15256243_15256276 | 0.34 |
AT5G38200.2
AT5G38200.3 AT5G38200.1 |
AT5G38200
|
Class I glutamine amidotransferase-like superfamily protein |
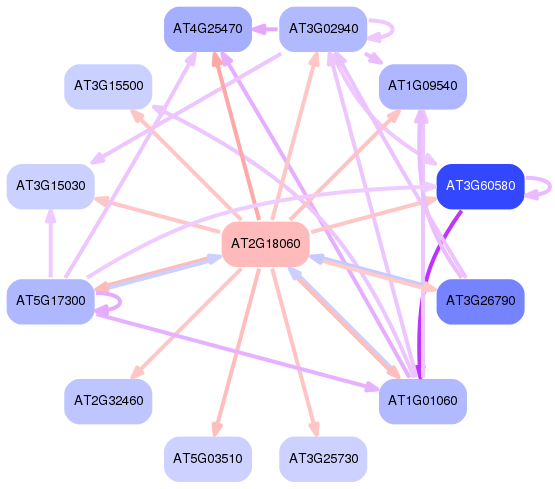
Network of associatons between targets according to the STRING database.

First level regulatory network of AT2G18060
Gene Ontology Analysis
Gene overrepresentation in biological process category:
| Log-likelihood per target | Total log-likelihood | Term | Description |
|---|---|---|---|
| 0.9 | 0.9 | GO:0071281 | cellular response to iron ion(GO:0071281) |
| 0.4 | 2.0 | GO:0072708 | response to sorbitol(GO:0072708) |
| 0.2 | 1.0 | GO:0043433 | negative regulation of sequence-specific DNA binding transcription factor activity(GO:0043433) |
| 0.2 | 0.7 | GO:0015696 | ammonium transport(GO:0015696) |
| 0.2 | 0.6 | GO:0006059 | hexitol metabolic process(GO:0006059) hexitol biosynthetic process(GO:0019406) mannitol biosynthetic process(GO:0019593) mannitol metabolic process(GO:0019594) |
| 0.2 | 0.8 | GO:0006024 | aminoglycan biosynthetic process(GO:0006023) glycosaminoglycan biosynthetic process(GO:0006024) UDP-glucuronate biosynthetic process(GO:0006065) glycosaminoglycan metabolic process(GO:0030203) |
| 0.2 | 0.5 | GO:0033506 | homomethionine metabolic process(GO:0033321) glucosinolate biosynthetic process from homomethionine(GO:0033506) |
| 0.1 | 0.4 | GO:0006984 | ER-nucleus signaling pathway(GO:0006984) |
| 0.1 | 0.4 | GO:0032963 | collagen metabolic process(GO:0032963) multicellular organism metabolic process(GO:0044236) multicellular organismal macromolecule metabolic process(GO:0044259) |
| 0.1 | 0.3 | GO:0030320 | cellular monovalent inorganic anion homeostasis(GO:0030320) |
| 0.1 | 0.4 | GO:0015742 | alpha-ketoglutarate transport(GO:0015742) |
| 0.1 | 0.6 | GO:0046208 | spermine catabolic process(GO:0046208) |
| 0.1 | 1.8 | GO:0072506 | phosphate ion homeostasis(GO:0055062) trivalent inorganic anion homeostasis(GO:0072506) |
| 0.1 | 1.6 | GO:0010555 | response to mannitol(GO:0010555) |
| 0.1 | 0.2 | GO:0006106 | fumarate metabolic process(GO:0006106) |
| 0.1 | 0.3 | GO:0043092 | L-amino acid import(GO:0043092) L-glutamate import(GO:0051938) |
| 0.1 | 0.3 | GO:0042353 | fucose biosynthetic process(GO:0042353) |
| 0.1 | 0.6 | GO:0071492 | response to UV-A(GO:0070141) cellular response to UV-A(GO:0071492) |
| 0.1 | 0.4 | GO:0048838 | release of seed from dormancy(GO:0048838) exit from dormancy(GO:0097438) |
| 0.1 | 0.3 | GO:0006493 | protein O-linked glycosylation(GO:0006493) |
| 0.1 | 0.3 | GO:0010501 | RNA secondary structure unwinding(GO:0010501) |
| 0.1 | 0.3 | GO:0015802 | basic amino acid transport(GO:0015802) |
| 0.1 | 0.3 | GO:0033528 | S-methylmethionine metabolic process(GO:0033477) S-methylmethionine cycle(GO:0033528) |
| 0.1 | 1.9 | GO:0006826 | iron ion transport(GO:0006826) |
| 0.1 | 0.3 | GO:0016118 | tetraterpenoid catabolic process(GO:0016110) carotenoid catabolic process(GO:0016118) xanthophyll catabolic process(GO:0016124) |
| 0.1 | 0.3 | GO:0019279 | L-methionine biosynthetic process from L-homoserine via cystathionine(GO:0019279) 'de novo' L-methionine biosynthetic process(GO:0071266) |
| 0.1 | 0.3 | GO:0009831 | plant-type cell wall modification involved in multidimensional cell growth(GO:0009831) |
| 0.1 | 0.2 | GO:0042539 | hypotonic salinity response(GO:0042539) |
| 0.1 | 0.7 | GO:0098719 | sodium ion transmembrane transport(GO:0035725) sodium ion import(GO:0097369) sodium ion import across plasma membrane(GO:0098719) sodium ion import into cell(GO:1990118) |
| 0.1 | 0.3 | GO:0034414 | tRNA 3'-trailer cleavage, endonucleolytic(GO:0034414) |
| 0.1 | 0.3 | GO:0019586 | uronic acid metabolic process(GO:0006063) galacturonate metabolic process(GO:0019586) |
| 0.1 | 0.3 | GO:0080168 | abscisic acid transport(GO:0080168) |
| 0.1 | 0.4 | GO:0009807 | lignan metabolic process(GO:0009806) lignan biosynthetic process(GO:0009807) |
| 0.1 | 0.2 | GO:1990532 | stress response to nickel ion(GO:1990532) |
| 0.1 | 0.3 | GO:0046479 | glycosylceramide metabolic process(GO:0006677) glucosylceramide metabolic process(GO:0006678) glucosylceramide catabolic process(GO:0006680) glycosphingolipid metabolic process(GO:0006687) glycolipid catabolic process(GO:0019377) glycosylceramide catabolic process(GO:0046477) glycosphingolipid catabolic process(GO:0046479) ceramide catabolic process(GO:0046514) |
| 0.1 | 0.4 | GO:0009800 | cinnamic acid biosynthetic process(GO:0009800) |
| 0.1 | 2.1 | GO:0010345 | suberin biosynthetic process(GO:0010345) |
| 0.1 | 0.6 | GO:0043096 | adenine salvage(GO:0006168) purine nucleobase salvage(GO:0043096) |
| 0.1 | 0.2 | GO:0045857 | regulation of molecular function, epigenetic(GO:0040030) negative regulation of molecular function, epigenetic(GO:0045857) |
| 0.1 | 0.2 | GO:0019919 | peptidyl-arginine methylation, to asymmetrical-dimethyl arginine(GO:0019919) peptidyl-arginine N-methylation(GO:0035246) peptidyl-arginine omega-N-methylation(GO:0035247) |
| 0.1 | 0.5 | GO:0080165 | callose deposition in phloem sieve plate(GO:0080165) |
| 0.1 | 0.3 | GO:0055073 | cadmium ion homeostasis(GO:0055073) |
| 0.1 | 0.8 | GO:0017157 | regulation of exocytosis(GO:0017157) |
| 0.1 | 0.5 | GO:0006552 | leucine catabolic process(GO:0006552) |
| 0.1 | 0.1 | GO:0010246 | rhamnogalacturonan I biosynthetic process(GO:0010246) |
| 0.1 | 0.3 | GO:0010338 | leaf formation(GO:0010338) |
| 0.1 | 1.2 | GO:0042761 | very long-chain fatty acid biosynthetic process(GO:0042761) |
| 0.1 | 0.9 | GO:0010497 | plasmodesmata-mediated intercellular transport(GO:0010497) |
| 0.1 | 1.7 | GO:0009691 | cytokinin biosynthetic process(GO:0009691) |
| 0.1 | 0.5 | GO:0071585 | detoxification of cadmium ion(GO:0071585) |
| 0.1 | 0.2 | GO:0090603 | sieve element differentiation(GO:0090603) |
| 0.1 | 0.2 | GO:0048478 | replication fork protection(GO:0048478) |
| 0.1 | 0.2 | GO:0015739 | sialic acid transport(GO:0015739) |
| 0.1 | 0.7 | GO:0010417 | glucuronoxylan metabolic process(GO:0010413) glucuronoxylan biosynthetic process(GO:0010417) |
| 0.1 | 0.2 | GO:1905157 | positive regulation of photosynthesis(GO:1905157) |
| 0.1 | 0.2 | GO:1903961 | positive regulation of transporter activity(GO:0032411) positive regulation of ion transmembrane transporter activity(GO:0032414) cellular response to absence of light(GO:0071485) positive regulation of anion channel activity(GO:1901529) positive regulation of anion transport(GO:1903793) positive regulation of anion transmembrane transport(GO:1903961) |
| 0.1 | 0.2 | GO:0048442 | sepal development(GO:0048442) flower calyx development(GO:0048464) |
| 0.1 | 0.3 | GO:0009759 | indole glucosinolate biosynthetic process(GO:0009759) |
| 0.1 | 0.2 | GO:0009304 | tRNA transcription(GO:0009304) |
| 0.1 | 0.3 | GO:0043981 | histone H4-K5 acetylation(GO:0043981) |
| 0.1 | 0.4 | GO:0070072 | vacuolar proton-transporting V-type ATPase complex assembly(GO:0070072) |
| 0.0 | 0.4 | GO:0016045 | detection of bacterium(GO:0016045) |
| 0.0 | 0.5 | GO:0070973 | protein localization to endoplasmic reticulum exit site(GO:0070973) |
| 0.0 | 1.2 | GO:0030641 | regulation of cellular pH(GO:0030641) regulation of intracellular pH(GO:0051453) |
| 0.0 | 0.8 | GO:2000008 | regulation of protein localization to cell surface(GO:2000008) |
| 0.0 | 0.1 | GO:2000692 | negative regulation of seed maturation(GO:2000692) |
| 0.0 | 0.5 | GO:0051365 | cellular response to potassium ion starvation(GO:0051365) |
| 0.0 | 0.1 | GO:0010433 | nectary development(GO:0010254) bract morphogenesis(GO:0010433) bract formation(GO:0010434) |
| 0.0 | 0.1 | GO:0010395 | rhamnogalacturonan I metabolic process(GO:0010395) |
| 0.0 | 0.2 | GO:0009647 | skotomorphogenesis(GO:0009647) |
| 0.0 | 0.3 | GO:0043100 | pyrimidine nucleobase salvage(GO:0043100) |
| 0.0 | 0.4 | GO:0070814 | hydrogen sulfide biosynthetic process(GO:0070814) |
| 0.0 | 0.6 | GO:1902074 | response to salt(GO:1902074) |
| 0.0 | 0.6 | GO:0018231 | peptidyl-L-cysteine S-palmitoylation(GO:0018230) peptidyl-S-diacylglycerol-L-cysteine biosynthetic process from peptidyl-cysteine(GO:0018231) |
| 0.0 | 0.2 | GO:0015697 | quaternary ammonium group transport(GO:0015697) |
| 0.0 | 0.2 | GO:1901141 | regulation of lignin biosynthetic process(GO:1901141) |
| 0.0 | 2.4 | GO:0009631 | cold acclimation(GO:0009631) |
| 0.0 | 0.1 | GO:0097056 | seryl-tRNA aminoacylation(GO:0006434) selenocysteinyl-tRNA(Sec) biosynthetic process(GO:0097056) |
| 0.0 | 1.9 | GO:0042752 | regulation of circadian rhythm(GO:0042752) |
| 0.0 | 0.7 | GO:0045338 | farnesyl diphosphate metabolic process(GO:0045338) |
| 0.0 | 0.2 | GO:0046247 | carotene catabolic process(GO:0016121) terpene catabolic process(GO:0046247) |
| 0.0 | 0.1 | GO:0010446 | response to alkaline pH(GO:0010446) |
| 0.0 | 0.2 | GO:0010019 | chloroplast-nucleus signaling pathway(GO:0010019) |
| 0.0 | 0.1 | GO:0009805 | coumarin biosynthetic process(GO:0009805) |
| 0.0 | 0.3 | GO:0033320 | UDP-D-xylose metabolic process(GO:0033319) UDP-D-xylose biosynthetic process(GO:0033320) |
| 0.0 | 0.2 | GO:0010683 | tricyclic triterpenoid metabolic process(GO:0010683) |
| 0.0 | 0.1 | GO:0048358 | mucilage pectin biosynthetic process(GO:0048358) |
| 0.0 | 0.4 | GO:0030308 | negative regulation of cell growth(GO:0030308) |
| 0.0 | 0.3 | GO:0007205 | protein kinase C-activating G-protein coupled receptor signaling pathway(GO:0007205) |
| 0.0 | 1.6 | GO:0006749 | glutathione metabolic process(GO:0006749) |
| 0.0 | 0.6 | GO:0030388 | fructose 1,6-bisphosphate metabolic process(GO:0030388) |
| 0.0 | 0.2 | GO:0006011 | UDP-glucose metabolic process(GO:0006011) |
| 0.0 | 0.1 | GO:0033240 | positive regulation of cellular amine metabolic process(GO:0033240) positive regulation of cellular amino acid metabolic process(GO:0045764) |
| 0.0 | 0.3 | GO:1901348 | positive regulation of secondary cell wall biogenesis(GO:1901348) positive regulation of cell wall organization or biogenesis(GO:1903340) |
| 0.0 | 0.4 | GO:0006878 | cellular copper ion homeostasis(GO:0006878) |
| 0.0 | 0.2 | GO:0010306 | rhamnogalacturonan II biosynthetic process(GO:0010306) rhamnogalacturonan II metabolic process(GO:0010396) |
| 0.0 | 0.1 | GO:0015854 | adenine transport(GO:0015853) guanine transport(GO:0015854) |
| 0.0 | 0.1 | GO:0034476 | U1 snRNA 3'-end processing(GO:0034473) U5 snRNA 3'-end processing(GO:0034476) nuclear polyadenylation-dependent mRNA catabolic process(GO:0071042) polyadenylation-dependent mRNA catabolic process(GO:0071047) |
| 0.0 | 0.5 | GO:0048766 | root hair initiation(GO:0048766) |
| 0.0 | 0.1 | GO:0002943 | tRNA dihydrouridine synthesis(GO:0002943) |
| 0.0 | 0.2 | GO:1990019 | protein storage vacuole organization(GO:1990019) |
| 0.0 | 1.1 | GO:0019761 | S-glycoside biosynthetic process(GO:0016144) glycosinolate biosynthetic process(GO:0019758) glucosinolate biosynthetic process(GO:0019761) |
| 0.0 | 0.1 | GO:0030100 | regulation of endocytosis(GO:0030100) |
| 0.0 | 0.2 | GO:0071219 | cellular response to molecule of bacterial origin(GO:0071219) |
| 0.0 | 0.1 | GO:0005980 | glycogen catabolic process(GO:0005980) |
| 0.0 | 0.1 | GO:0046102 | inosine catabolic process(GO:0006148) inosine metabolic process(GO:0046102) |
| 0.0 | 0.1 | GO:2000104 | negative regulation of DNA-dependent DNA replication(GO:2000104) |
| 0.0 | 0.1 | GO:0006297 | nucleotide-excision repair, DNA gap filling(GO:0006297) |
| 0.0 | 0.1 | GO:0009865 | pollen tube adhesion(GO:0009865) cell-cell adhesion(GO:0098609) multi organism cell adhesion(GO:0098740) |
| 0.0 | 0.1 | GO:0010450 | inflorescence meristem growth(GO:0010450) |
| 0.0 | 0.5 | GO:0016024 | CDP-diacylglycerol biosynthetic process(GO:0016024) CDP-diacylglycerol metabolic process(GO:0046341) |
| 0.0 | 0.8 | GO:0006012 | galactose metabolic process(GO:0006012) |
| 0.0 | 0.9 | GO:0000028 | ribosomal small subunit assembly(GO:0000028) |
| 0.0 | 0.1 | GO:1900459 | positive regulation of brassinosteroid mediated signaling pathway(GO:1900459) |
| 0.0 | 0.3 | GO:0009554 | megasporogenesis(GO:0009554) |
| 0.0 | 0.1 | GO:0010372 | positive regulation of gibberellin biosynthetic process(GO:0010372) |
| 0.0 | 0.3 | GO:0045842 | positive regulation of mitotic nuclear division(GO:0045840) positive regulation of mitotic metaphase/anaphase transition(GO:0045842) positive regulation of mitotic sister chromatid separation(GO:1901970) positive regulation of metaphase/anaphase transition of cell cycle(GO:1902101) |
| 0.0 | 0.9 | GO:0005992 | trehalose biosynthetic process(GO:0005992) |
| 0.0 | 0.2 | GO:0052325 | cell wall pectin biosynthetic process(GO:0052325) |
| 0.0 | 0.1 | GO:0009590 | detection of gravity(GO:0009590) |
| 0.0 | 0.1 | GO:0051091 | positive regulation of sequence-specific DNA binding transcription factor activity(GO:0051091) |
| 0.0 | 0.2 | GO:0006121 | mitochondrial electron transport, succinate to ubiquinone(GO:0006121) |
| 0.0 | 0.1 | GO:0042149 | cellular response to glucose starvation(GO:0042149) |
| 0.0 | 0.2 | GO:0009954 | proximal/distal pattern formation(GO:0009954) |
| 0.0 | 0.1 | GO:0010116 | positive regulation of abscisic acid biosynthetic process(GO:0010116) |
| 0.0 | 0.5 | GO:0048826 | cotyledon morphogenesis(GO:0048826) |
| 0.0 | 0.4 | GO:0010052 | guard cell differentiation(GO:0010052) |
| 0.0 | 0.6 | GO:0009269 | response to desiccation(GO:0009269) |
| 0.0 | 0.1 | GO:0090506 | axillary shoot meristem initiation(GO:0090506) |
| 0.0 | 0.4 | GO:1905177 | tracheary element differentiation(GO:1905177) |
| 0.0 | 0.2 | GO:0071249 | cellular response to nitrate(GO:0071249) |
| 0.0 | 0.1 | GO:0001672 | regulation of chromatin assembly or disassembly(GO:0001672) |
| 0.0 | 0.1 | GO:1902626 | assembly of large subunit precursor of preribosome(GO:1902626) |
| 0.0 | 0.1 | GO:0046051 | UTP biosynthetic process(GO:0006228) UTP metabolic process(GO:0046051) |
| 0.0 | 0.1 | GO:0045604 | regulation of epithelial cell differentiation(GO:0030856) regulation of epidermal cell differentiation(GO:0045604) regulation of epidermis development(GO:0045682) |
| 0.0 | 0.6 | GO:2000012 | regulation of auxin polar transport(GO:2000012) |
| 0.0 | 0.6 | GO:0010227 | floral organ abscission(GO:0010227) |
| 0.0 | 0.1 | GO:0006501 | C-terminal protein lipidation(GO:0006501) |
| 0.0 | 0.1 | GO:0034080 | CENP-A containing nucleosome assembly(GO:0034080) CENP-A containing chromatin organization(GO:0061641) |
| 0.0 | 0.2 | GO:1901984 | negative regulation of histone acetylation(GO:0035067) negative regulation of protein acetylation(GO:1901984) negative regulation of peptidyl-lysine acetylation(GO:2000757) |
| 0.0 | 0.1 | GO:0006370 | 7-methylguanosine mRNA capping(GO:0006370) |
| 0.0 | 0.2 | GO:0034765 | regulation of ion transmembrane transport(GO:0034765) |
| 0.0 | 0.4 | GO:0019374 | galactolipid metabolic process(GO:0019374) |
| 0.0 | 0.3 | GO:0010167 | response to nitrate(GO:0010167) |
| 0.0 | 0.3 | GO:0055075 | potassium ion homeostasis(GO:0055075) |
| 0.0 | 0.2 | GO:0002697 | regulation of immune effector process(GO:0002697) regulation of defense response to virus(GO:0050688) |
| 0.0 | 0.3 | GO:0030522 | blue light signaling pathway(GO:0009785) intracellular receptor signaling pathway(GO:0030522) |
| 0.0 | 0.5 | GO:0045492 | xylan biosynthetic process(GO:0045492) |
| 0.0 | 0.3 | GO:0010305 | leaf vascular tissue pattern formation(GO:0010305) |
| 0.0 | 0.1 | GO:0008615 | pyridoxine biosynthetic process(GO:0008615) |
| 0.0 | 0.4 | GO:0015770 | sucrose transport(GO:0015770) |
| 0.0 | 0.5 | GO:0010268 | brassinosteroid homeostasis(GO:0010268) |
| 0.0 | 0.3 | GO:0010215 | cellulose microfibril organization(GO:0010215) |
| 0.0 | 0.1 | GO:0048530 | fruit morphogenesis(GO:0048530) |
| 0.0 | 0.2 | GO:0055069 | zinc ion homeostasis(GO:0055069) |
| 0.0 | 0.2 | GO:0051443 | positive regulation of ubiquitin-protein transferase activity(GO:0051443) |
| 0.0 | 0.2 | GO:0006102 | isocitrate metabolic process(GO:0006102) |
| 0.0 | 0.1 | GO:1900458 | negative regulation of brassinosteroid mediated signaling pathway(GO:1900458) |
| 0.0 | 0.5 | GO:0032436 | positive regulation of proteasomal ubiquitin-dependent protein catabolic process(GO:0032436) positive regulation of proteasomal protein catabolic process(GO:1901800) |
| 0.0 | 0.3 | GO:0046688 | response to copper ion(GO:0046688) |
| 0.0 | 0.4 | GO:0032875 | regulation of DNA endoreduplication(GO:0032875) |
| 0.0 | 0.1 | GO:0046373 | L-arabinose metabolic process(GO:0046373) |
| 0.0 | 0.1 | GO:2000014 | regulation of endosperm development(GO:2000014) |
| 0.0 | 0.0 | GO:0005991 | trehalose metabolic process(GO:0005991) |
| 0.0 | 0.4 | GO:0006108 | malate metabolic process(GO:0006108) |
| 0.0 | 0.7 | GO:0009559 | embryo sac central cell differentiation(GO:0009559) |
| 0.0 | 0.1 | GO:0071277 | cellular response to calcium ion(GO:0071277) |
| 0.0 | 1.1 | GO:1902600 | hydrogen ion transmembrane transport(GO:1902600) |
| 0.0 | 0.1 | GO:1901642 | nucleoside transmembrane transport(GO:1901642) |
| 0.0 | 0.1 | GO:0019365 | pyridine nucleotide salvage(GO:0019365) |
| 0.0 | 0.2 | GO:0048575 | short-day photoperiodism(GO:0048572) short-day photoperiodism, flowering(GO:0048575) |
| 0.0 | 0.1 | GO:0097036 | regulation of plasma membrane sterol distribution(GO:0097036) |
| 0.0 | 0.1 | GO:0080094 | response to trehalose-6-phosphate(GO:0080094) |
| 0.0 | 0.4 | GO:0045489 | pectin biosynthetic process(GO:0045489) |
| 0.0 | 0.1 | GO:0007095 | mitotic G2 DNA damage checkpoint(GO:0007095) G2 DNA damage checkpoint(GO:0031572) |
| 0.0 | 0.1 | GO:1902299 | pre-replicative complex assembly involved in nuclear cell cycle DNA replication(GO:0006267) pre-replicative complex assembly(GO:0036388) pre-replicative complex assembly involved in cell cycle DNA replication(GO:1902299) |
| 0.0 | 0.2 | GO:0051050 | positive regulation of transport(GO:0051050) |
| 0.0 | 0.1 | GO:1901703 | protein localization involved in auxin polar transport(GO:1901703) |
| 0.0 | 0.2 | GO:0016554 | base conversion or substitution editing(GO:0016553) cytidine to uridine editing(GO:0016554) |
| 0.0 | 0.2 | GO:0006490 | oligosaccharide-lipid intermediate biosynthetic process(GO:0006490) |
| 0.0 | 0.0 | GO:0002215 | defense response to nematode(GO:0002215) |
| 0.0 | 0.2 | GO:0036065 | fucosylation(GO:0036065) |
| 0.0 | 0.5 | GO:0016575 | histone deacetylation(GO:0016575) |
| 0.0 | 0.1 | GO:0043406 | activation of MAPK activity(GO:0000187) positive regulation of MAP kinase activity(GO:0043406) |
| 0.0 | 0.5 | GO:0085029 | pollen wall assembly(GO:0010208) cellular component assembly involved in morphogenesis(GO:0010927) extracellular matrix assembly(GO:0085029) |
| 0.0 | 0.8 | GO:0072666 | protein targeting to vacuole(GO:0006623) protein localization to vacuole(GO:0072665) establishment of protein localization to vacuole(GO:0072666) |
| 0.0 | 0.4 | GO:0010143 | cutin biosynthetic process(GO:0010143) |
| 0.0 | 0.1 | GO:0070981 | L-asparagine biosynthetic process(GO:0070981) L-asparagine metabolic process(GO:0070982) |
| 0.0 | 0.0 | GO:0001738 | establishment of planar polarity(GO:0001736) morphogenesis of a polarized epithelium(GO:0001738) morphogenesis of an epithelium(GO:0002009) tissue morphogenesis(GO:0048729) |
| 0.0 | 0.1 | GO:0018107 | peptidyl-threonine phosphorylation(GO:0018107) peptidyl-threonine modification(GO:0018210) |
| 0.0 | 0.7 | GO:0042274 | ribosomal small subunit biogenesis(GO:0042274) |
| 0.0 | 0.1 | GO:0006427 | histidyl-tRNA aminoacylation(GO:0006427) |
| 0.0 | 0.1 | GO:0030104 | water homeostasis(GO:0030104) |
| 0.0 | 0.5 | GO:0045168 | cell-cell signaling involved in cell fate commitment(GO:0045168) |
| 0.0 | 0.2 | GO:0015743 | malate transport(GO:0015743) |
| 0.0 | 0.3 | GO:2000652 | regulation of secondary cell wall biogenesis(GO:2000652) |
| 0.0 | 0.1 | GO:0009854 | oxidative photosynthetic carbon pathway(GO:0009854) |
| 0.0 | 0.1 | GO:0010047 | fruit dehiscence(GO:0010047) |
| 0.0 | 0.2 | GO:0070940 | dephosphorylation of RNA polymerase II C-terminal domain(GO:0070940) |
| 0.0 | 0.1 | GO:0000304 | response to singlet oxygen(GO:0000304) |
| 0.0 | 0.0 | GO:1903428 | positive regulation of reactive oxygen species biosynthetic process(GO:1903428) |
| 0.0 | 0.1 | GO:0032309 | icosanoid secretion(GO:0032309) arachidonic acid secretion(GO:0050482) icosanoid transport(GO:0071715) fatty acid derivative transport(GO:1901571) arachidonate transport(GO:1903963) |
| 0.0 | 0.3 | GO:0000038 | very long-chain fatty acid metabolic process(GO:0000038) |
| 0.0 | 0.3 | GO:0009825 | multidimensional cell growth(GO:0009825) |
| 0.0 | 0.0 | GO:0045901 | positive regulation of translational elongation(GO:0045901) positive regulation of translational termination(GO:0045905) |
| 0.0 | 0.0 | GO:0051984 | positive regulation of chromosome segregation(GO:0051984) |
| 0.0 | 0.1 | GO:0010951 | negative regulation of endopeptidase activity(GO:0010951) regulation of endopeptidase activity(GO:0052548) |
| 0.0 | 0.1 | GO:1902290 | positive regulation of defense response to oomycetes(GO:1902290) |
| 0.0 | 0.0 | GO:0030030 | cell projection organization(GO:0030030) cell projection assembly(GO:0030031) |
| 0.0 | 0.1 | GO:0019243 | lactate metabolic process(GO:0006089) methylglyoxal metabolic process(GO:0009438) methylglyoxal catabolic process to D-lactate via S-lactoyl-glutathione(GO:0019243) ketone catabolic process(GO:0042182) methylglyoxal catabolic process(GO:0051596) methylglyoxal catabolic process to lactate(GO:0061727) |
| 0.0 | 0.1 | GO:0019346 | transsulfuration(GO:0019346) homocysteine metabolic process(GO:0050667) |
| 0.0 | 0.3 | GO:0090630 | activation of GTPase activity(GO:0090630) |
| 0.0 | 0.2 | GO:0006075 | (1->3)-beta-D-glucan metabolic process(GO:0006074) (1->3)-beta-D-glucan biosynthetic process(GO:0006075) |
| 0.0 | 0.2 | GO:0010112 | regulation of systemic acquired resistance(GO:0010112) |
| 0.0 | 0.2 | GO:0051026 | chiasma assembly(GO:0051026) |
| 0.0 | 0.1 | GO:0071267 | L-methionine biosynthetic process from methylthioadenosine(GO:0019509) amino acid salvage(GO:0043102) L-methionine salvage(GO:0071267) |
| 0.0 | 0.1 | GO:0007023 | post-chaperonin tubulin folding pathway(GO:0007023) |
| 0.0 | 0.3 | GO:0030050 | vesicle transport along actin filament(GO:0030050) vesicle cytoskeletal trafficking(GO:0099518) |
| 0.0 | 0.1 | GO:1901070 | guanosine-containing compound biosynthetic process(GO:1901070) |
| 0.0 | 0.0 | GO:0000973 | posttranscriptional tethering of RNA polymerase II gene DNA at nuclear periphery(GO:0000973) |
| 0.0 | 0.4 | GO:0000723 | telomere maintenance(GO:0000723) telomere organization(GO:0032200) |
| 0.0 | 0.1 | GO:0009423 | chorismate biosynthetic process(GO:0009423) |
| 0.0 | 0.1 | GO:0010103 | stomatal complex morphogenesis(GO:0010103) |
| 0.0 | 0.2 | GO:0010187 | negative regulation of seed germination(GO:0010187) |
| 0.0 | 0.1 | GO:0010158 | abaxial cell fate specification(GO:0010158) |
| 0.0 | 0.1 | GO:0006116 | NADH oxidation(GO:0006116) |
| 0.0 | 0.0 | GO:1902446 | regulation of shade avoidance(GO:1902446) positive regulation of shade avoidance(GO:1902448) |
| 0.0 | 0.1 | GO:0006570 | tyrosine metabolic process(GO:0006570) |
| 0.0 | 0.6 | GO:0071368 | cellular response to cytokinin stimulus(GO:0071368) |
Gene overrepresentation in cellular component category:
| Log-likelihood per target | Total log-likelihood | Term | Description |
|---|---|---|---|
| 0.1 | 0.4 | GO:0016461 | unconventional myosin complex(GO:0016461) |
| 0.1 | 0.4 | GO:0005687 | U4 snRNP(GO:0005687) |
| 0.1 | 0.3 | GO:0010330 | cellulose synthase complex(GO:0010330) |
| 0.0 | 0.3 | GO:0033180 | proton-transporting V-type ATPase, V1 domain(GO:0033180) |
| 0.0 | 1.0 | GO:0031012 | extracellular matrix(GO:0031012) |
| 0.0 | 0.5 | GO:0017119 | Golgi transport complex(GO:0017119) |
| 0.0 | 0.2 | GO:0009897 | external side of plasma membrane(GO:0009897) |
| 0.0 | 0.4 | GO:0030688 | preribosome, small subunit precursor(GO:0030688) |
| 0.0 | 0.2 | GO:0034426 | etioplast envelope(GO:0034425) etioplast membrane(GO:0034426) |
| 0.0 | 0.3 | GO:0005956 | protein kinase CK2 complex(GO:0005956) |
| 0.0 | 0.1 | GO:0008622 | epsilon DNA polymerase complex(GO:0008622) |
| 0.0 | 0.2 | GO:0009346 | citrate lyase complex(GO:0009346) |
| 0.0 | 0.1 | GO:0009501 | amyloplast(GO:0009501) |
| 0.0 | 0.1 | GO:0031314 | extrinsic component of mitochondrial inner membrane(GO:0031314) |
| 0.0 | 0.2 | GO:0005664 | origin recognition complex(GO:0000808) nuclear origin of replication recognition complex(GO:0005664) |
| 0.0 | 0.3 | GO:0031428 | box C/D snoRNP complex(GO:0031428) |
| 0.0 | 0.1 | GO:0034274 | Atg12-Atg5-Atg16 complex(GO:0034274) |
| 0.0 | 0.2 | GO:0005847 | mRNA cleavage and polyadenylation specificity factor complex(GO:0005847) |
| 0.0 | 0.2 | GO:0035618 | root hair(GO:0035618) |
| 0.0 | 0.2 | GO:0031464 | Cul4A-RING E3 ubiquitin ligase complex(GO:0031464) |
| 0.0 | 0.1 | GO:0005846 | nuclear cap binding complex(GO:0005846) |
| 0.0 | 0.1 | GO:0044613 | nuclear pore central transport channel(GO:0044613) |
| 0.0 | 0.1 | GO:0031021 | interphase microtubule organizing center(GO:0031021) |
| 0.0 | 0.1 | GO:0005776 | autophagosome(GO:0005776) |
| 0.0 | 0.5 | GO:0000118 | histone deacetylase complex(GO:0000118) |
| 0.0 | 0.2 | GO:0005834 | heterotrimeric G-protein complex(GO:0005834) |
| 0.0 | 0.1 | GO:0042721 | mitochondrial inner membrane protein insertion complex(GO:0042721) |
| 0.0 | 0.2 | GO:0045257 | mitochondrial respiratory chain complex II, succinate dehydrogenase complex (ubiquinone)(GO:0005749) succinate dehydrogenase complex (ubiquinone)(GO:0045257) fumarate reductase complex(GO:0045283) |
| 0.0 | 0.3 | GO:0005758 | mitochondrial intermembrane space(GO:0005758) |
| 0.0 | 3.1 | GO:0046658 | anchored component of plasma membrane(GO:0046658) |
| 0.0 | 0.3 | GO:0000148 | 1,3-beta-D-glucan synthase complex(GO:0000148) |
| 0.0 | 1.2 | GO:0090406 | pollen tube(GO:0090406) |
| 0.0 | 0.4 | GO:0005686 | U2 snRNP(GO:0005686) |
| 0.0 | 0.2 | GO:0009898 | cytoplasmic side of plasma membrane(GO:0009898) |
| 0.0 | 0.2 | GO:0044450 | microtubule organizing center part(GO:0044450) |
| 0.0 | 0.2 | GO:0005832 | chaperonin-containing T-complex(GO:0005832) |
| 0.0 | 0.1 | GO:0031588 | nucleotide-activated protein kinase complex(GO:0031588) |
| 0.0 | 0.1 | GO:0010316 | pyrophosphate-dependent phosphofructokinase complex(GO:0010316) |
| 0.0 | 1.7 | GO:0022627 | cytosolic small ribosomal subunit(GO:0022627) |
| 0.0 | 0.4 | GO:0005680 | anaphase-promoting complex(GO:0005680) |
| 0.0 | 0.1 | GO:0032541 | cortical endoplasmic reticulum(GO:0032541) |
| 0.0 | 0.2 | GO:0031519 | PcG protein complex(GO:0031519) |
| 0.0 | 0.6 | GO:0005764 | lysosome(GO:0005764) |
| 0.0 | 0.2 | GO:0005689 | U12-type spliceosomal complex(GO:0005689) |
| 0.0 | 0.2 | GO:0005769 | early endosome(GO:0005769) |
| 0.0 | 0.0 | GO:0044463 | cell projection part(GO:0044463) |
| 0.0 | 0.3 | GO:0000781 | chromosome, telomeric region(GO:0000781) |
| 0.0 | 0.3 | GO:0005736 | DNA-directed RNA polymerase I complex(GO:0005736) |
| 0.0 | 0.1 | GO:0030131 | clathrin adaptor complex(GO:0030131) |
| 0.0 | 0.6 | GO:0005770 | late endosome(GO:0005770) |
| 0.0 | 1.2 | GO:0031225 | anchored component of membrane(GO:0031225) |
| 0.0 | 0.1 | GO:0009331 | glycerol-3-phosphate dehydrogenase complex(GO:0009331) |
| 0.0 | 1.0 | GO:0031226 | intrinsic component of plasma membrane(GO:0031226) |
| 0.0 | 0.1 | GO:0010007 | magnesium chelatase complex(GO:0010007) |
Gene overrepresentation in molecular function category:
| Log-likelihood per target | Total log-likelihood | Term | Description |
|---|---|---|---|
| 0.3 | 1.1 | GO:0004556 | alpha-amylase activity(GO:0004556) |
| 0.2 | 0.9 | GO:0080103 | 4-methylthiopropyl glucosinolate S-oxygenase activity(GO:0080103) |
| 0.2 | 0.8 | GO:0036218 | dTTP diphosphatase activity(GO:0036218) |
| 0.2 | 3.2 | GO:0016157 | sucrose synthase activity(GO:0016157) |
| 0.2 | 0.6 | GO:0080045 | quercetin 3'-O-glucosyltransferase activity(GO:0080045) |
| 0.2 | 1.4 | GO:0090447 | glycerol-3-phosphate 2-O-acyltransferase activity(GO:0090447) |
| 0.2 | 0.5 | GO:0008519 | ammonium transmembrane transporter activity(GO:0008519) |
| 0.2 | 0.7 | GO:0050162 | oxalate oxidase activity(GO:0050162) |
| 0.2 | 0.8 | GO:0003979 | UDP-glucose 6-dehydrogenase activity(GO:0003979) |
| 0.1 | 0.7 | GO:0015186 | L-glutamine transmembrane transporter activity(GO:0015186) |
| 0.1 | 0.5 | GO:0019172 | glyoxalase III activity(GO:0019172) |
| 0.1 | 0.8 | GO:0050062 | long-chain-fatty-acyl-CoA reductase activity(GO:0050062) |
| 0.1 | 0.5 | GO:0016712 | oxidoreductase activity, acting on paired donors, with incorporation or reduction of molecular oxygen, reduced flavin or flavoprotein as one donor, and incorporation of one atom of oxygen(GO:0016712) aromatase activity(GO:0070330) |
| 0.1 | 0.4 | GO:0045548 | phenylalanine ammonia-lyase activity(GO:0045548) |
| 0.1 | 0.6 | GO:0015369 | calcium:proton antiporter activity(GO:0015369) |
| 0.1 | 0.5 | GO:0016724 | ferroxidase activity(GO:0004322) oxidoreductase activity, oxidizing metal ions, oxygen as acceptor(GO:0016724) |
| 0.1 | 0.4 | GO:0003852 | 2-isopropylmalate synthase activity(GO:0003852) |
| 0.1 | 0.4 | GO:0016856 | racemase and epimerase activity, acting on hydroxy acids and derivatives(GO:0016856) |
| 0.1 | 0.3 | GO:0052901 | spermine:oxygen oxidoreductase (spermidine-forming) activity(GO:0052901) |
| 0.1 | 0.3 | GO:0008517 | folic acid transporter activity(GO:0008517) |
| 0.1 | 0.5 | GO:0004310 | farnesyl-diphosphate farnesyltransferase activity(GO:0004310) squalene synthase activity(GO:0051996) |
| 0.1 | 0.3 | GO:0047150 | S-adenosylmethionine-homocysteine S-methyltransferase activity(GO:0008898) betaine-homocysteine S-methyltransferase activity(GO:0047150) |
| 0.1 | 0.6 | GO:0047274 | galactinol-sucrose galactosyltransferase activity(GO:0047274) |
| 0.1 | 0.3 | GO:0018685 | alkane 1-monooxygenase activity(GO:0018685) |
| 0.1 | 0.3 | GO:0047804 | cysteine-S-conjugate beta-lyase activity(GO:0047804) |
| 0.1 | 0.6 | GO:0016621 | cinnamoyl-CoA reductase activity(GO:0016621) |
| 0.1 | 0.3 | GO:0042781 | 3'-tRNA processing endoribonuclease activity(GO:0042781) |
| 0.1 | 0.2 | GO:0001216 | bacterial-type RNA polymerase transcription factor activity, sequence-specific DNA binding(GO:0001130) bacterial-type RNA polymerase transcriptional activator activity, sequence-specific DNA binding(GO:0001216) |
| 0.1 | 0.2 | GO:0000248 | C-5 sterol desaturase activity(GO:0000248) |
| 0.1 | 0.3 | GO:0097363 | protein O-GlcNAc transferase activity(GO:0097363) |
| 0.1 | 0.6 | GO:0003999 | adenine phosphoribosyltransferase activity(GO:0003999) |
| 0.1 | 1.6 | GO:0022839 | calcium activated cation channel activity(GO:0005227) ion gated channel activity(GO:0022839) |
| 0.1 | 0.3 | GO:0046592 | polyamine oxidase activity(GO:0046592) |
| 0.1 | 1.2 | GO:0004427 | inorganic diphosphatase activity(GO:0004427) |
| 0.1 | 0.4 | GO:0050734 | hydroxycinnamoyltransferase activity(GO:0050734) |
| 0.1 | 0.4 | GO:0015367 | oxoglutarate:malate antiporter activity(GO:0015367) |
| 0.1 | 0.2 | GO:0003962 | cystathionine gamma-synthase activity(GO:0003962) |
| 0.1 | 0.3 | GO:0004348 | glucosylceramidase activity(GO:0004348) |
| 0.1 | 0.4 | GO:0016531 | copper chaperone activity(GO:0016531) |
| 0.1 | 0.2 | GO:0034596 | phosphatidylinositol phosphate 4-phosphatase activity(GO:0034596) phosphatidylinositol-4-phosphate phosphatase activity(GO:0043812) |
| 0.1 | 0.6 | GO:0035673 | oligopeptide transmembrane transporter activity(GO:0035673) peptide transmembrane transporter activity(GO:1904680) |
| 0.1 | 0.2 | GO:0016277 | [myelin basic protein]-arginine N-methyltransferase activity(GO:0016277) |
| 0.1 | 0.8 | GO:0047259 | glucomannan 4-beta-mannosyltransferase activity(GO:0047259) |
| 0.1 | 0.3 | GO:0033836 | flavonol 7-O-beta-glucosyltransferase activity(GO:0033836) |
| 0.1 | 0.9 | GO:0003978 | UDP-glucose 4-epimerase activity(GO:0003978) |
| 0.1 | 1.8 | GO:0008810 | cellulase activity(GO:0008810) |
| 0.1 | 0.3 | GO:0005354 | galactose transmembrane transporter activity(GO:0005354) |
| 0.1 | 0.5 | GO:0033201 | starch synthase activity(GO:0009011) alpha-1,4-glucan synthase activity(GO:0033201) |
| 0.1 | 1.2 | GO:0005199 | structural constituent of cell wall(GO:0005199) |
| 0.1 | 0.4 | GO:0008381 | mechanically-gated ion channel activity(GO:0008381) mechanically gated channel activity(GO:0022833) |
| 0.1 | 0.2 | GO:0019776 | Atg8 ligase activity(GO:0019776) Atg8 activating enzyme activity(GO:0019779) |
| 0.1 | 0.3 | GO:0004028 | 3-chloroallyl aldehyde dehydrogenase activity(GO:0004028) |
| 0.1 | 0.3 | GO:0045544 | gibberellin 20-oxidase activity(GO:0045544) |
| 0.1 | 0.3 | GO:0010295 | (+)-abscisic acid 8'-hydroxylase activity(GO:0010295) |
| 0.1 | 0.2 | GO:0080097 | L-tryptophan:pyruvate aminotransferase activity(GO:0080097) |
| 0.1 | 0.2 | GO:0015136 | sialic acid transmembrane transporter activity(GO:0015136) |
| 0.1 | 0.8 | GO:0004332 | fructose-bisphosphate aldolase activity(GO:0004332) |
| 0.1 | 0.6 | GO:0015112 | nitrate transmembrane transporter activity(GO:0015112) |
| 0.1 | 0.2 | GO:1901474 | L-ornithine transmembrane transporter activity(GO:0000064) azole transmembrane transporter activity(GO:1901474) |
| 0.1 | 0.3 | GO:0052654 | L-leucine transaminase activity(GO:0052654) L-valine transaminase activity(GO:0052655) L-isoleucine transaminase activity(GO:0052656) |
| 0.1 | 1.2 | GO:0052716 | hydroquinone:oxygen oxidoreductase activity(GO:0052716) |
| 0.1 | 0.5 | GO:0010436 | carotenoid dioxygenase activity(GO:0010436) |
| 0.1 | 1.9 | GO:0008553 | hydrogen-exporting ATPase activity, phosphorylative mechanism(GO:0008553) |
| 0.1 | 0.2 | GO:0016726 | oxidoreductase activity, acting on CH or CH2 groups, NAD or NADP as acceptor(GO:0016726) |
| 0.0 | 0.9 | GO:0015386 | potassium:proton antiporter activity(GO:0015386) |
| 0.0 | 0.1 | GO:0016618 | hydroxypyruvate reductase activity(GO:0016618) |
| 0.0 | 0.3 | GO:0050378 | UDP-glucuronate 4-epimerase activity(GO:0050378) |
| 0.0 | 0.3 | GO:0004449 | isocitrate dehydrogenase (NAD+) activity(GO:0004449) |
| 0.0 | 0.1 | GO:0036310 | annealing helicase activity(GO:0036310) |
| 0.0 | 0.3 | GO:0001872 | (1->3)-beta-D-glucan binding(GO:0001872) |
| 0.0 | 0.4 | GO:0015271 | outward rectifier potassium channel activity(GO:0015271) |
| 0.0 | 0.2 | GO:0017077 | oxidative phosphorylation uncoupler activity(GO:0017077) |
| 0.0 | 1.8 | GO:0000156 | phosphorelay response regulator activity(GO:0000156) |
| 0.0 | 0.3 | GO:0004376 | glycolipid mannosyltransferase activity(GO:0004376) |
| 0.0 | 0.2 | GO:0004475 | mannose-1-phosphate guanylyltransferase activity(GO:0004475) |
| 0.0 | 0.3 | GO:0015165 | pyrimidine nucleotide-sugar transmembrane transporter activity(GO:0015165) |
| 0.0 | 0.3 | GO:0008199 | ferric iron binding(GO:0008199) |
| 0.0 | 0.3 | GO:0048027 | mRNA 5'-UTR binding(GO:0048027) |
| 0.0 | 0.2 | GO:0010296 | prenylcysteine methylesterase activity(GO:0010296) |
| 0.0 | 0.4 | GO:0004020 | adenylylsulfate kinase activity(GO:0004020) |
| 0.0 | 0.2 | GO:0004594 | pantothenate kinase activity(GO:0004594) |
| 0.0 | 0.2 | GO:0004737 | pyruvate decarboxylase activity(GO:0004737) |
| 0.0 | 0.4 | GO:0048040 | UDP-glucuronate decarboxylase activity(GO:0048040) |
| 0.0 | 0.1 | GO:0004828 | serine-tRNA ligase activity(GO:0004828) |
| 0.0 | 0.7 | GO:0015086 | cadmium ion transmembrane transporter activity(GO:0015086) |
| 0.0 | 1.0 | GO:0004805 | trehalose-phosphatase activity(GO:0004805) |
| 0.0 | 0.3 | GO:0009979 | 16:0 monogalactosyldiacylglycerol desaturase activity(GO:0009979) |
| 0.0 | 0.1 | GO:0042577 | sphingosine-1-phosphate phosphatase activity(GO:0042392) lipid phosphatase activity(GO:0042577) |
| 0.0 | 0.6 | GO:0019707 | protein-cysteine S-palmitoyltransferase activity(GO:0019706) protein-cysteine S-acyltransferase activity(GO:0019707) |
| 0.0 | 0.1 | GO:0008192 | mRNA guanylyltransferase activity(GO:0004484) polynucleotide 5'-phosphatase activity(GO:0004651) RNA guanylyltransferase activity(GO:0008192) |
| 0.0 | 0.4 | GO:0008028 | monocarboxylic acid transmembrane transporter activity(GO:0008028) |
| 0.0 | 0.1 | GO:0008703 | 5-amino-6-(5-phosphoribosylamino)uracil reductase activity(GO:0008703) |
| 0.0 | 0.1 | GO:0008297 | single-stranded DNA exodeoxyribonuclease activity(GO:0008297) |
| 0.0 | 0.6 | GO:0004675 | transmembrane receptor protein serine/threonine kinase activity(GO:0004675) |
| 0.0 | 0.1 | GO:0046409 | p-coumarate 3-hydroxylase activity(GO:0046409) |
| 0.0 | 0.2 | GO:0022829 | porin activity(GO:0015288) wide pore channel activity(GO:0022829) |
| 0.0 | 0.2 | GO:0004614 | phosphoglucomutase activity(GO:0004614) |
| 0.0 | 0.2 | GO:0003985 | acetyl-CoA C-acetyltransferase activity(GO:0003985) C-acetyltransferase activity(GO:0016453) |
| 0.0 | 0.2 | GO:0008177 | succinate dehydrogenase (ubiquinone) activity(GO:0008177) |
| 0.0 | 0.2 | GO:0015172 | acidic amino acid transmembrane transporter activity(GO:0015172) |
| 0.0 | 0.3 | GO:0004143 | diacylglycerol kinase activity(GO:0004143) |
| 0.0 | 0.2 | GO:0003878 | ATP citrate synthase activity(GO:0003878) |
| 0.0 | 0.3 | GO:0009922 | fatty acid elongase activity(GO:0009922) |
| 0.0 | 0.2 | GO:0003983 | UTP:glucose-1-phosphate uridylyltransferase activity(GO:0003983) |
| 0.0 | 0.2 | GO:0031683 | G-protein coupled receptor binding(GO:0001664) G-protein beta/gamma-subunit complex binding(GO:0031683) |
| 0.0 | 0.1 | GO:0080116 | glucuronoxylan glucuronosyltransferase activity(GO:0080116) |
| 0.0 | 0.3 | GO:0003691 | double-stranded telomeric DNA binding(GO:0003691) |
| 0.0 | 0.1 | GO:0004071 | aspartate-ammonia ligase activity(GO:0004071) |
| 0.0 | 0.2 | GO:0046975 | histone methyltransferase activity (H3-K36 specific)(GO:0046975) |
| 0.0 | 0.3 | GO:0008506 | sucrose:proton symporter activity(GO:0008506) |
| 0.0 | 0.1 | GO:0033897 | ribonuclease T2 activity(GO:0033897) |
| 0.0 | 0.1 | GO:0052739 | phosphatidylserine 1-acylhydrolase activity(GO:0052739) 1-acyl-2-lysophosphatidylserine acylhydrolase activity(GO:0052740) |
| 0.0 | 0.1 | GO:0016653 | oxidoreductase activity, acting on NAD(P)H, heme protein as acceptor(GO:0016653) |
| 0.0 | 0.1 | GO:0004473 | malate dehydrogenase (decarboxylating) (NADP+) activity(GO:0004473) |
| 0.0 | 0.5 | GO:0005381 | iron ion transmembrane transporter activity(GO:0005381) |
| 0.0 | 0.7 | GO:0004725 | protein tyrosine phosphatase activity(GO:0004725) |
| 0.0 | 0.3 | GO:0004784 | superoxide dismutase activity(GO:0004784) oxidoreductase activity, acting on superoxide radicals as acceptor(GO:0016721) |
| 0.0 | 0.1 | GO:0004679 | AMP-activated protein kinase activity(GO:0004679) |
| 0.0 | 0.1 | GO:0016855 | racemase and epimerase activity, acting on amino acids and derivatives(GO:0016855) racemase activity, acting on amino acids and derivatives(GO:0036361) amino-acid racemase activity(GO:0047661) |
| 0.0 | 0.3 | GO:0004806 | triglyceride lipase activity(GO:0004806) |
| 0.0 | 0.2 | GO:0071617 | lysophospholipid acyltransferase activity(GO:0071617) |
| 0.0 | 0.2 | GO:0016464 | chloroplast protein-transporting ATPase activity(GO:0016464) |
| 0.0 | 0.1 | GO:0008430 | selenium binding(GO:0008430) |
| 0.0 | 0.3 | GO:0103075 | indole-3-pyruvate monooxygenase activity(GO:0103075) |
| 0.0 | 0.1 | GO:0050291 | sphingosine N-acyltransferase activity(GO:0050291) |
| 0.0 | 0.1 | GO:0005093 | Rab GDP-dissociation inhibitor activity(GO:0005093) |
| 0.0 | 0.3 | GO:0008526 | phosphatidylinositol transporter activity(GO:0008526) |
| 0.0 | 0.2 | GO:0004351 | glutamate decarboxylase activity(GO:0004351) |
| 0.0 | 0.3 | GO:0004629 | phospholipase C activity(GO:0004629) |
| 0.0 | 0.1 | GO:0016985 | mannan endo-1,4-beta-mannosidase activity(GO:0016985) |
| 0.0 | 0.1 | GO:0047724 | inosine nucleosidase activity(GO:0047724) |
| 0.0 | 0.6 | GO:0045309 | protein phosphorylated amino acid binding(GO:0045309) phosphoprotein binding(GO:0051219) |
| 0.0 | 0.4 | GO:0042300 | beta-amyrin synthase activity(GO:0042300) |
| 0.0 | 0.4 | GO:0047196 | long-chain-alcohol O-fatty-acyltransferase activity(GO:0047196) |
| 0.0 | 0.9 | GO:0030145 | manganese ion binding(GO:0030145) |
| 0.0 | 0.1 | GO:0003913 | DNA photolyase activity(GO:0003913) |
| 0.0 | 0.1 | GO:0004605 | phosphatidate cytidylyltransferase activity(GO:0004605) |
| 0.0 | 0.1 | GO:0019784 | NEDD8-specific protease activity(GO:0019784) |
| 0.0 | 0.3 | GO:0016207 | 4-coumarate-CoA ligase activity(GO:0016207) |
| 0.0 | 0.1 | GO:1990841 | promoter-specific chromatin binding(GO:1990841) |
| 0.0 | 0.1 | GO:0060229 | phospholipase activator activity(GO:0016004) lipase activator activity(GO:0060229) |
| 0.0 | 0.6 | GO:0015385 | sodium:proton antiporter activity(GO:0015385) |
| 0.0 | 0.3 | GO:0003843 | 1,3-beta-D-glucan synthase activity(GO:0003843) |
| 0.0 | 0.6 | GO:0031624 | ubiquitin conjugating enzyme binding(GO:0031624) |
| 0.0 | 0.1 | GO:0031957 | very long-chain fatty acid-CoA ligase activity(GO:0031957) |
| 0.0 | 0.1 | GO:0030527 | structural constituent of chromatin(GO:0030527) |
| 0.0 | 0.1 | GO:0010309 | acireductone dioxygenase [iron(II)-requiring] activity(GO:0010309) |
| 0.0 | 0.1 | GO:0008936 | nicotinamidase activity(GO:0008936) |
| 0.0 | 0.1 | GO:0047498 | calcium-dependent phospholipase A2 activity(GO:0047498) |
| 0.0 | 0.2 | GO:0016847 | 1-aminocyclopropane-1-carboxylate synthase activity(GO:0016847) |
| 0.0 | 0.1 | GO:0043142 | ATP-dependent DNA helicase activity(GO:0004003) ATP-dependent helicase activity(GO:0008026) single-stranded DNA-dependent ATP-dependent DNA helicase activity(GO:0017116) single-stranded DNA-dependent ATPase activity(GO:0043142) purine NTP-dependent helicase activity(GO:0070035) |
| 0.0 | 0.2 | GO:0004032 | alditol:NADP+ 1-oxidoreductase activity(GO:0004032) |
| 0.0 | 1.2 | GO:0046910 | pectinesterase inhibitor activity(GO:0046910) |
| 0.0 | 0.1 | GO:0004416 | hydroxyacylglutathione hydrolase activity(GO:0004416) |
| 0.0 | 0.2 | GO:0004430 | 1-phosphatidylinositol 4-kinase activity(GO:0004430) |
| 0.0 | 0.3 | GO:0015250 | water transmembrane transporter activity(GO:0005372) water channel activity(GO:0015250) |
| 0.0 | 0.1 | GO:0052853 | very-long-chain-(S)-2-hydroxy-acid oxidase activity(GO:0052852) long-chain-(S)-2-hydroxy-long-chain-acid oxidase activity(GO:0052853) medium-chain-(S)-2-hydroxy-acid oxidase activity(GO:0052854) |
| 0.0 | 0.1 | GO:0047334 | diphosphate-fructose-6-phosphate 1-phosphotransferase activity(GO:0047334) |
| 0.0 | 0.3 | GO:0030599 | pectinesterase activity(GO:0030599) |
| 0.0 | 1.7 | GO:0015297 | antiporter activity(GO:0015297) |
| 0.0 | 0.1 | GO:0030943 | mitochondrion targeting sequence binding(GO:0030943) |
| 0.0 | 0.0 | GO:0019136 | deoxynucleoside kinase activity(GO:0019136) |
| 0.0 | 0.4 | GO:0047262 | polygalacturonate 4-alpha-galacturonosyltransferase activity(GO:0047262) |
| 0.0 | 1.8 | GO:0004722 | protein serine/threonine phosphatase activity(GO:0004722) |
| 0.0 | 0.3 | GO:0035064 | methylated histone binding(GO:0035064) |
| 0.0 | 0.1 | GO:0003680 | AT DNA binding(GO:0003680) |
| 0.0 | 0.6 | GO:0033558 | histone deacetylase activity(GO:0004407) protein deacetylase activity(GO:0033558) |
| 0.0 | 0.2 | GO:0044620 | ACP phosphopantetheine attachment site binding involved in fatty acid biosynthetic process(GO:0000036) ACP phosphopantetheine attachment site binding(GO:0044620) prosthetic group binding(GO:0051192) |
| 0.0 | 0.1 | GO:0004337 | geranyltranstransferase activity(GO:0004337) |
| 0.0 | 0.1 | GO:0010179 | IAA-Ala conjugate hydrolase activity(GO:0010179) |
| 0.0 | 0.1 | GO:0004821 | histidine-tRNA ligase activity(GO:0004821) |
| 0.0 | 0.5 | GO:0015205 | nucleobase transmembrane transporter activity(GO:0015205) |
| 0.0 | 0.1 | GO:0004383 | guanylate cyclase activity(GO:0004383) |
| 0.0 | 0.1 | GO:0008121 | ubiquinol-cytochrome-c reductase activity(GO:0008121) oxidoreductase activity, acting on diphenols and related substances as donors, cytochrome as acceptor(GO:0016681) |
| 0.0 | 0.1 | GO:0004001 | adenosine kinase activity(GO:0004001) |
| 0.0 | 0.1 | GO:0017022 | myosin binding(GO:0017022) |
| 0.0 | 0.9 | GO:0004197 | cysteine-type endopeptidase activity(GO:0004197) |
| 0.0 | 0.1 | GO:1990757 | ubiquitin ligase activator activity(GO:1990757) |
| 0.0 | 0.1 | GO:0102360 | flavonol 3-O-glucosyltransferase activity(GO:0047893) daphnetin 3-O-glucosyltransferase activity(GO:0102360) |
| 0.0 | 0.0 | GO:0051980 | iron chelate transmembrane transporter activity(GO:0015603) iron-nicotianamine transmembrane transporter activity(GO:0051980) |
| 0.0 | 0.1 | GO:0043024 | ribosomal small subunit binding(GO:0043024) |
| 0.0 | 0.0 | GO:0019789 | SUMO transferase activity(GO:0019789) |
| 0.0 | 0.1 | GO:0070547 | L-tyrosine:2-oxoglutarate aminotransferase activity(GO:0004838) L-tyrosine aminotransferase activity(GO:0070547) |
| 0.0 | 0.1 | GO:0017091 | AU-rich element binding(GO:0017091) |
| 0.0 | 0.9 | GO:0019901 | protein kinase binding(GO:0019901) |
| 0.0 | 0.4 | GO:0004721 | phosphoprotein phosphatase activity(GO:0004721) |
| 0.0 | 0.8 | GO:0004650 | polygalacturonase activity(GO:0004650) |
| 0.0 | 0.2 | GO:0016843 | amine-lyase activity(GO:0016843) |
| 0.0 | 0.1 | GO:0048487 | beta-tubulin binding(GO:0048487) |
| 0.0 | 0.3 | GO:0030898 | microfilament motor activity(GO:0000146) actin-dependent ATPase activity(GO:0030898) |
| 0.0 | 0.1 | GO:0010011 | auxin binding(GO:0010011) |
| 0.0 | 0.0 | GO:0004571 | mannosyl-oligosaccharide 1,2-alpha-mannosidase activity(GO:0004571) |
| 0.0 | 0.3 | GO:0097602 | cullin family protein binding(GO:0097602) |
| 0.0 | 0.7 | GO:0004712 | protein serine/threonine/tyrosine kinase activity(GO:0004712) |
| 0.0 | 0.3 | GO:0005179 | hormone activity(GO:0005179) |
| 0.0 | 0.2 | GO:0003688 | DNA replication origin binding(GO:0003688) |
| 0.0 | 0.2 | GO:0102338 | 3-oxo-arachidoyl-CoA synthase activity(GO:0102336) 3-oxo-cerotoyl-CoA synthase activity(GO:0102337) 3-oxo-lignoceronyl-CoA synthase activity(GO:0102338) |
| 0.0 | 0.4 | GO:0004222 | metalloendopeptidase activity(GO:0004222) |
| 0.0 | 0.3 | GO:0003954 | NADH dehydrogenase activity(GO:0003954) |
| 0.0 | 0.1 | GO:0035198 | miRNA binding(GO:0035198) |
| 0.0 | 0.6 | GO:0004364 | glutathione transferase activity(GO:0004364) |
| 0.0 | 0.1 | GO:0046933 | proton-transporting ATP synthase activity, rotational mechanism(GO:0046933) |
Gene overrepresentation in curated gene sets: canonical pathways category:
| Log-likelihood per target | Total log-likelihood | Term | Description |
|---|---|---|---|
| 0.1 | 0.9 | PID CXCR4 PATHWAY | CXCR4-mediated signaling events |
| 0.1 | 0.3 | PID EPHA FWDPATHWAY | EPHA forward signaling |
| 0.0 | 0.1 | ST INTEGRIN SIGNALING PATHWAY | Integrin Signaling Pathway |
| 0.0 | 0.0 | PID EPHA2 FWD PATHWAY | EPHA2 forward signaling |
| 0.0 | 0.1 | PID INTEGRIN1 PATHWAY | Beta1 integrin cell surface interactions |
| 0.0 | 0.2 | PID IL2 PI3K PATHWAY | IL2 signaling events mediated by PI3K |
| 0.0 | 0.2 | PID ERA GENOMIC PATHWAY | Validated nuclear estrogen receptor alpha network |
| 0.0 | 0.1 | PID IL8 CXCR2 PATHWAY | IL8- and CXCR2-mediated signaling events |
| 0.0 | 0.1 | PID HIF2PATHWAY | HIF-2-alpha transcription factor network |
| 0.0 | 0.2 | PID P53 DOWNSTREAM PATHWAY | Direct p53 effectors |
| 0.0 | 0.1 | PID HES HEY PATHWAY | Notch-mediated HES/HEY network |
| 0.0 | 0.0 | PID HIV NEF PATHWAY | HIV-1 Nef: Negative effector of Fas and TNF-alpha |
| 0.0 | 0.0 | SIG INSULIN RECEPTOR PATHWAY IN CARDIAC MYOCYTES | Genes related to the insulin receptor pathway |
Gene overrepresentation in curated gene sets: REACTOME pathways category:
| Log-likelihood per target | Total log-likelihood | Term | Description |
|---|---|---|---|
| 0.1 | 0.4 | REACTOME SYNTHESIS OF BILE ACIDS AND BILE SALTS | Genes involved in Synthesis of bile acids and bile salts |
| 0.1 | 0.3 | REACTOME SPRY REGULATION OF FGF SIGNALING | Genes involved in Spry regulation of FGF signaling |
| 0.1 | 0.2 | REACTOME REGULATION OF INSULIN SECRETION | Genes involved in Regulation of Insulin Secretion |
| 0.1 | 0.2 | REACTOME MTORC1 MEDIATED SIGNALLING | Genes involved in mTORC1-mediated signalling |
| 0.1 | 0.6 | REACTOME CHEMOKINE RECEPTORS BIND CHEMOKINES | Genes involved in Chemokine receptors bind chemokines |
| 0.1 | 0.3 | REACTOME PHASE II CONJUGATION | Genes involved in Phase II conjugation |
| 0.1 | 0.4 | REACTOME PLATELET ACTIVATION SIGNALING AND AGGREGATION | Genes involved in Platelet activation, signaling and aggregation |
| 0.0 | 0.1 | REACTOME PEROXISOMAL LIPID METABOLISM | Genes involved in Peroxisomal lipid metabolism |
| 0.0 | 0.1 | REACTOME NRAGE SIGNALS DEATH THROUGH JNK | Genes involved in NRAGE signals death through JNK |
| 0.0 | 0.2 | REACTOME INTRINSIC PATHWAY FOR APOPTOSIS | Genes involved in Intrinsic Pathway for Apoptosis |
| 0.0 | 0.2 | REACTOME BIOSYNTHESIS OF THE N GLYCAN PRECURSOR DOLICHOL LIPID LINKED OLIGOSACCHARIDE LLO AND TRANSFER TO A NASCENT PROTEIN | Genes involved in Biosynthesis of the N-glycan precursor (dolichol lipid-linked oligosaccharide, LLO) and transfer to a nascent protein |
| 0.0 | 0.1 | REACTOME ABACAVIR TRANSPORT AND METABOLISM | Genes involved in Abacavir transport and metabolism |
| 0.0 | 0.0 | REACTOME P75 NTR RECEPTOR MEDIATED SIGNALLING | Genes involved in p75 NTR receptor-mediated signalling |
| 0.0 | 0.1 | REACTOME INTEGRIN CELL SURFACE INTERACTIONS | Genes involved in Integrin cell surface interactions |
| 0.0 | 0.2 | REACTOME E2F ENABLED INHIBITION OF PRE REPLICATION COMPLEX FORMATION | Genes involved in E2F-enabled inhibition of pre-replication complex formation |
| 0.0 | 0.5 | REACTOME ABCA TRANSPORTERS IN LIPID HOMEOSTASIS | Genes involved in ABCA transporters in lipid homeostasis |
| 0.0 | 0.4 | REACTOME HEMOSTASIS | Genes involved in Hemostasis |
| 0.0 | 0.1 | REACTOME UNWINDING OF DNA | Genes involved in Unwinding of DNA |
| 0.0 | 0.1 | REACTOME ASPARAGINE N LINKED GLYCOSYLATION | Genes involved in Asparagine N-linked glycosylation |