Project
GSE130291:vernalization in Arabidopsis thaliana
Navigation
Downloads
Results for AT1G04100
Z-value: 0.03
Transcription factors associated with AT1G04100
| Gene Symbol | Gene ID | Gene Info |
|---|---|---|
|
AT1G04100
|
AT1G04100 | indoleacetic acid-induced protein 10 |
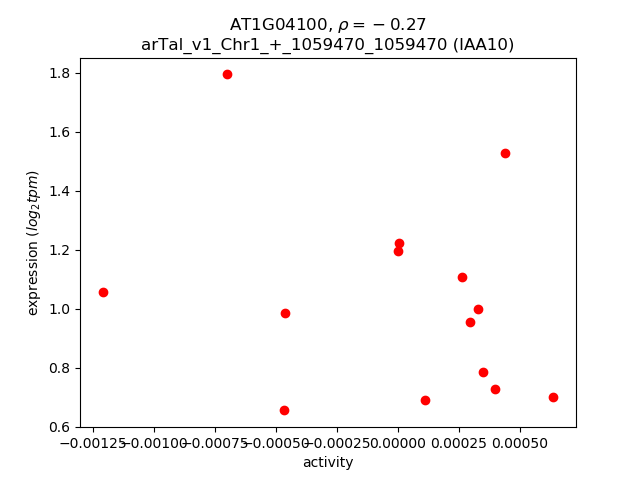
Activity-expression correlation:
| Gene | Promoter | Pearson corr. coef. | P-value | Plot |
|---|---|---|---|---|
| IAA10 | arTal_v1_Chr1_+_1059470_1059470 | -0.27 | 3.4e-01 | Click! |
Activity profile of AT1G04100 motif
Sorted Z-values of AT1G04100 motif
| Promoter | Log-likelihood | Transcript | Gene | Gene Info |
|---|---|---|---|---|
| arTal_v1_Chr1_-_10801093_10801093 | 0.03 |
AT1G30490.1
|
PHV
|
Homeobox-leucine zipper family protein / lipid-binding START domain-containing protein |
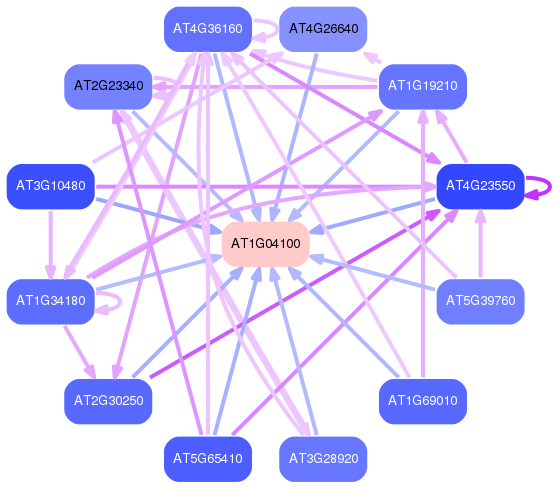
Network of associatons between targets according to the STRING database.
