Project
avrg: A549 cells infected with SARS-CoV-2 Analysis Results (GEO series: GSE147507)
Navigation
Downloads
Results for TLX2
Z-value: 1.42
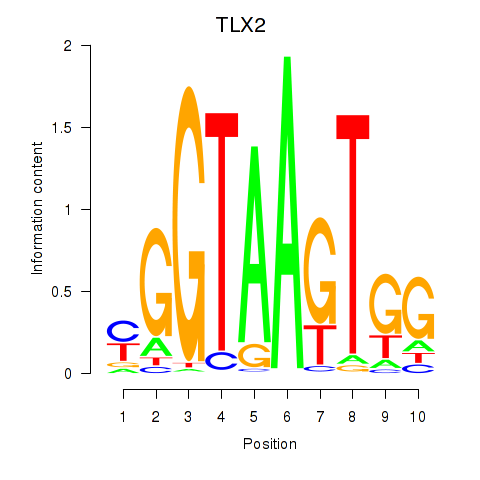
Motif logo
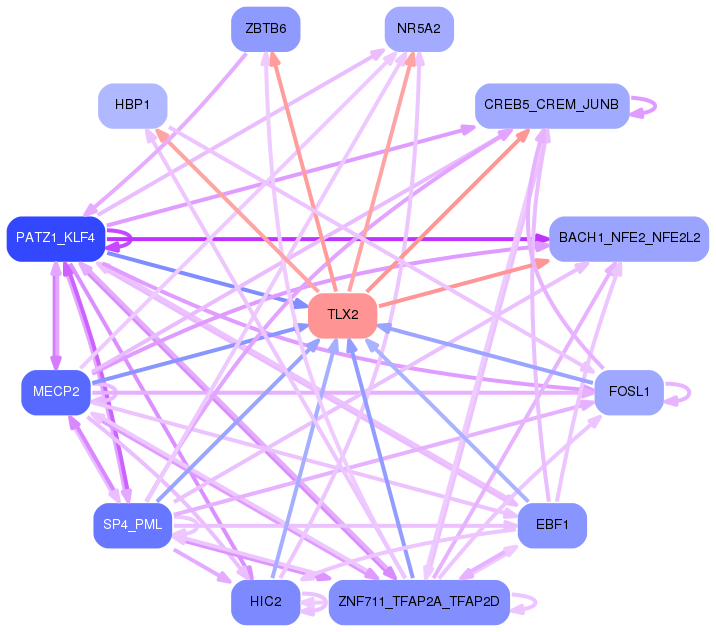
Transcription factors associated with TLX2
| Gene Symbol | Gene ID | Gene Info |
|---|---|---|
|
TLX2
|
ENSG00000115297.9 | T cell leukemia homeobox 2 |
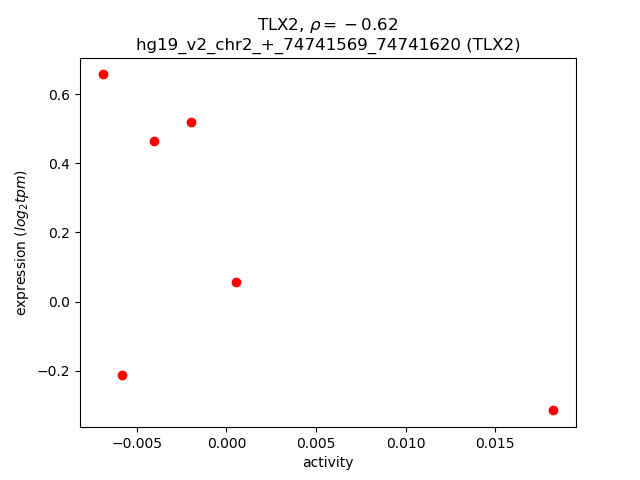
Activity-expression correlation:
| Gene | Promoter | Pearson corr. coef. | P-value | Plot |
|---|---|---|---|---|
| TLX2 | hg19_v2_chr2_+_74741569_74741620 | -0.62 | 1.9e-01 | Click! |