Project
avrg: A549 cells infected with SARS-CoV-2 Analysis Results (GEO series: GSE147507)
Navigation
Downloads
Results for TFDP1
Z-value: 0.83
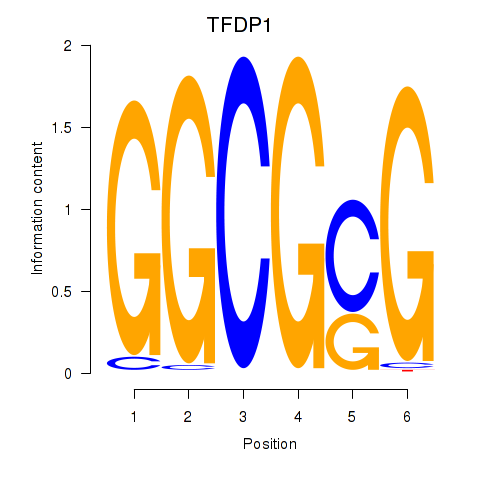
Motif logo
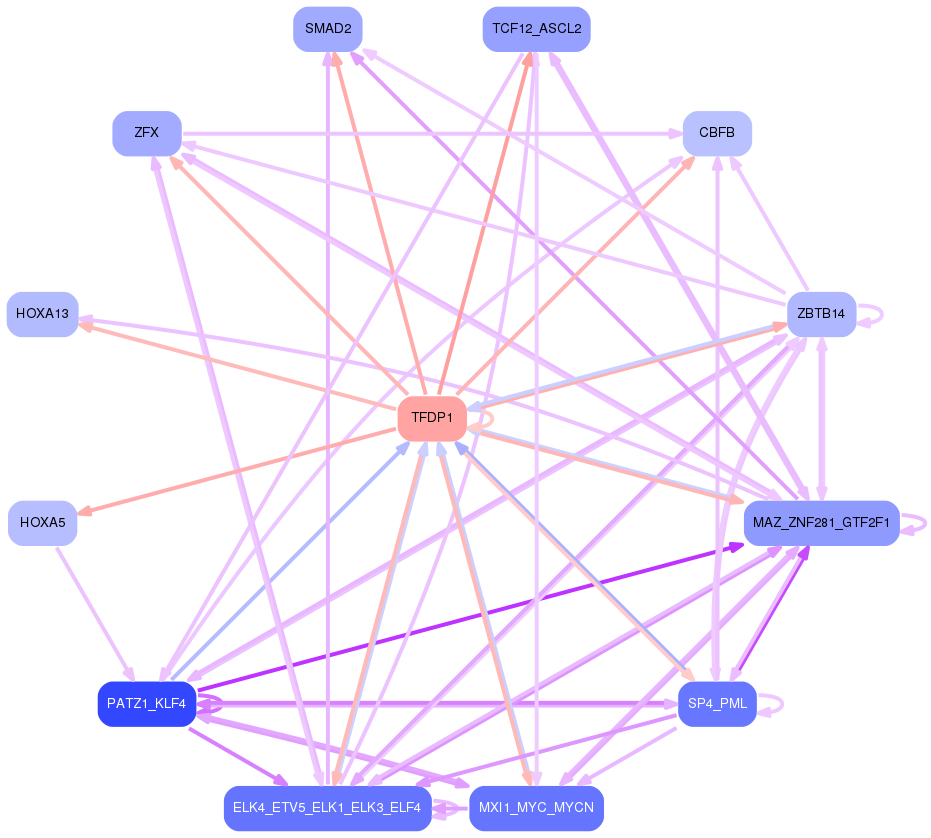
Transcription factors associated with TFDP1
| Gene Symbol | Gene ID | Gene Info |
|---|---|---|
|
TFDP1
|
ENSG00000198176.8 | transcription factor Dp-1 |
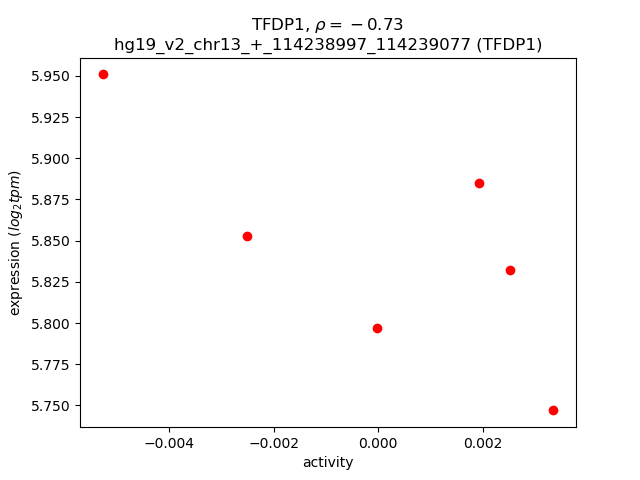
Activity-expression correlation:
| Gene | Promoter | Pearson corr. coef. | P-value | Plot |
|---|---|---|---|---|
| TFDP1 | hg19_v2_chr13_+_114238997_114239077 | -0.73 | 9.8e-02 | Click! |