Project
avrg: A549 cells infected with SARS-CoV-2 Analysis Results (GEO series: GSE147507)
Navigation
Downloads
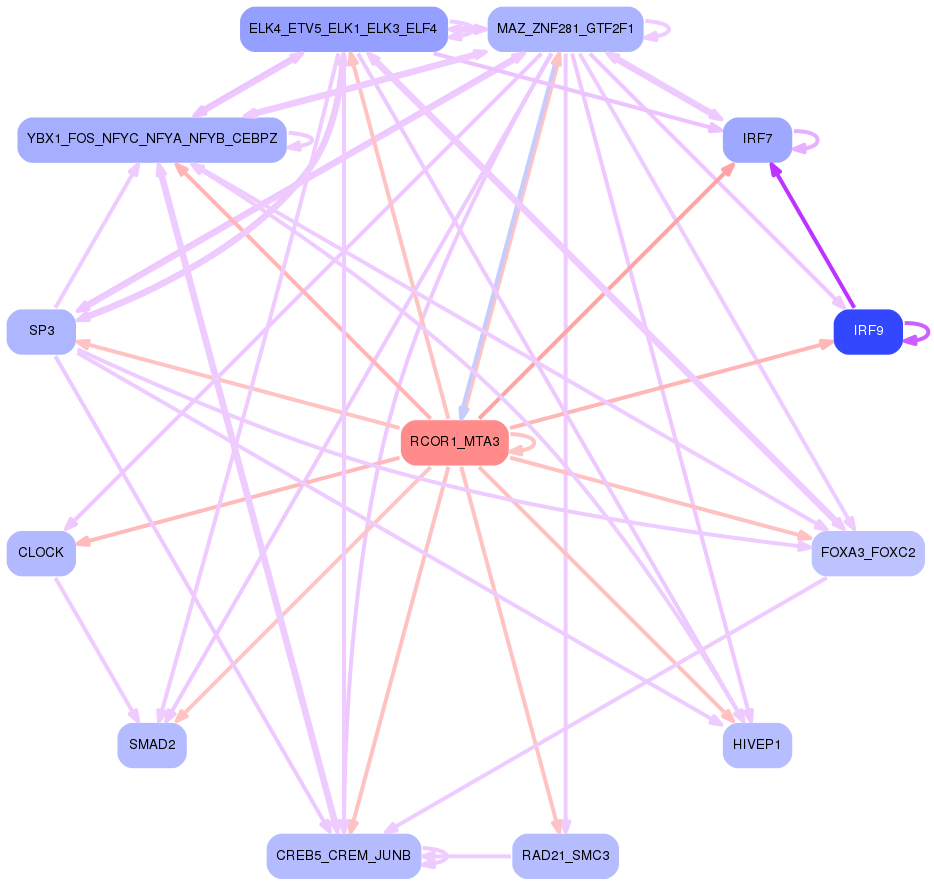
Results for RCOR1_MTA3
Z-value: 1.47
Motif logo
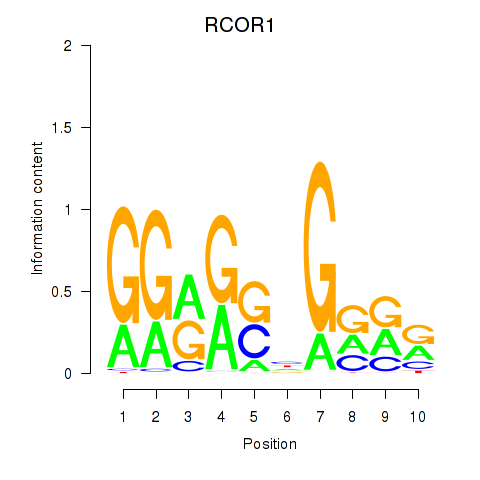
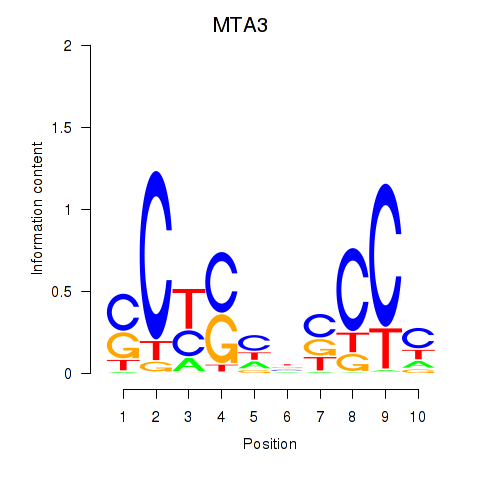
Transcription factors associated with RCOR1_MTA3
| Gene Symbol | Gene ID | Gene Info |
|---|---|---|
|
RCOR1
|
ENSG00000089902.8 | REST corepressor 1 |
|
MTA3
|
ENSG00000057935.9 | metastasis associated 1 family member 3 |
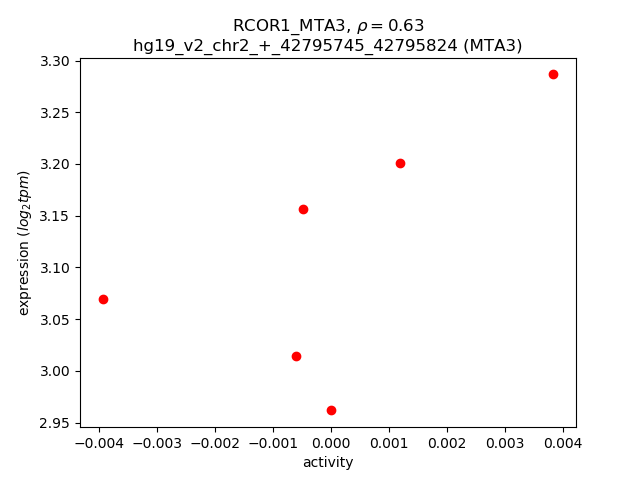
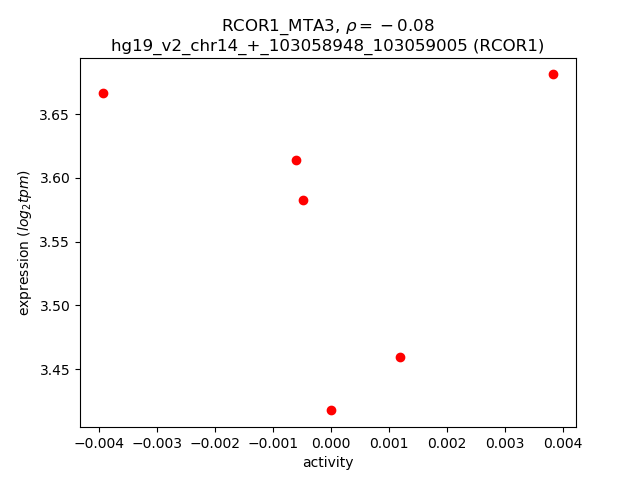
Activity-expression correlation:
| Gene | Promoter | Pearson corr. coef. | P-value | Plot |
|---|---|---|---|---|
| MTA3 | hg19_v2_chr2_+_42795745_42795824 | 0.63 | 1.8e-01 | Click! |
| RCOR1 | hg19_v2_chr14_+_103058948_103059005 | -0.08 | 8.7e-01 | Click! |