Project
avrg: A549 cells infected with SARS-CoV-2 Analysis Results (GEO series: GSE147507)
Navigation
Downloads
Results for PLAG1
Z-value: 0.67
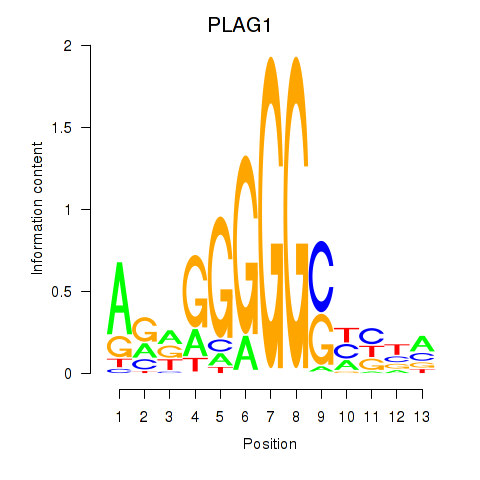
Motif logo
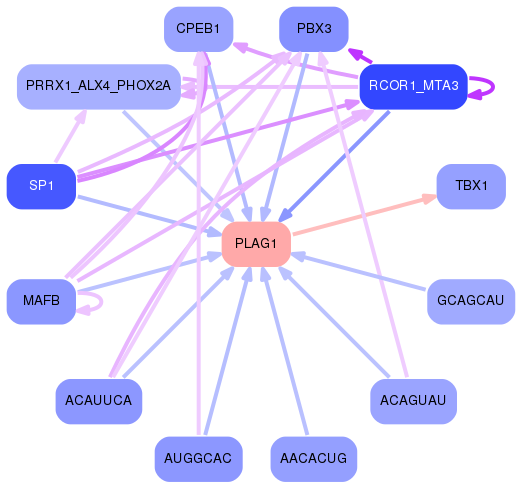
Transcription factors associated with PLAG1
| Gene Symbol | Gene ID | Gene Info |
|---|---|---|
|
PLAG1
|
ENSG00000181690.3 | PLAG1 zinc finger |
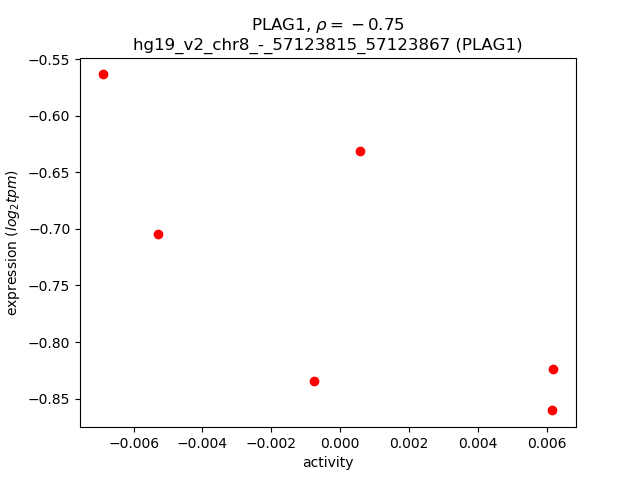
Activity-expression correlation:
| Gene | Promoter | Pearson corr. coef. | P-value | Plot |
|---|---|---|---|---|
| PLAG1 | hg19_v2_chr8_-_57123815_57123867 | -0.75 | 8.6e-02 | Click! |