Project
avrg: A549 cells infected with SARS-CoV-2 Analysis Results (GEO series: GSE147507)
Navigation
Downloads
Results for OLIG2_NEUROD1_ATOH1
Z-value: 1.41
Motif logo
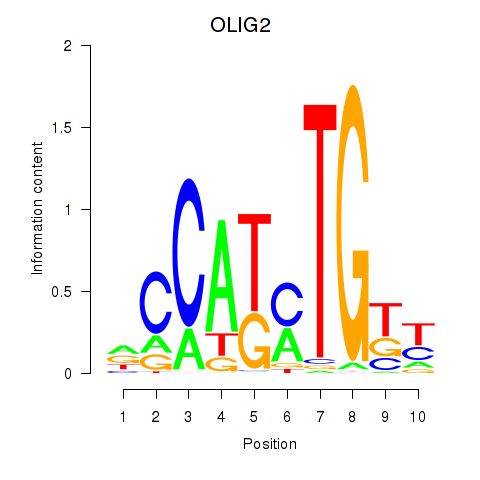
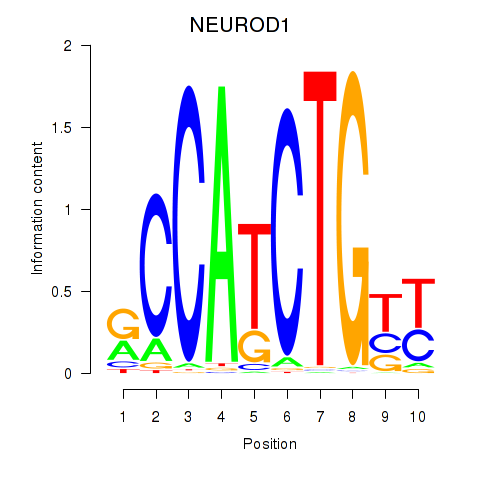
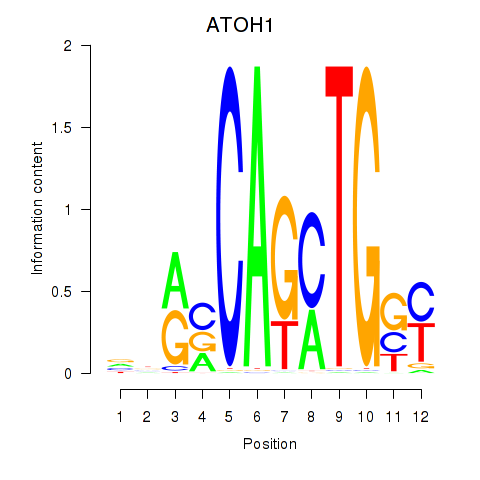
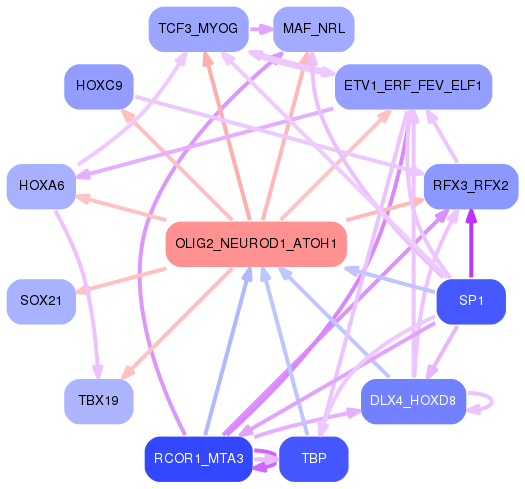
Transcription factors associated with OLIG2_NEUROD1_ATOH1
| Gene Symbol | Gene ID | Gene Info |
|---|---|---|
|
OLIG2
|
ENSG00000205927.4 | oligodendrocyte transcription factor 2 |
|
NEUROD1
|
ENSG00000162992.3 | neuronal differentiation 1 |
|
ATOH1
|
ENSG00000172238.3 | atonal bHLH transcription factor 1 |
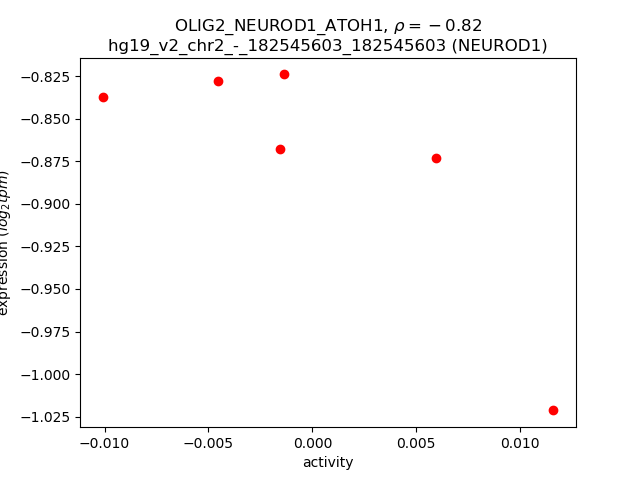
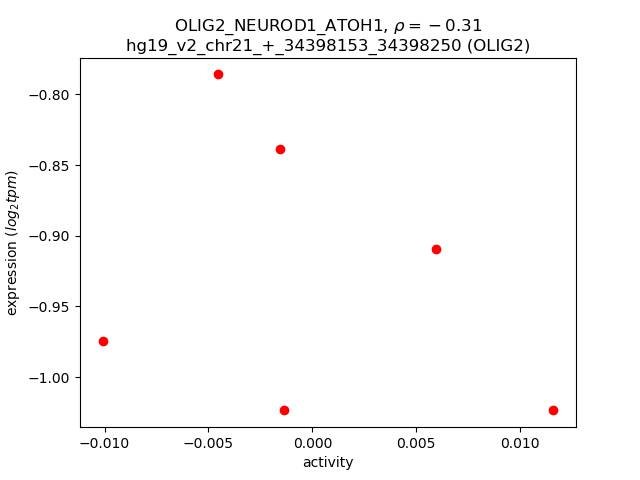
Activity-expression correlation:
| Gene | Promoter | Pearson corr. coef. | P-value | Plot |
|---|---|---|---|---|
| NEUROD1 | hg19_v2_chr2_-_182545603_182545603 | -0.82 | 4.4e-02 | Click! |
| OLIG2 | hg19_v2_chr21_+_34398153_34398250 | -0.31 | 5.5e-01 | Click! |