Project
avrg: A549 cells infected with SARS-CoV-2 Analysis Results (GEO series: GSE147507)
Navigation
Downloads
Results for NFIX_NFIB
Z-value: 1.93
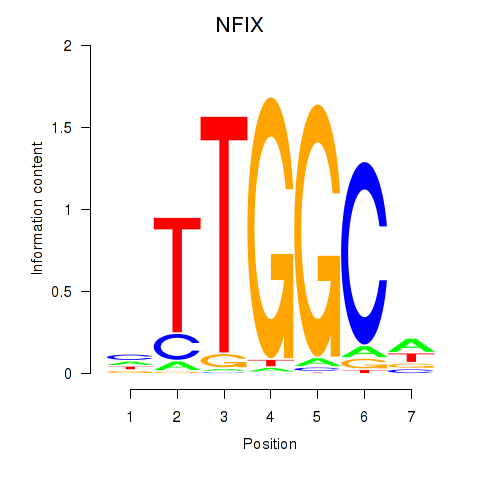
Motif logo

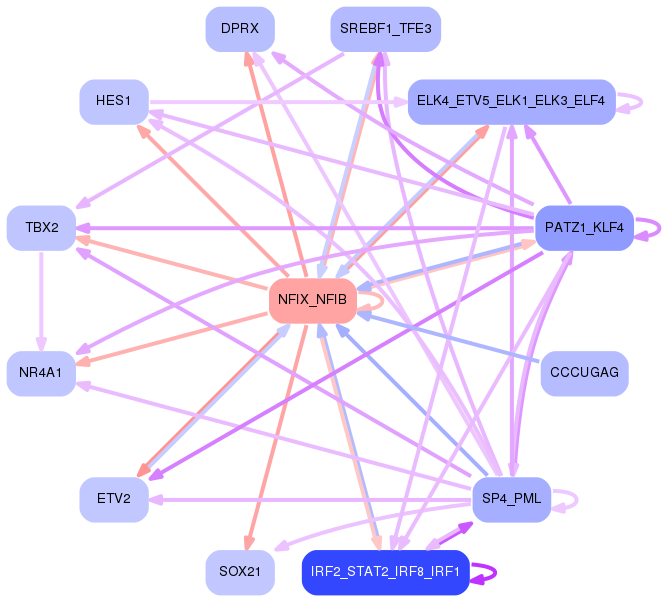
Transcription factors associated with NFIX_NFIB
| Gene Symbol | Gene ID | Gene Info |
|---|---|---|
|
NFIX
|
ENSG00000008441.12 | nuclear factor I X |
|
NFIB
|
ENSG00000147862.10 | nuclear factor I B |
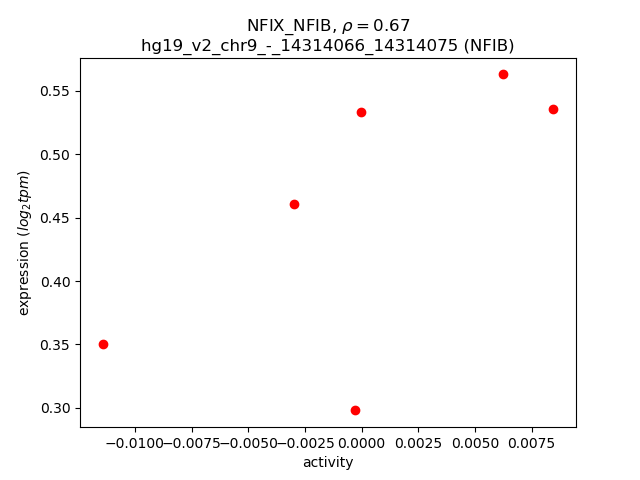
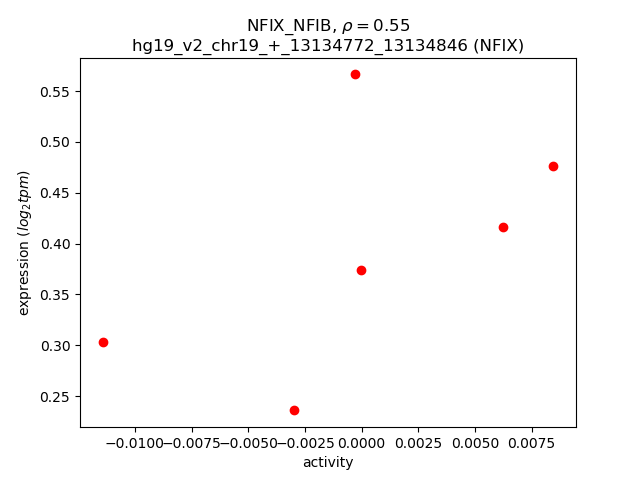
Activity-expression correlation:
| Gene | Promoter | Pearson corr. coef. | P-value | Plot |
|---|---|---|---|---|
| NFIB | hg19_v2_chr9_-_14314066_14314075 | 0.67 | 1.5e-01 | Click! |
| NFIX | hg19_v2_chr19_+_13134772_13134846 | 0.55 | 2.6e-01 | Click! |