Project
avrg: A549 cells infected with SARS-CoV-2 Analysis Results (GEO series: GSE147507)
Navigation
Downloads
Results for MECOM
Z-value: 1.07
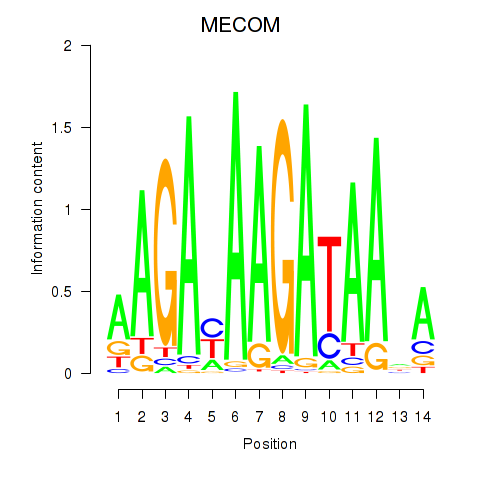
Motif logo
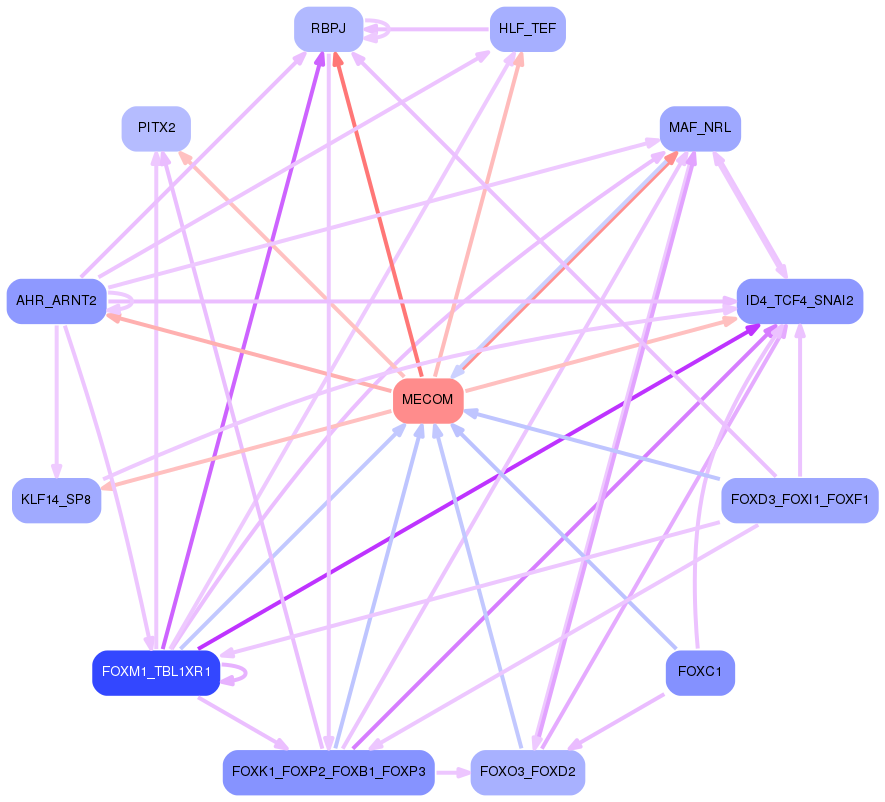
Transcription factors associated with MECOM
| Gene Symbol | Gene ID | Gene Info |
|---|---|---|
|
MECOM
|
ENSG00000085276.13 | MDS1 and EVI1 complex locus |
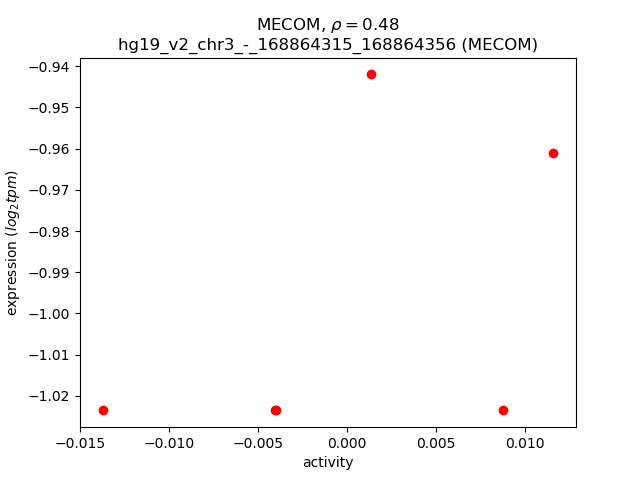
Activity-expression correlation:
| Gene | Promoter | Pearson corr. coef. | P-value | Plot |
|---|---|---|---|---|
| MECOM | hg19_v2_chr3_-_168864315_168864356 | 0.48 | 3.4e-01 | Click! |