Project
avrg: A549 cells infected with SARS-CoV-2 Analysis Results (GEO series: GSE147507)
Navigation
Downloads
Results for FLI1
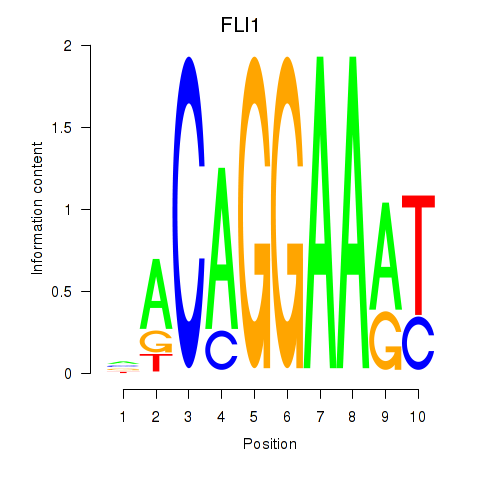
Z-value: 1.92
Motif logo
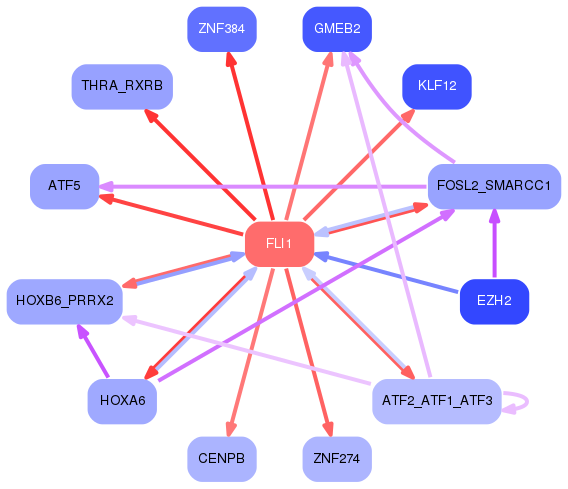
Transcription factors associated with FLI1
| Gene Symbol | Gene ID | Gene Info |
|---|---|---|
|
FLI1
|
ENSG00000151702.12 | Fli-1 proto-oncogene, ETS transcription factor |
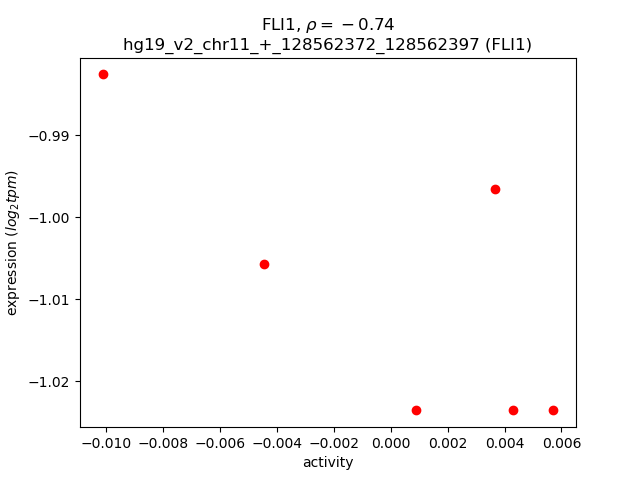
Activity-expression correlation:
| Gene | Promoter | Pearson corr. coef. | P-value | Plot |
|---|---|---|---|---|
| FLI1 | hg19_v2_chr11_+_128562372_128562397 | -0.74 | 8.9e-02 | Click! |