Project
avrg: A549 cells infected with SARS-CoV-2 Analysis Results (GEO series: GSE147507)
Navigation
Downloads
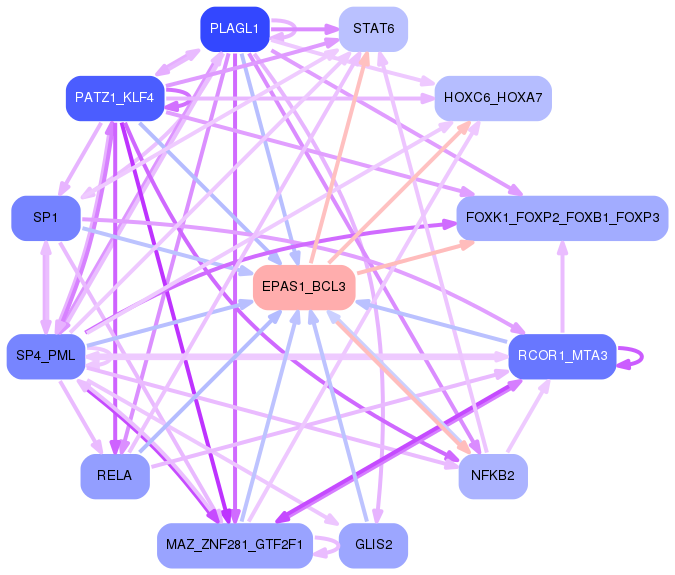
Results for EPAS1_BCL3
Z-value: 0.73
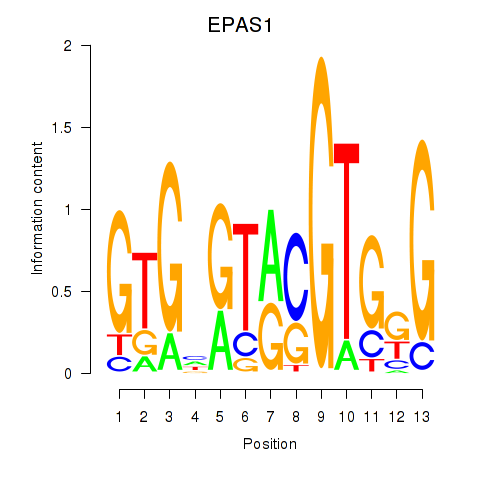
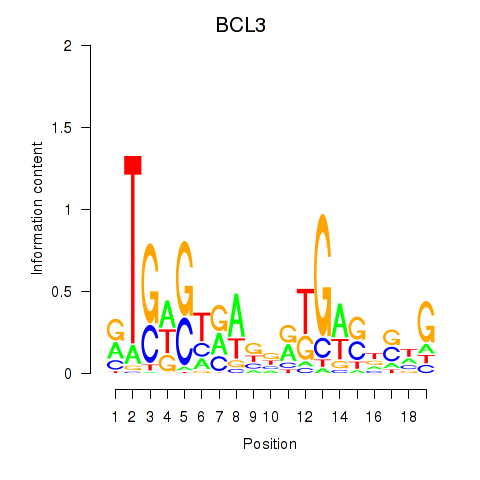
Motif logo
Transcription factors associated with EPAS1_BCL3
| Gene Symbol | Gene ID | Gene Info |
|---|---|---|
|
EPAS1
|
ENSG00000116016.9 | endothelial PAS domain protein 1 |
|
BCL3
|
ENSG00000069399.8 | BCL3 transcription coactivator |
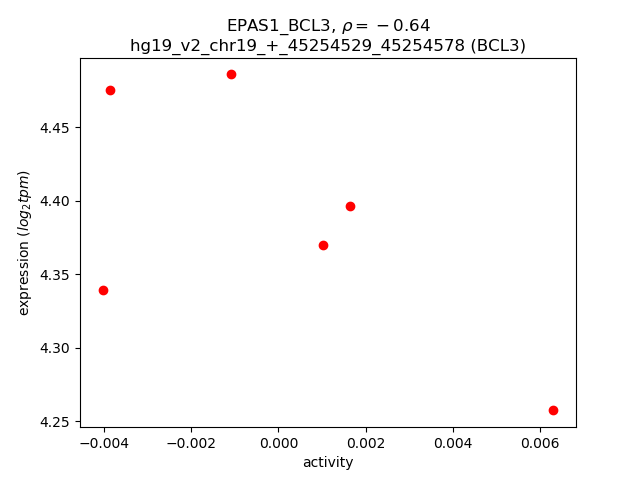
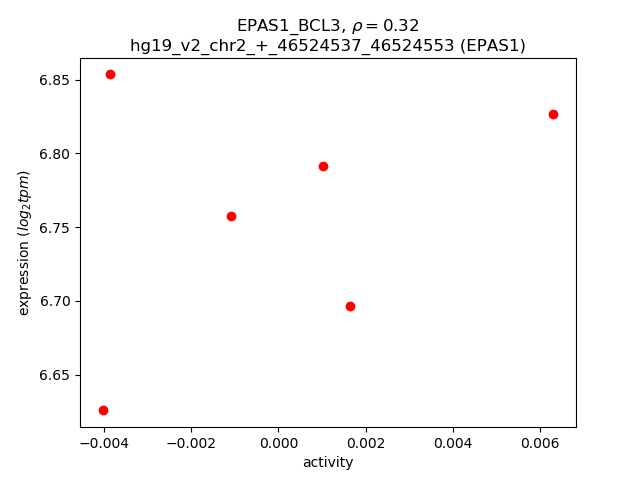
Activity-expression correlation:
| Gene | Promoter | Pearson corr. coef. | P-value | Plot |
|---|---|---|---|---|
| BCL3 | hg19_v2_chr19_+_45254529_45254578 | -0.64 | 1.7e-01 | Click! |
| EPAS1 | hg19_v2_chr2_+_46524537_46524553 | 0.32 | 5.4e-01 | Click! |