Project
avrg: A549 cells infected with SARS-CoV-2 Analysis Results (GEO series: GSE147507)
Navigation
Downloads
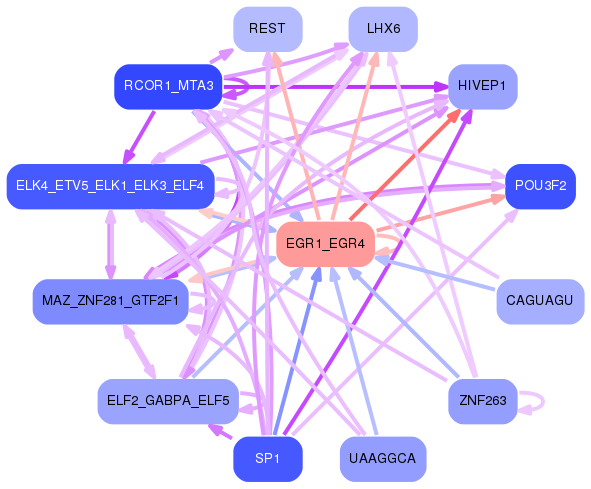
Results for EGR1_EGR4
Z-value: 1.54
Motif logo
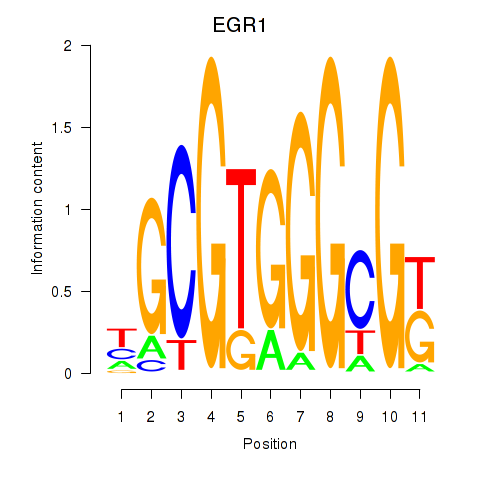
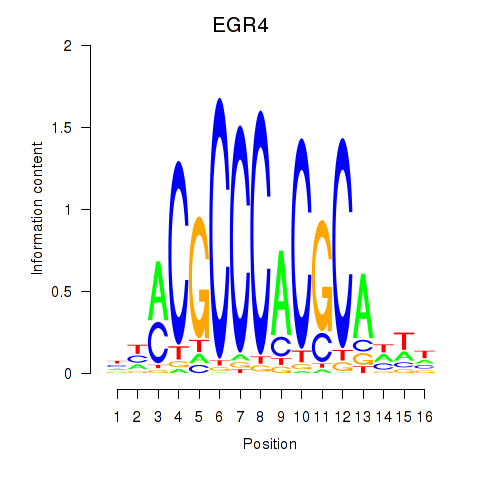
Transcription factors associated with EGR1_EGR4
| Gene Symbol | Gene ID | Gene Info |
|---|---|---|
|
EGR1
|
ENSG00000120738.7 | early growth response 1 |
|
EGR4
|
ENSG00000135625.6 | early growth response 4 |
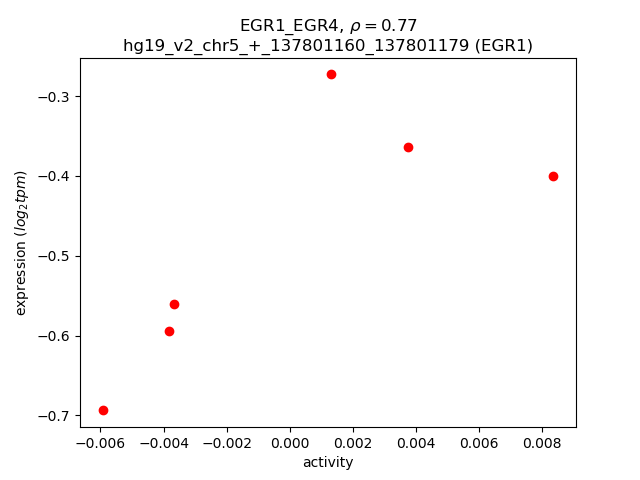
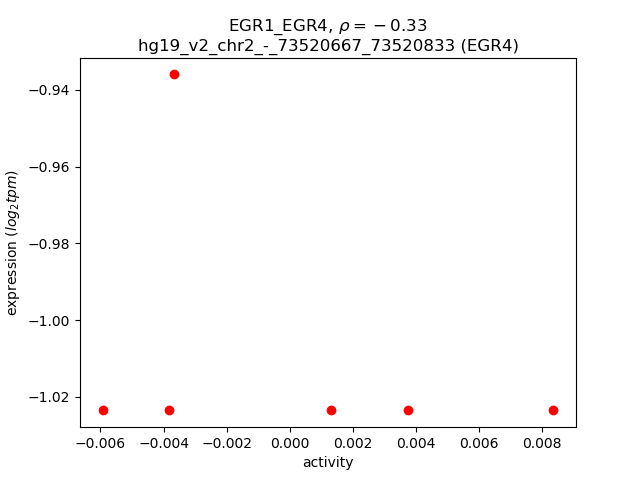
Activity-expression correlation:
| Gene | Promoter | Pearson corr. coef. | P-value | Plot |
|---|---|---|---|---|
| EGR1 | hg19_v2_chr5_+_137801160_137801179 | 0.77 | 7.2e-02 | Click! |
| EGR4 | hg19_v2_chr2_-_73520667_73520833 | -0.33 | 5.3e-01 | Click! |