Project
A549 cells infected with SARS-CoV-2 Analysis Results (GEO series: GSE147507)
Navigation
Downloads
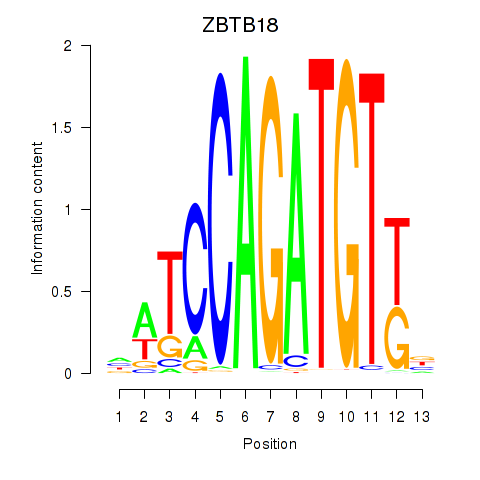
Results for ZBTB18
Z-value: 0.91
Motif logo
Transcription factors associated with ZBTB18
| Gene Symbol | Gene ID | Gene Info |
|---|---|---|
|
ZBTB18
|
ENSG00000179456.9 | zinc finger and BTB domain containing 18 |
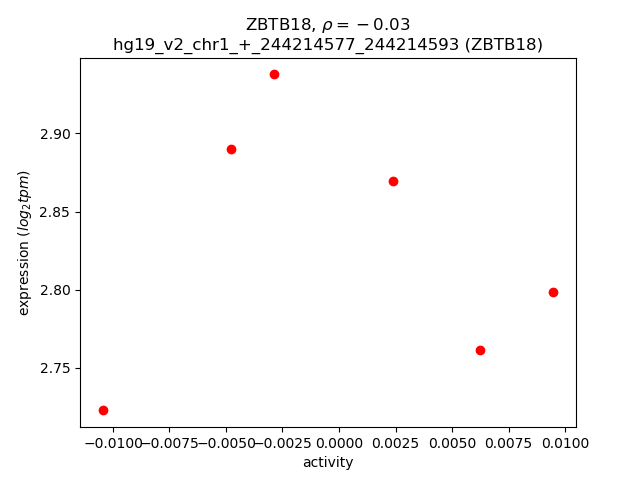
Activity-expression correlation:
| Gene | Promoter | Pearson corr. coef. | P-value | Plot |
|---|---|---|---|---|
| ZBTB18 | hg19_v2_chr1_+_244214577_244214593 | -0.03 | 9.5e-01 | Click! |
Activity profile of ZBTB18 motif
Sorted Z-values of ZBTB18 motif
| Promoter | Log-likelihood | Transcript | Gene | Gene Info |
|---|---|---|---|---|
| chr14_+_94577074 | 2.55 |
ENST00000444961.1
ENST00000448882.1 ENST00000557098.1 ENST00000554800.1 ENST00000556544.1 ENST00000298902.5 ENST00000555819.1 ENST00000557634.1 ENST00000555744.1 |
IFI27
|
interferon, alpha-inducible protein 27 |
| chr11_+_94227129 | 1.00 |
ENST00000540349.1
ENST00000535502.1 ENST00000545130.1 ENST00000544253.1 ENST00000541144.1 |
ANKRD49
|
ankyrin repeat domain 49 |
| chr5_+_49962495 | 0.71 |
ENST00000515175.1
|
PARP8
|
poly (ADP-ribose) polymerase family, member 8 |
| chr14_+_64971438 | 0.60 |
ENST00000555321.1
|
ZBTB1
|
zinc finger and BTB domain containing 1 |
| chr3_+_100211412 | 0.59 |
ENST00000323523.4
ENST00000403410.1 ENST00000449609.1 |
TMEM45A
|
transmembrane protein 45A |
| chr2_-_7005785 | 0.59 |
ENST00000256722.5
ENST00000404168.1 ENST00000458098.1 |
CMPK2
|
cytidine monophosphate (UMP-CMP) kinase 2, mitochondrial |
| chr10_-_7829909 | 0.55 |
ENST00000379562.4
ENST00000543003.1 ENST00000535925.1 |
KIN
|
KIN, antigenic determinant of recA protein homolog (mouse) |
| chr1_+_78354175 | 0.53 |
ENST00000401035.3
ENST00000457030.1 ENST00000330010.8 |
NEXN
|
nexilin (F actin binding protein) |
| chr16_+_28914680 | 0.53 |
ENST00000564112.1
|
ATP2A1
|
ATPase, Ca++ transporting, cardiac muscle, fast twitch 1 |
| chr17_+_48638371 | 0.52 |
ENST00000360761.4
ENST00000352832.5 ENST00000354983.4 |
CACNA1G
|
calcium channel, voltage-dependent, T type, alpha 1G subunit |
| chr1_+_78354297 | 0.51 |
ENST00000334785.7
|
NEXN
|
nexilin (F actin binding protein) |
| chr14_+_64970662 | 0.51 |
ENST00000556965.1
ENST00000554015.1 |
ZBTB1
|
zinc finger and BTB domain containing 1 |
| chr11_-_94226964 | 0.51 |
ENST00000538923.1
ENST00000540013.1 ENST00000407439.3 ENST00000393241.4 |
MRE11A
|
MRE11 meiotic recombination 11 homolog A (S. cerevisiae) |
| chr16_-_30393752 | 0.49 |
ENST00000566517.1
ENST00000605106.1 |
SEPT1
SEPT1
|
septin 1 Uncharacterized protein |
| chr3_-_160167508 | 0.49 |
ENST00000479460.1
|
TRIM59
|
tripartite motif containing 59 |
| chr11_-_33722286 | 0.49 |
ENST00000451594.2
ENST00000379011.4 |
C11orf91
|
chromosome 11 open reading frame 91 |
| chr15_+_49715449 | 0.48 |
ENST00000560979.1
|
FGF7
|
fibroblast growth factor 7 |
| chr4_+_75480629 | 0.46 |
ENST00000380846.3
|
AREGB
|
amphiregulin B |
| chr4_+_75311019 | 0.43 |
ENST00000502307.1
|
AREG
|
amphiregulin |
| chr4_+_75310851 | 0.39 |
ENST00000395748.3
ENST00000264487.2 |
AREG
|
amphiregulin |
| chr14_+_64971292 | 0.38 |
ENST00000358738.3
ENST00000394712.2 |
ZBTB1
|
zinc finger and BTB domain containing 1 |
| chr5_+_159895275 | 0.37 |
ENST00000517927.1
|
MIR146A
|
microRNA 146a |
| chr15_+_57210961 | 0.37 |
ENST00000557843.1
|
TCF12
|
transcription factor 12 |
| chr10_+_7830125 | 0.36 |
ENST00000335698.4
ENST00000541227.1 |
ATP5C1
|
ATP synthase, H+ transporting, mitochondrial F1 complex, gamma polypeptide 1 |
| chr11_-_94227029 | 0.34 |
ENST00000323977.3
ENST00000536754.1 ENST00000323929.3 |
MRE11A
|
MRE11 meiotic recombination 11 homolog A (S. cerevisiae) |
| chr14_+_38033252 | 0.34 |
ENST00000554829.1
|
RP11-356O9.1
|
RP11-356O9.1 |
| chr1_-_207206092 | 0.33 |
ENST00000359470.5
ENST00000461135.2 |
C1orf116
|
chromosome 1 open reading frame 116 |
| chr17_+_42385927 | 0.33 |
ENST00000426726.3
ENST00000590941.1 ENST00000225441.7 |
RUNDC3A
|
RUN domain containing 3A |
| chr9_+_100174344 | 0.32 |
ENST00000422139.2
|
TDRD7
|
tudor domain containing 7 |
| chr9_-_99329098 | 0.32 |
ENST00000452280.1
|
CDC14B
|
cell division cycle 14B |
| chr3_-_145940214 | 0.32 |
ENST00000481701.1
|
PLSCR4
|
phospholipid scramblase 4 |
| chr1_-_11907829 | 0.31 |
ENST00000376480.3
|
NPPA
|
natriuretic peptide A |
| chr5_+_118690466 | 0.30 |
ENST00000503646.1
|
TNFAIP8
|
tumor necrosis factor, alpha-induced protein 8 |
| chr6_-_127663543 | 0.30 |
ENST00000531582.1
|
ECHDC1
|
enoyl CoA hydratase domain containing 1 |
| chr10_+_7830092 | 0.30 |
ENST00000356708.7
|
ATP5C1
|
ATP synthase, H+ transporting, mitochondrial F1 complex, gamma polypeptide 1 |
| chr15_+_57210818 | 0.30 |
ENST00000438423.2
ENST00000267811.5 ENST00000452095.2 ENST00000559609.1 ENST00000333725.5 |
TCF12
|
transcription factor 12 |
| chr2_+_152214098 | 0.29 |
ENST00000243347.3
|
TNFAIP6
|
tumor necrosis factor, alpha-induced protein 6 |
| chr7_+_95115210 | 0.29 |
ENST00000428113.1
ENST00000325885.5 |
ASB4
|
ankyrin repeat and SOCS box containing 4 |
| chr6_-_153304148 | 0.29 |
ENST00000229758.3
|
FBXO5
|
F-box protein 5 |
| chr15_-_96590126 | 0.29 |
ENST00000561051.1
|
RP11-4G2.1
|
RP11-4G2.1 |
| chr7_+_105172532 | 0.27 |
ENST00000257700.2
|
RINT1
|
RAD50 interactor 1 |
| chr12_-_11175219 | 0.27 |
ENST00000390673.2
|
TAS2R19
|
taste receptor, type 2, member 19 |
| chr3_+_124303512 | 0.27 |
ENST00000454902.1
|
KALRN
|
kalirin, RhoGEF kinase |
| chr11_-_63684316 | 0.27 |
ENST00000301459.4
|
RCOR2
|
REST corepressor 2 |
| chr2_-_230096756 | 0.26 |
ENST00000354069.6
|
PID1
|
phosphotyrosine interaction domain containing 1 |
| chrX_+_150151824 | 0.26 |
ENST00000455596.1
ENST00000448905.2 |
HMGB3
|
high mobility group box 3 |
| chr4_+_156824840 | 0.26 |
ENST00000536354.2
|
TDO2
|
tryptophan 2,3-dioxygenase |
| chr17_+_47653178 | 0.26 |
ENST00000328741.5
|
NXPH3
|
neurexophilin 3 |
| chr8_-_17555164 | 0.26 |
ENST00000297488.6
|
MTUS1
|
microtubule associated tumor suppressor 1 |
| chr3_-_160167540 | 0.26 |
ENST00000496222.1
ENST00000471396.1 ENST00000471155.1 ENST00000309784.4 |
TRIM59
|
tripartite motif containing 59 |
| chr15_+_55611128 | 0.25 |
ENST00000164305.5
ENST00000539642.1 |
PIGB
|
phosphatidylinositol glycan anchor biosynthesis, class B |
| chrX_+_9880412 | 0.25 |
ENST00000418909.2
|
SHROOM2
|
shroom family member 2 |
| chr9_+_100174232 | 0.25 |
ENST00000355295.4
|
TDRD7
|
tudor domain containing 7 |
| chrX_+_150151752 | 0.24 |
ENST00000325307.7
|
HMGB3
|
high mobility group box 3 |
| chr17_+_77020146 | 0.23 |
ENST00000579760.1
|
C1QTNF1
|
C1q and tumor necrosis factor related protein 1 |
| chr13_+_97874574 | 0.23 |
ENST00000343600.4
ENST00000345429.6 ENST00000376673.3 |
MBNL2
|
muscleblind-like splicing regulator 2 |
| chr1_-_151882031 | 0.23 |
ENST00000489410.1
|
THEM4
|
thioesterase superfamily member 4 |
| chr15_-_57210769 | 0.22 |
ENST00000559000.1
|
ZNF280D
|
zinc finger protein 280D |
| chr4_-_105416039 | 0.22 |
ENST00000394767.2
|
CXXC4
|
CXXC finger protein 4 |
| chr2_+_33359687 | 0.22 |
ENST00000402934.1
ENST00000404525.1 ENST00000407925.1 |
LTBP1
|
latent transforming growth factor beta binding protein 1 |
| chr2_-_152146385 | 0.22 |
ENST00000414946.1
ENST00000243346.5 |
NMI
|
N-myc (and STAT) interactor |
| chr6_+_160542870 | 0.21 |
ENST00000324965.4
ENST00000457470.2 |
SLC22A1
|
solute carrier family 22 (organic cation transporter), member 1 |
| chr19_-_36001286 | 0.21 |
ENST00000602679.1
ENST00000492341.2 ENST00000472252.2 ENST00000602781.1 ENST00000402589.2 ENST00000458071.1 ENST00000436012.1 ENST00000443640.1 ENST00000450261.1 ENST00000467637.1 ENST00000480502.1 ENST00000474928.1 ENST00000414866.2 ENST00000392206.2 ENST00000488892.1 |
DMKN
|
dermokine |
| chr8_+_38965048 | 0.20 |
ENST00000399831.3
ENST00000437682.2 ENST00000519315.1 ENST00000379907.4 ENST00000522506.1 |
ADAM32
|
ADAM metallopeptidase domain 32 |
| chrX_-_153141434 | 0.20 |
ENST00000407935.2
ENST00000439496.1 |
L1CAM
|
L1 cell adhesion molecule |
| chr2_-_225434538 | 0.20 |
ENST00000409096.1
|
CUL3
|
cullin 3 |
| chr2_+_33359646 | 0.20 |
ENST00000390003.4
ENST00000418533.2 |
LTBP1
|
latent transforming growth factor beta binding protein 1 |
| chr16_-_30394143 | 0.19 |
ENST00000321367.3
ENST00000571393.1 |
SEPT1
|
septin 1 |
| chr1_-_224517823 | 0.19 |
ENST00000469968.1
ENST00000436927.1 ENST00000469075.1 ENST00000488718.1 ENST00000482491.1 ENST00000340871.4 ENST00000492281.1 ENST00000361463.3 ENST00000391875.2 ENST00000461546.1 |
NVL
|
nuclear VCP-like |
| chr12_-_104443890 | 0.19 |
ENST00000547583.1
ENST00000360814.4 ENST00000546851.1 |
GLT8D2
|
glycosyltransferase 8 domain containing 2 |
| chr3_-_114035026 | 0.18 |
ENST00000570269.1
|
RP11-553L6.5
|
RP11-553L6.5 |
| chr2_+_29341037 | 0.18 |
ENST00000449202.1
|
CLIP4
|
CAP-GLY domain containing linker protein family, member 4 |
| chr2_+_108994466 | 0.18 |
ENST00000272452.2
|
SULT1C4
|
sulfotransferase family, cytosolic, 1C, member 4 |
| chr13_+_113699029 | 0.18 |
ENST00000423251.1
|
MCF2L
|
MCF.2 cell line derived transforming sequence-like |
| chr17_+_77020224 | 0.17 |
ENST00000339142.2
|
C1QTNF1
|
C1q and tumor necrosis factor related protein 1 |
| chr17_+_77020325 | 0.17 |
ENST00000311661.4
|
C1QTNF1
|
C1q and tumor necrosis factor related protein 1 |
| chr3_+_124303472 | 0.17 |
ENST00000291478.5
|
KALRN
|
kalirin, RhoGEF kinase |
| chr1_-_113160826 | 0.17 |
ENST00000538187.1
ENST00000369664.1 |
ST7L
|
suppression of tumorigenicity 7 like |
| chr9_+_125137565 | 0.16 |
ENST00000373698.5
|
PTGS1
|
prostaglandin-endoperoxide synthase 1 (prostaglandin G/H synthase and cyclooxygenase) |
| chr1_-_16344500 | 0.16 |
ENST00000406363.2
ENST00000411503.1 ENST00000545268.1 ENST00000487046.1 |
HSPB7
|
heat shock 27kDa protein family, member 7 (cardiovascular) |
| chr15_+_55611401 | 0.16 |
ENST00000566999.1
|
PIGB
|
phosphatidylinositol glycan anchor biosynthesis, class B |
| chr7_-_135433460 | 0.16 |
ENST00000415751.1
|
FAM180A
|
family with sequence similarity 180, member A |
| chr19_+_11649532 | 0.16 |
ENST00000252456.2
ENST00000592923.1 ENST00000535659.2 |
CNN1
|
calponin 1, basic, smooth muscle |
| chrX_+_9880590 | 0.16 |
ENST00000452575.1
|
SHROOM2
|
shroom family member 2 |
| chr15_+_47631257 | 0.16 |
ENST00000560636.1
|
SEMA6D
|
sema domain, transmembrane domain (TM), and cytoplasmic domain, (semaphorin) 6D |
| chr11_-_68780701 | 0.15 |
ENST00000320913.6
|
MRGPRF
|
MAS-related GPR, member F |
| chr17_+_47653471 | 0.15 |
ENST00000513748.1
|
NXPH3
|
neurexophilin 3 |
| chr1_+_78354330 | 0.15 |
ENST00000440324.1
|
NEXN
|
nexilin (F actin binding protein) |
| chr9_+_118916082 | 0.14 |
ENST00000328252.3
|
PAPPA
|
pregnancy-associated plasma protein A, pappalysin 1 |
| chr8_-_29592736 | 0.14 |
ENST00000518623.1
|
LINC00589
|
long intergenic non-protein coding RNA 589 |
| chr6_+_155537771 | 0.14 |
ENST00000275246.7
|
TIAM2
|
T-cell lymphoma invasion and metastasis 2 |
| chr19_-_36001386 | 0.13 |
ENST00000461300.1
|
DMKN
|
dermokine |
| chr10_-_104913367 | 0.13 |
ENST00000423468.2
|
NT5C2
|
5'-nucleotidase, cytosolic II |
| chr3_+_121311966 | 0.13 |
ENST00000338040.4
|
FBXO40
|
F-box protein 40 |
| chr1_+_26737253 | 0.13 |
ENST00000326279.6
|
LIN28A
|
lin-28 homolog A (C. elegans) |
| chr9_+_72658490 | 0.13 |
ENST00000377182.4
|
MAMDC2
|
MAM domain containing 2 |
| chr3_+_101659682 | 0.13 |
ENST00000465215.1
|
RP11-221J22.1
|
RP11-221J22.1 |
| chr17_+_32582293 | 0.13 |
ENST00000580907.1
ENST00000225831.4 |
CCL2
|
chemokine (C-C motif) ligand 2 |
| chr11_+_15136462 | 0.13 |
ENST00000379556.3
ENST00000424273.1 |
INSC
|
inscuteable homolog (Drosophila) |
| chrX_-_48056199 | 0.12 |
ENST00000311798.1
ENST00000347757.1 |
SSX5
|
synovial sarcoma, X breakpoint 5 |
| chr10_+_90562705 | 0.12 |
ENST00000539337.1
|
LIPM
|
lipase, family member M |
| chr4_-_87855851 | 0.12 |
ENST00000473559.1
|
C4orf36
|
chromosome 4 open reading frame 36 |
| chr16_-_49698136 | 0.12 |
ENST00000535559.1
|
ZNF423
|
zinc finger protein 423 |
| chr10_+_97733786 | 0.11 |
ENST00000371198.2
|
CC2D2B
|
coiled-coil and C2 domain containing 2B |
| chr21_+_30502806 | 0.11 |
ENST00000399928.1
ENST00000399926.1 |
MAP3K7CL
|
MAP3K7 C-terminal like |
| chr3_+_124303539 | 0.11 |
ENST00000428018.2
|
KALRN
|
kalirin, RhoGEF kinase |
| chr1_+_37947257 | 0.11 |
ENST00000471012.1
|
ZC3H12A
|
zinc finger CCCH-type containing 12A |
| chr5_+_118812237 | 0.11 |
ENST00000513628.1
|
HSD17B4
|
hydroxysteroid (17-beta) dehydrogenase 4 |
| chr5_-_142784101 | 0.11 |
ENST00000503201.1
ENST00000502892.1 |
NR3C1
|
nuclear receptor subfamily 3, group C, member 1 (glucocorticoid receptor) |
| chr15_+_49715293 | 0.10 |
ENST00000267843.4
ENST00000560270.1 |
FGF7
|
fibroblast growth factor 7 |
| chr5_-_180552304 | 0.10 |
ENST00000329365.2
|
OR2V1
|
olfactory receptor, family 2, subfamily V, member 1 |
| chr17_-_62050278 | 0.10 |
ENST00000578147.1
ENST00000435607.1 |
SCN4A
|
sodium channel, voltage-gated, type IV, alpha subunit |
| chr5_+_118812294 | 0.10 |
ENST00000509514.1
|
HSD17B4
|
hydroxysteroid (17-beta) dehydrogenase 4 |
| chr11_+_128562372 | 0.10 |
ENST00000344954.6
|
FLI1
|
Fli-1 proto-oncogene, ETS transcription factor |
| chr2_-_145278475 | 0.10 |
ENST00000558170.2
|
ZEB2
|
zinc finger E-box binding homeobox 2 |
| chr4_-_100009856 | 0.10 |
ENST00000296412.8
|
ADH5
|
alcohol dehydrogenase 5 (class III), chi polypeptide |
| chr19_+_50936142 | 0.10 |
ENST00000357701.5
|
MYBPC2
|
myosin binding protein C, fast type |
| chr1_+_211433275 | 0.09 |
ENST00000367005.4
|
RCOR3
|
REST corepressor 3 |
| chr3_-_160167301 | 0.09 |
ENST00000494486.1
|
TRIM59
|
tripartite motif containing 59 |
| chr12_-_64616019 | 0.09 |
ENST00000311915.8
ENST00000398055.3 ENST00000544871.1 |
C12orf66
|
chromosome 12 open reading frame 66 |
| chr13_-_28545276 | 0.09 |
ENST00000381020.7
|
CDX2
|
caudal type homeobox 2 |
| chr12_-_68845165 | 0.09 |
ENST00000360485.3
ENST00000441255.2 |
RP11-81H14.2
|
RP11-81H14.2 |
| chr11_-_17555421 | 0.09 |
ENST00000526181.1
|
USH1C
|
Usher syndrome 1C (autosomal recessive, severe) |
| chr8_+_104831554 | 0.08 |
ENST00000408894.2
|
RIMS2
|
regulating synaptic membrane exocytosis 2 |
| chr5_-_151304337 | 0.08 |
ENST00000455880.2
ENST00000545569.1 ENST00000274576.4 |
GLRA1
|
glycine receptor, alpha 1 |
| chr3_+_49840685 | 0.08 |
ENST00000333323.4
|
FAM212A
|
family with sequence similarity 212, member A |
| chr15_+_92937144 | 0.08 |
ENST00000539113.1
ENST00000555434.1 |
ST8SIA2
|
ST8 alpha-N-acetyl-neuraminide alpha-2,8-sialyltransferase 2 |
| chr20_+_57875758 | 0.08 |
ENST00000395654.3
|
EDN3
|
endothelin 3 |
| chr15_-_55611306 | 0.08 |
ENST00000563262.1
|
RAB27A
|
RAB27A, member RAS oncogene family |
| chr6_+_163148973 | 0.08 |
ENST00000366888.2
|
PACRG
|
PARK2 co-regulated |
| chr8_-_49834299 | 0.08 |
ENST00000396822.1
|
SNAI2
|
snail family zinc finger 2 |
| chr2_-_85829496 | 0.07 |
ENST00000409668.1
|
TMEM150A
|
transmembrane protein 150A |
| chr8_+_104831472 | 0.07 |
ENST00000262231.10
ENST00000507740.1 |
RIMS2
|
regulating synaptic membrane exocytosis 2 |
| chr7_-_135433534 | 0.07 |
ENST00000338588.3
|
FAM180A
|
family with sequence similarity 180, member A |
| chr8_+_104831440 | 0.06 |
ENST00000515551.1
|
RIMS2
|
regulating synaptic membrane exocytosis 2 |
| chr1_-_156647189 | 0.06 |
ENST00000368223.3
|
NES
|
nestin |
| chr15_-_74043816 | 0.06 |
ENST00000379822.4
|
C15orf59
|
chromosome 15 open reading frame 59 |
| chr20_+_57875658 | 0.06 |
ENST00000371025.3
|
EDN3
|
endothelin 3 |
| chr14_-_101014435 | 0.06 |
ENST00000554356.1
|
BEGAIN
|
brain-enriched guanylate kinase-associated |
| chr9_+_131683174 | 0.06 |
ENST00000372592.3
ENST00000428610.1 |
PHYHD1
|
phytanoyl-CoA dioxygenase domain containing 1 |
| chr1_+_26737292 | 0.06 |
ENST00000254231.4
|
LIN28A
|
lin-28 homolog A (C. elegans) |
| chr2_-_89417335 | 0.06 |
ENST00000490686.1
|
IGKV1-17
|
immunoglobulin kappa variable 1-17 |
| chr4_-_111563279 | 0.06 |
ENST00000511837.1
|
PITX2
|
paired-like homeodomain 2 |
| chr1_+_38022513 | 0.06 |
ENST00000296218.7
|
DNALI1
|
dynein, axonemal, light intermediate chain 1 |
| chr2_+_219247021 | 0.06 |
ENST00000539932.1
|
SLC11A1
|
solute carrier family 11 (proton-coupled divalent metal ion transporter), member 1 |
| chr12_-_54785074 | 0.06 |
ENST00000338010.5
ENST00000550774.1 |
ZNF385A
|
zinc finger protein 385A |
| chr5_-_180688105 | 0.05 |
ENST00000327767.4
|
TRIM52
|
tripartite motif containing 52 |
| chr11_+_32112431 | 0.05 |
ENST00000054950.3
|
RCN1
|
reticulocalbin 1, EF-hand calcium binding domain |
| chr2_+_33359473 | 0.05 |
ENST00000432635.1
|
LTBP1
|
latent transforming growth factor beta binding protein 1 |
| chr10_-_48050538 | 0.05 |
ENST00000420079.2
|
ASAH2C
|
N-acylsphingosine amidohydrolase (non-lysosomal ceramidase) 2C |
| chr12_-_16762971 | 0.04 |
ENST00000540590.1
|
LMO3
|
LIM domain only 3 (rhombotin-like 2) |
| chr2_+_113885138 | 0.04 |
ENST00000409930.3
|
IL1RN
|
interleukin 1 receptor antagonist |
| chr15_+_51669444 | 0.04 |
ENST00000396399.2
|
GLDN
|
gliomedin |
| chr8_-_11058847 | 0.04 |
ENST00000297303.4
ENST00000416569.2 |
XKR6
|
XK, Kell blood group complex subunit-related family, member 6 |
| chr1_-_153518270 | 0.04 |
ENST00000354332.4
ENST00000368716.4 |
S100A4
|
S100 calcium binding protein A4 |
| chr16_-_29910853 | 0.04 |
ENST00000308713.5
|
SEZ6L2
|
seizure related 6 homolog (mouse)-like 2 |
| chr22_+_42372970 | 0.04 |
ENST00000291236.11
|
SEPT3
|
septin 3 |
| chr10_+_105253661 | 0.04 |
ENST00000369780.4
|
NEURL
|
neuralized E3 ubiquitin protein ligase 1 |
| chrX_+_48242863 | 0.04 |
ENST00000376886.2
ENST00000375517.3 |
SSX4
|
synovial sarcoma, X breakpoint 4 |
| chr17_-_33885117 | 0.03 |
ENST00000415846.3
|
SLFN14
|
schlafen family member 14 |
| chr18_+_54814288 | 0.03 |
ENST00000585477.1
|
BOD1L2
|
biorientation of chromosomes in cell division 1-like 2 |
| chr11_+_4673716 | 0.03 |
ENST00000530215.1
|
OR51E1
|
olfactory receptor, family 51, subfamily E, member 1 |
| chr11_+_65405556 | 0.03 |
ENST00000534313.1
ENST00000533361.1 ENST00000526137.1 |
SIPA1
|
signal-induced proliferation-associated 1 |
| chr1_+_32608566 | 0.03 |
ENST00000545542.1
|
KPNA6
|
karyopherin alpha 6 (importin alpha 7) |
| chr19_-_52148798 | 0.03 |
ENST00000534261.2
|
SIGLEC5
|
sialic acid binding Ig-like lectin 5 |
| chr8_-_49833978 | 0.03 |
ENST00000020945.1
|
SNAI2
|
snail family zinc finger 2 |
| chr7_-_37024665 | 0.03 |
ENST00000396040.2
|
ELMO1
|
engulfment and cell motility 1 |
| chr16_-_18470696 | 0.03 |
ENST00000427999.2
|
RP11-1212A22.4
|
LOC339047 protein; Nuclear pore complex-interacting protein family member A3; Nuclear pore complex-interacting protein family member A5; Protein PKD1P1 |
| chrX_+_43515467 | 0.03 |
ENST00000338702.3
ENST00000542639.1 |
MAOA
|
monoamine oxidase A |
| chr7_+_90225796 | 0.02 |
ENST00000380050.3
|
CDK14
|
cyclin-dependent kinase 14 |
| chr21_-_35883541 | 0.02 |
ENST00000399284.1
|
KCNE1
|
potassium voltage-gated channel, Isk-related family, member 1 |
| chr15_-_31453359 | 0.02 |
ENST00000542188.1
|
TRPM1
|
transient receptor potential cation channel, subfamily M, member 1 |
| chr15_+_92937058 | 0.02 |
ENST00000268164.3
|
ST8SIA2
|
ST8 alpha-N-acetyl-neuraminide alpha-2,8-sialyltransferase 2 |
| chr5_-_142784888 | 0.02 |
ENST00000514699.1
|
NR3C1
|
nuclear receptor subfamily 3, group C, member 1 (glucocorticoid receptor) |
| chr19_+_41119323 | 0.02 |
ENST00000599724.1
ENST00000597071.1 ENST00000243562.9 |
LTBP4
|
latent transforming growth factor beta binding protein 4 |
| chr17_-_19651598 | 0.02 |
ENST00000570414.1
|
ALDH3A1
|
aldehyde dehydrogenase 3 family, member A1 |
| chr12_-_16762802 | 0.02 |
ENST00000534946.1
|
LMO3
|
LIM domain only 3 (rhombotin-like 2) |
| chr12_+_112563335 | 0.01 |
ENST00000549358.1
ENST00000257604.5 ENST00000548092.1 ENST00000552896.1 |
TRAFD1
|
TRAF-type zinc finger domain containing 1 |
| chr4_+_144312659 | 0.01 |
ENST00000509992.1
|
GAB1
|
GRB2-associated binding protein 1 |
| chrX_-_77225135 | 0.01 |
ENST00000458128.1
|
PGAM4
|
phosphoglycerate mutase family member 4 |
| chr13_+_113777105 | 0.01 |
ENST00000409306.1
ENST00000375551.3 ENST00000375559.3 |
F10
|
coagulation factor X |
| chr22_+_42372931 | 0.01 |
ENST00000328414.8
ENST00000396425.3 |
SEPT3
|
septin 3 |
| chr1_+_186265399 | 0.01 |
ENST00000367486.3
ENST00000367484.3 ENST00000533951.1 ENST00000367482.4 ENST00000367483.4 ENST00000367485.4 ENST00000445192.2 |
PRG4
|
proteoglycan 4 |
| chr18_+_6834472 | 0.00 |
ENST00000581099.1
ENST00000419673.2 ENST00000531294.1 |
ARHGAP28
|
Rho GTPase activating protein 28 |
| chr8_+_21823726 | 0.00 |
ENST00000433566.4
|
XPO7
|
exportin 7 |
| chrX_-_153141783 | 0.00 |
ENST00000458029.1
|
L1CAM
|
L1 cell adhesion molecule |
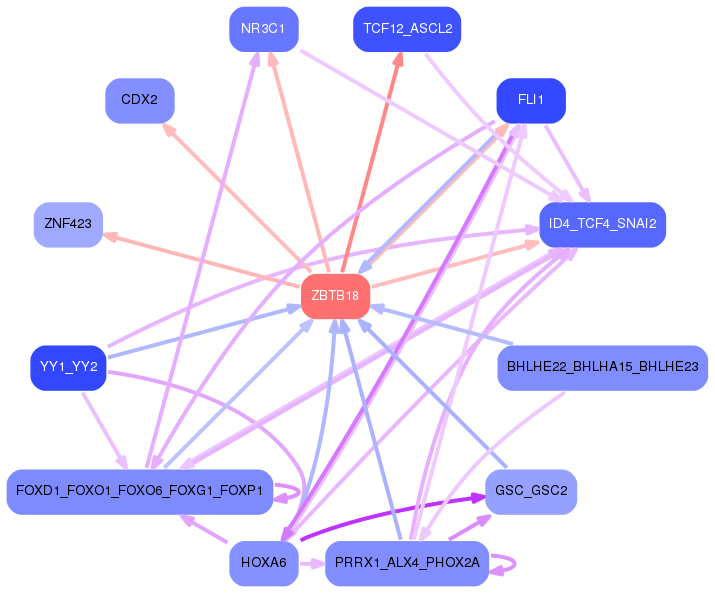
Network of associatons between targets according to the STRING database.

First level regulatory network of ZBTB18
Gene Ontology Analysis
Gene overrepresentation in biological_process category:
| Log-likelihood per target | Total log-likelihood | Term | Description |
|---|---|---|---|
| 0.4 | 1.5 | GO:2000176 | regulation of pro-T cell differentiation(GO:2000174) positive regulation of pro-T cell differentiation(GO:2000176) |
| 0.2 | 0.5 | GO:0014724 | regulation of twitch skeletal muscle contraction(GO:0014724) regulation of fast-twitch skeletal muscle fiber contraction(GO:0031446) positive regulation of fast-twitch skeletal muscle fiber contraction(GO:0031448) |
| 0.1 | 0.6 | GO:0009138 | pyrimidine nucleoside diphosphate metabolic process(GO:0009138) |
| 0.1 | 0.4 | GO:0008057 | eye pigment granule organization(GO:0008057) |
| 0.1 | 0.6 | GO:0060437 | lung growth(GO:0060437) |
| 0.1 | 0.3 | GO:0007057 | spindle assembly involved in female meiosis I(GO:0007057) |
| 0.1 | 0.8 | GO:0042695 | thelarche(GO:0042695) mammary gland branching involved in thelarche(GO:0060744) |
| 0.1 | 0.6 | GO:2000857 | positive regulation of mineralocorticoid secretion(GO:2000857) positive regulation of aldosterone secretion(GO:2000860) |
| 0.1 | 0.5 | GO:0060125 | negative regulation of growth hormone secretion(GO:0060125) |
| 0.1 | 0.3 | GO:0070346 | positive regulation of fat cell proliferation(GO:0070346) |
| 0.1 | 0.3 | GO:0019442 | tryptophan catabolic process to acetyl-CoA(GO:0019442) |
| 0.1 | 0.5 | GO:0060371 | regulation of atrial cardiac muscle cell membrane depolarization(GO:0060371) |
| 0.1 | 0.3 | GO:1902304 | positive regulation of potassium ion export(GO:1902304) |
| 0.1 | 1.2 | GO:0048739 | cardiac muscle fiber development(GO:0048739) |
| 0.0 | 0.3 | GO:1903575 | cornified envelope assembly(GO:1903575) |
| 0.0 | 0.1 | GO:2000502 | negative regulation of natural killer cell chemotaxis(GO:2000502) |
| 0.0 | 2.5 | GO:0046825 | regulation of protein export from nucleus(GO:0046825) |
| 0.0 | 0.5 | GO:0035583 | sequestering of TGFbeta in extracellular matrix(GO:0035583) |
| 0.0 | 0.2 | GO:0001831 | trophectodermal cellular morphogenesis(GO:0001831) |
| 0.0 | 0.2 | GO:0072434 | signal transduction involved in G2 DNA damage checkpoint(GO:0072425) signal transduction involved in mitotic G2 DNA damage checkpoint(GO:0072434) |
| 0.0 | 0.1 | GO:2000627 | regulation of miRNA catabolic process(GO:2000625) positive regulation of miRNA catabolic process(GO:2000627) |
| 0.0 | 0.1 | GO:0070563 | negative regulation of vitamin D receptor signaling pathway(GO:0070563) |
| 0.0 | 0.2 | GO:0036111 | very long-chain fatty-acyl-CoA metabolic process(GO:0036111) |
| 0.0 | 0.1 | GO:0046294 | formaldehyde catabolic process(GO:0046294) |
| 0.0 | 0.2 | GO:0007352 | zygotic specification of dorsal/ventral axis(GO:0007352) |
| 0.0 | 0.2 | GO:0032687 | negative regulation of interferon-alpha production(GO:0032687) |
| 0.0 | 0.1 | GO:0014826 | vein smooth muscle contraction(GO:0014826) |
| 0.0 | 0.2 | GO:0010587 | miRNA catabolic process(GO:0010587) |
| 0.0 | 0.8 | GO:0046597 | negative regulation of viral entry into host cell(GO:0046597) |
| 0.0 | 0.1 | GO:1904106 | protein localization to microvillus(GO:1904106) |
| 0.0 | 0.7 | GO:0042776 | mitochondrial ATP synthesis coupled proton transport(GO:0042776) |
| 0.0 | 0.6 | GO:0002089 | lens morphogenesis in camera-type eye(GO:0002089) |
| 0.0 | 0.2 | GO:0061669 | spontaneous neurotransmitter secretion(GO:0061669) spontaneous synaptic transmission(GO:0098814) |
| 0.0 | 0.1 | GO:0048241 | epinephrine transport(GO:0048241) |
| 0.0 | 0.3 | GO:0051256 | mitotic spindle midzone assembly(GO:0051256) |
| 0.0 | 0.1 | GO:0051970 | negative regulation of transmission of nerve impulse(GO:0051970) |
| 0.0 | 0.3 | GO:2001214 | positive regulation of vasculogenesis(GO:2001214) |
| 0.0 | 0.4 | GO:0016254 | preassembly of GPI anchor in ER membrane(GO:0016254) |
| 0.0 | 0.1 | GO:0002309 | T cell proliferation involved in immune response(GO:0002309) L-arginine import(GO:0043091) divalent metal ion export(GO:0070839) arginine import(GO:0090467) |
| 0.0 | 0.1 | GO:1903435 | positive regulation of constitutive secretory pathway(GO:1903435) |
| 0.0 | 0.1 | GO:0021767 | mammillary body development(GO:0021767) mammillary axonal complex development(GO:0061373) positive regulation of lens fiber cell differentiation(GO:1902748) |
| 0.0 | 0.1 | GO:0014807 | regulation of somitogenesis(GO:0014807) |
Gene overrepresentation in cellular_component category:
| Log-likelihood per target | Total log-likelihood | Term | Description |
|---|---|---|---|
| 0.1 | 0.7 | GO:0000275 | mitochondrial proton-transporting ATP synthase complex, catalytic core F(1)(GO:0000275) |
| 0.1 | 0.2 | GO:0070939 | Dsl1p complex(GO:0070939) |
| 0.0 | 0.3 | GO:0031466 | Cul5-RING ubiquitin ligase complex(GO:0031466) |
| 0.0 | 0.6 | GO:0033391 | chromatoid body(GO:0033391) |
| 0.0 | 0.8 | GO:0030992 | intraciliary transport particle B(GO:0030992) |
| 0.0 | 2.4 | GO:0005637 | nuclear inner membrane(GO:0005637) |
| 0.0 | 0.5 | GO:0031095 | platelet dense tubular network membrane(GO:0031095) |
| 0.0 | 0.2 | GO:0005827 | polar microtubule(GO:0005827) |
| 0.0 | 0.5 | GO:0001527 | microfibril(GO:0001527) fibril(GO:0043205) |
| 0.0 | 0.1 | GO:0042406 | extrinsic component of endoplasmic reticulum membrane(GO:0042406) |
Gene overrepresentation in molecular_function category:
| Log-likelihood per target | Total log-likelihood | Term | Description |
|---|---|---|---|
| 0.2 | 0.5 | GO:0008332 | low voltage-gated calcium channel activity(GO:0008332) |
| 0.1 | 0.6 | GO:0009041 | uridylate kinase activity(GO:0009041) |
| 0.1 | 0.5 | GO:0050436 | microfibril binding(GO:0050436) |
| 0.1 | 0.3 | GO:0004492 | methylmalonyl-CoA decarboxylase activity(GO:0004492) |
| 0.1 | 2.5 | GO:0005521 | lamin binding(GO:0005521) |
| 0.1 | 0.4 | GO:0004376 | glycolipid mannosyltransferase activity(GO:0004376) |
| 0.0 | 0.1 | GO:0050146 | nucleoside phosphotransferase activity(GO:0050146) |
| 0.0 | 0.3 | GO:0004833 | tryptophan 2,3-dioxygenase activity(GO:0004833) |
| 0.0 | 0.2 | GO:0031208 | POZ domain binding(GO:0031208) |
| 0.0 | 0.2 | GO:0033989 | 3alpha,7alpha,12alpha-trihydroxy-5beta-cholest-24-enoyl-CoA hydratase activity(GO:0033989) 17-beta-hydroxysteroid dehydrogenase (NAD+) activity(GO:0044594) |
| 0.0 | 1.4 | GO:0070530 | K63-linked polyubiquitin binding(GO:0070530) |
| 0.0 | 0.2 | GO:0004666 | prostaglandin-endoperoxide synthase activity(GO:0004666) |
| 0.0 | 0.3 | GO:0055104 | ligase inhibitor activity(GO:0055104) ubiquitin ligase inhibitor activity(GO:1990948) |
| 0.0 | 0.1 | GO:0031708 | endothelin B receptor binding(GO:0031708) |
| 0.0 | 0.7 | GO:0071837 | HMG box domain binding(GO:0071837) |
| 0.0 | 0.1 | GO:1901375 | acetylcholine transmembrane transporter activity(GO:0005277) secondary active organic cation transmembrane transporter activity(GO:0008513) acetate ester transmembrane transporter activity(GO:1901375) |
| 0.0 | 0.7 | GO:0046933 | proton-transporting ATP synthase activity, rotational mechanism(GO:0046933) |
| 0.0 | 0.4 | GO:0015280 | ligand-gated sodium channel activity(GO:0015280) |
| 0.0 | 0.3 | GO:0033038 | bitter taste receptor activity(GO:0033038) |
| 0.0 | 0.1 | GO:0051139 | metal ion:proton antiporter activity(GO:0051139) |
| 0.0 | 0.6 | GO:0051428 | peptide hormone receptor binding(GO:0051428) |
| 0.0 | 0.1 | GO:0016933 | extracellular-glycine-gated ion channel activity(GO:0016933) extracellular-glycine-gated chloride channel activity(GO:0016934) |
| 0.0 | 0.5 | GO:0005104 | fibroblast growth factor receptor binding(GO:0005104) |
| 0.0 | 0.5 | GO:0005388 | calcium-transporting ATPase activity(GO:0005388) |
| 0.0 | 0.2 | GO:0016290 | palmitoyl-CoA hydrolase activity(GO:0016290) |
| 0.0 | 0.7 | GO:0003950 | NAD+ ADP-ribosyltransferase activity(GO:0003950) |
| 0.0 | 0.5 | GO:0000400 | four-way junction DNA binding(GO:0000400) |
| 0.0 | 0.0 | GO:0005150 | interleukin-1, Type I receptor binding(GO:0005150) interleukin-1 receptor antagonist activity(GO:0005152) |
| 0.0 | 0.3 | GO:0035198 | miRNA binding(GO:0035198) |
| 0.0 | 0.1 | GO:0003828 | alpha-N-acetylneuraminate alpha-2,8-sialyltransferase activity(GO:0003828) |
| 0.0 | 0.5 | GO:0030676 | Rac guanyl-nucleotide exchange factor activity(GO:0030676) |
| 0.0 | 0.8 | GO:0005154 | epidermal growth factor receptor binding(GO:0005154) |
| 0.0 | 1.3 | GO:0008307 | structural constituent of muscle(GO:0008307) |
| 0.0 | 0.1 | GO:0004465 | lipoprotein lipase activity(GO:0004465) |
Gene overrepresentation in C2:CP category:
| Log-likelihood per target | Total log-likelihood | Term | Description |
|---|---|---|---|
| 0.0 | 0.8 | PID ERBB NETWORK PATHWAY | ErbB receptor signaling network |
| 0.0 | 2.3 | SIG PIP3 SIGNALING IN CARDIAC MYOCTES | Genes related to PIP3 signaling in cardiac myocytes |
| 0.0 | 0.8 | PID BARD1 PATHWAY | BARD1 signaling events |
| 0.0 | 0.5 | PID ARF6 DOWNSTREAM PATHWAY | Arf6 downstream pathway |
| 0.0 | 0.6 | PID AURORA A PATHWAY | Aurora A signaling |
Gene overrepresentation in C2:CP:REACTOME category:
| Log-likelihood per target | Total log-likelihood | Term | Description |
|---|---|---|---|
| 0.0 | 0.7 | REACTOME FORMATION OF ATP BY CHEMIOSMOTIC COUPLING | Genes involved in Formation of ATP by chemiosmotic coupling |
| 0.0 | 2.5 | REACTOME INTERFERON ALPHA BETA SIGNALING | Genes involved in Interferon alpha/beta signaling |
| 0.0 | 0.5 | REACTOME ACTIVATED POINT MUTANTS OF FGFR2 | Genes involved in Activated point mutants of FGFR2 |
| 0.0 | 0.8 | REACTOME HOMOLOGOUS RECOMBINATION REPAIR OF REPLICATION INDEPENDENT DOUBLE STRAND BREAKS | Genes involved in Homologous recombination repair of replication-independent double-strand breaks |
| 0.0 | 0.5 | REACTOME PRE NOTCH PROCESSING IN GOLGI | Genes involved in Pre-NOTCH Processing in Golgi |
| 0.0 | 0.6 | REACTOME SYNTHESIS OF GLYCOSYLPHOSPHATIDYLINOSITOL GPI | Genes involved in Synthesis of glycosylphosphatidylinositol (GPI) |
| 0.0 | 0.2 | REACTOME NEGATIVE REGULATION OF THE PI3K AKT NETWORK | Genes involved in Negative regulation of the PI3K/AKT network |
| 0.0 | 0.2 | REACTOME ABACAVIR TRANSPORT AND METABOLISM | Genes involved in Abacavir transport and metabolism |
| 0.0 | 0.3 | REACTOME TRYPTOPHAN CATABOLISM | Genes involved in Tryptophan catabolism |