Project
A549 cells infected with SARS-CoV-2 Analysis Results (GEO series: GSE147507)
Navigation
Downloads
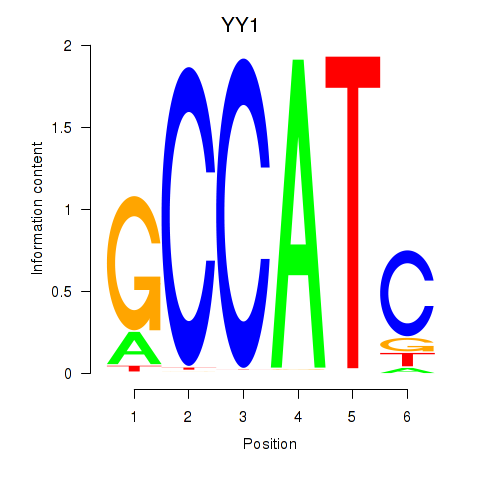
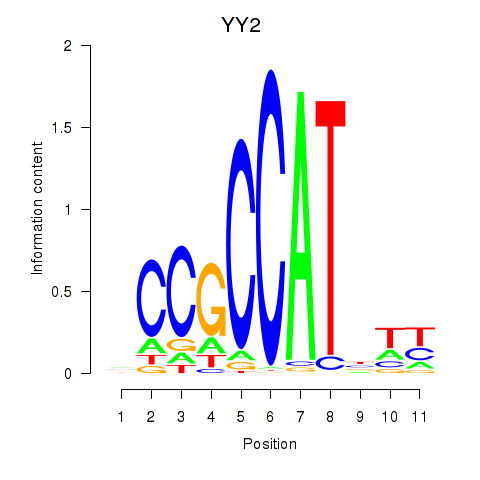
Results for YY1_YY2
Z-value: 1.52
Motif logo
Transcription factors associated with YY1_YY2
| Gene Symbol | Gene ID | Gene Info |
|---|---|---|
|
YY1
|
ENSG00000100811.6 | YY1 transcription factor |
|
YY2
|
ENSG00000230797.2 | YY2 transcription factor |
Activity-expression correlation:
| Gene | Promoter | Pearson corr. coef. | P-value | Plot |
|---|---|---|---|---|
| YY2 | hg19_v2_chrX_+_21874105_21874105 | 0.65 | 1.6e-01 | Click! |
| YY1 | hg19_v2_chr14_+_100705322_100705360 | 0.12 | 8.2e-01 | Click! |
Activity profile of YY1_YY2 motif
Sorted Z-values of YY1_YY2 motif
| Promoter | Log-likelihood | Transcript | Gene | Gene Info |
|---|---|---|---|---|
| chr16_+_30934376 | 2.48 |
ENST00000562798.1
ENST00000471231.2 |
FBXL19
|
F-box and leucine-rich repeat protein 19 |
| chrX_-_153236819 | 1.37 |
ENST00000354233.3
|
HCFC1
|
host cell factor C1 (VP16-accessory protein) |
| chrX_-_153237258 | 1.24 |
ENST00000310441.7
|
HCFC1
|
host cell factor C1 (VP16-accessory protein) |
| chr19_+_797392 | 1.12 |
ENST00000350092.4
ENST00000349038.4 ENST00000586481.1 ENST00000585535.1 |
PTBP1
|
polypyrimidine tract binding protein 1 |
| chr18_-_47813940 | 1.03 |
ENST00000586837.1
ENST00000412036.2 ENST00000589940.1 |
CXXC1
|
CXXC finger protein 1 |
| chr16_+_30662085 | 0.99 |
ENST00000569864.1
|
PRR14
|
proline rich 14 |
| chr19_-_3985455 | 0.95 |
ENST00000309311.6
|
EEF2
|
eukaryotic translation elongation factor 2 |
| chr9_+_131873842 | 0.94 |
ENST00000417728.1
|
PPP2R4
|
protein phosphatase 2A activator, regulatory subunit 4 |
| chrX_-_153236620 | 0.90 |
ENST00000369984.4
|
HCFC1
|
host cell factor C1 (VP16-accessory protein) |
| chr6_+_31588478 | 0.83 |
ENST00000376007.4
ENST00000376033.2 |
PRRC2A
|
proline-rich coiled-coil 2A |
| chr16_-_30569584 | 0.80 |
ENST00000252797.2
ENST00000568114.1 |
ZNF764
AC002310.13
|
zinc finger protein 764 Uncharacterized protein |
| chr9_+_131873591 | 0.78 |
ENST00000393370.2
ENST00000337738.1 ENST00000348141.5 |
PPP2R4
|
protein phosphatase 2A activator, regulatory subunit 4 |
| chr18_-_47814032 | 0.76 |
ENST00000589548.1
ENST00000591474.1 |
CXXC1
|
CXXC finger protein 1 |
| chr19_+_797443 | 0.74 |
ENST00000394601.4
ENST00000589575.1 |
PTBP1
|
polypyrimidine tract binding protein 1 |
| chr1_-_161015663 | 0.74 |
ENST00000534633.1
|
USF1
|
upstream transcription factor 1 |
| chr7_-_72972319 | 0.74 |
ENST00000223368.2
|
BCL7B
|
B-cell CLL/lymphoma 7B |
| chr11_-_76155618 | 0.73 |
ENST00000530759.1
|
RP11-111M22.3
|
RP11-111M22.3 |
| chr17_-_47865948 | 0.73 |
ENST00000513602.1
|
FAM117A
|
family with sequence similarity 117, member A |
| chr19_-_55895966 | 0.72 |
ENST00000444469.3
|
TMEM238
|
transmembrane protein 238 |
| chr16_+_30662184 | 0.72 |
ENST00000300835.4
|
PRR14
|
proline rich 14 |
| chr15_+_42565393 | 0.72 |
ENST00000561871.1
|
GANC
|
glucosidase, alpha; neutral C |
| chr6_-_33168391 | 0.71 |
ENST00000374685.4
ENST00000413614.2 ENST00000374680.3 |
RXRB
|
retinoid X receptor, beta |
| chr19_-_13044494 | 0.71 |
ENST00000593021.1
ENST00000587981.1 ENST00000423140.2 ENST00000314606.4 |
FARSA
|
phenylalanyl-tRNA synthetase, alpha subunit |
| chr9_-_100000957 | 0.70 |
ENST00000366109.2
ENST00000607322.1 |
RP11-498P14.5
|
RP11-498P14.5 |
| chr16_+_30662050 | 0.68 |
ENST00000568754.1
|
PRR14
|
proline rich 14 |
| chr19_-_5622991 | 0.68 |
ENST00000252542.4
|
SAFB2
|
scaffold attachment factor B2 |
| chr9_+_131873659 | 0.68 |
ENST00000452489.2
ENST00000347048.4 ENST00000357197.4 ENST00000445241.1 ENST00000355007.3 ENST00000414331.1 |
PPP2R4
|
protein phosphatase 2A activator, regulatory subunit 4 |
| chr4_+_76439095 | 0.65 |
ENST00000506261.1
|
THAP6
|
THAP domain containing 6 |
| chr20_+_44563267 | 0.64 |
ENST00000372409.3
|
PCIF1
|
PDX1 C-terminal inhibiting factor 1 |
| chr19_-_19774473 | 0.63 |
ENST00000357324.6
|
ATP13A1
|
ATPase type 13A1 |
| chr1_+_16693578 | 0.61 |
ENST00000401088.4
ENST00000471507.1 ENST00000401089.3 ENST00000375590.3 ENST00000492354.1 |
SZRD1
|
SUZ RNA binding domain containing 1 |
| chr11_-_62477041 | 0.61 |
ENST00000433053.1
|
BSCL2
|
Berardinelli-Seip congenital lipodystrophy 2 (seipin) |
| chr12_-_114404111 | 0.61 |
ENST00000545145.2
ENST00000392561.3 ENST00000261741.5 |
RBM19
|
RNA binding motif protein 19 |
| chr14_+_97925151 | 0.61 |
ENST00000554862.1
ENST00000554260.1 ENST00000499910.2 |
CTD-2506J14.1
|
CTD-2506J14.1 |
| chr3_-_48700310 | 0.59 |
ENST00000164024.4
ENST00000544264.1 |
CELSR3
|
cadherin, EGF LAG seven-pass G-type receptor 3 |
| chr17_-_42767092 | 0.59 |
ENST00000588687.1
|
CCDC43
|
coiled-coil domain containing 43 |
| chr19_+_19030478 | 0.58 |
ENST00000247003.4
|
DDX49
|
DEAD (Asp-Glu-Ala-Asp) box polypeptide 49 |
| chr19_+_17326141 | 0.58 |
ENST00000445667.2
ENST00000263897.5 |
USE1
|
unconventional SNARE in the ER 1 homolog (S. cerevisiae) |
| chr19_+_48248779 | 0.58 |
ENST00000246802.5
|
GLTSCR2
|
glioma tumor suppressor candidate region gene 2 |
| chr19_+_4791722 | 0.57 |
ENST00000269856.3
|
FEM1A
|
fem-1 homolog a (C. elegans) |
| chr1_+_11333546 | 0.57 |
ENST00000376804.2
|
UBIAD1
|
UbiA prenyltransferase domain containing 1 |
| chr7_-_72971934 | 0.57 |
ENST00000411832.1
|
BCL7B
|
B-cell CLL/lymphoma 7B |
| chr6_+_26020672 | 0.57 |
ENST00000357647.3
|
HIST1H3A
|
histone cluster 1, H3a |
| chr4_-_109541539 | 0.56 |
ENST00000509984.1
ENST00000507248.1 ENST00000506795.1 |
RPL34-AS1
|
RPL34 antisense RNA 1 (head to head) |
| chr16_+_30662360 | 0.56 |
ENST00000542965.2
|
PRR14
|
proline rich 14 |
| chr19_+_19030497 | 0.55 |
ENST00000438170.2
|
DDX49
|
DEAD (Asp-Glu-Ala-Asp) box polypeptide 49 |
| chr5_+_139944396 | 0.55 |
ENST00000514199.1
|
SLC35A4
|
solute carrier family 35, member A4 |
| chr2_+_25015968 | 0.55 |
ENST00000380834.2
ENST00000473706.1 |
CENPO
|
centromere protein O |
| chr19_+_507299 | 0.54 |
ENST00000359315.5
|
TPGS1
|
tubulin polyglutamylase complex subunit 1 |
| chr5_+_139944024 | 0.54 |
ENST00000323146.3
|
SLC35A4
|
solute carrier family 35, member A4 |
| chr6_-_27840099 | 0.54 |
ENST00000328488.2
|
HIST1H3I
|
histone cluster 1, H3i |
| chr12_-_108955070 | 0.54 |
ENST00000228284.3
ENST00000546611.1 |
SART3
|
squamous cell carcinoma antigen recognized by T cells 3 |
| chr11_+_47270475 | 0.53 |
ENST00000481889.2
ENST00000436778.1 ENST00000531660.1 ENST00000407404.1 |
NR1H3
|
nuclear receptor subfamily 1, group H, member 3 |
| chr19_+_48949087 | 0.53 |
ENST00000598711.1
|
GRWD1
|
glutamate-rich WD repeat containing 1 |
| chr7_-_99716914 | 0.53 |
ENST00000431404.2
|
TAF6
|
TAF6 RNA polymerase II, TATA box binding protein (TBP)-associated factor, 80kDa |
| chr17_-_33448468 | 0.52 |
ENST00000591723.1
ENST00000593039.1 ENST00000587405.1 |
RAD51L3-RFFL
RAD51D
|
Uncharacterized protein RAD51 paralog D |
| chr22_+_39916558 | 0.52 |
ENST00000337304.2
ENST00000396680.1 |
ATF4
|
activating transcription factor 4 |
| chr19_+_5623083 | 0.52 |
ENST00000292123.5
ENST00000592224.1 ENST00000454510.1 ENST00000433404.1 ENST00000588852.1 |
SAFB
|
scaffold attachment factor B |
| chrX_-_16888276 | 0.51 |
ENST00000493145.1
|
RBBP7
|
retinoblastoma binding protein 7 |
| chr11_-_47270341 | 0.51 |
ENST00000529444.1
ENST00000530453.1 ENST00000537863.1 ENST00000529788.1 ENST00000444355.2 ENST00000527256.1 ENST00000529663.1 ENST00000256997.3 |
ACP2
|
acid phosphatase 2, lysosomal |
| chr11_-_62477103 | 0.51 |
ENST00000532818.1
|
BSCL2
|
Berardinelli-Seip congenital lipodystrophy 2 (seipin) |
| chr16_+_2564254 | 0.51 |
ENST00000565223.1
|
ATP6V0C
|
ATPase, H+ transporting, lysosomal 16kDa, V0 subunit c |
| chr12_-_7079805 | 0.51 |
ENST00000536316.2
ENST00000542912.1 ENST00000440277.1 ENST00000545167.1 ENST00000546111.1 ENST00000399433.2 ENST00000535923.1 |
PHB2
|
prohibitin 2 |
| chr4_+_76439649 | 0.50 |
ENST00000507557.1
|
THAP6
|
THAP domain containing 6 |
| chr19_-_50316517 | 0.50 |
ENST00000313777.4
ENST00000445575.2 |
FUZ
|
fuzzy planar cell polarity protein |
| chr16_-_88772670 | 0.49 |
ENST00000562544.1
|
RNF166
|
ring finger protein 166 |
| chr2_-_74757066 | 0.49 |
ENST00000377526.3
|
AUP1
|
ancient ubiquitous protein 1 |
| chr6_+_26217159 | 0.49 |
ENST00000303910.2
|
HIST1H2AE
|
histone cluster 1, H2ae |
| chr19_+_36545833 | 0.49 |
ENST00000401500.2
ENST00000270301.7 ENST00000427823.2 |
WDR62
|
WD repeat domain 62 |
| chr14_-_23504432 | 0.48 |
ENST00000425762.2
|
PSMB5
|
proteasome (prosome, macropain) subunit, beta type, 5 |
| chr11_-_62476965 | 0.48 |
ENST00000405837.1
ENST00000531524.1 |
BSCL2
|
Berardinelli-Seip congenital lipodystrophy 2 (seipin) |
| chr9_-_97356075 | 0.48 |
ENST00000375337.3
|
FBP2
|
fructose-1,6-bisphosphatase 2 |
| chr19_+_17326191 | 0.48 |
ENST00000595101.1
ENST00000596136.1 ENST00000379776.4 |
USE1
|
unconventional SNARE in the ER 1 homolog (S. cerevisiae) |
| chr12_+_94071129 | 0.47 |
ENST00000552983.1
ENST00000332896.3 ENST00000552033.1 ENST00000548483.1 |
CRADD
|
CASP2 and RIPK1 domain containing adaptor with death domain |
| chr20_+_30697298 | 0.47 |
ENST00000398022.2
|
TM9SF4
|
transmembrane 9 superfamily protein member 4 |
| chr7_-_73097741 | 0.47 |
ENST00000395176.2
|
DNAJC30
|
DnaJ (Hsp40) homolog, subfamily C, member 30 |
| chr9_-_35658007 | 0.47 |
ENST00000602361.1
|
RMRP
|
RNA component of mitochondrial RNA processing endoribonuclease |
| chr4_-_2010562 | 0.47 |
ENST00000411649.1
ENST00000542778.1 ENST00000411638.2 ENST00000431323.1 |
NELFA
|
negative elongation factor complex member A |
| chr8_+_77596014 | 0.46 |
ENST00000523885.1
|
ZFHX4
|
zinc finger homeobox 4 |
| chr17_+_4843654 | 0.46 |
ENST00000575111.1
|
RNF167
|
ring finger protein 167 |
| chr19_-_41903161 | 0.46 |
ENST00000602129.1
ENST00000593771.1 ENST00000596905.1 ENST00000221233.4 |
EXOSC5
|
exosome component 5 |
| chr19_-_50316489 | 0.45 |
ENST00000533418.1
|
FUZ
|
fuzzy planar cell polarity protein |
| chr19_-_56110859 | 0.45 |
ENST00000221665.3
ENST00000592585.1 |
FIZ1
|
FLT3-interacting zinc finger 1 |
| chr1_+_1167594 | 0.45 |
ENST00000379198.2
|
B3GALT6
|
UDP-Gal:betaGal beta 1,3-galactosyltransferase polypeptide 6 |
| chr19_-_3869012 | 0.45 |
ENST00000592398.1
ENST00000262961.4 ENST00000439086.2 |
ZFR2
|
zinc finger RNA binding protein 2 |
| chr1_+_156756667 | 0.44 |
ENST00000526188.1
ENST00000454659.1 |
PRCC
|
papillary renal cell carcinoma (translocation-associated) |
| chr19_-_36545649 | 0.44 |
ENST00000292894.1
|
THAP8
|
THAP domain containing 8 |
| chr17_+_4843413 | 0.44 |
ENST00000572430.1
ENST00000262482.6 |
RNF167
|
ring finger protein 167 |
| chr6_-_44281043 | 0.44 |
ENST00000244571.4
|
AARS2
|
alanyl-tRNA synthetase 2, mitochondrial |
| chr16_-_30773372 | 0.43 |
ENST00000545825.1
ENST00000541260.1 |
C16orf93
|
chromosome 16 open reading frame 93 |
| chr3_+_47866490 | 0.43 |
ENST00000457607.1
|
DHX30
|
DEAH (Asp-Glu-Ala-His) box helicase 30 |
| chr22_+_35796056 | 0.43 |
ENST00000216122.4
|
MCM5
|
minichromosome maintenance complex component 5 |
| chr16_+_30709530 | 0.43 |
ENST00000411466.2
|
SRCAP
|
Snf2-related CREBBP activator protein |
| chr11_+_695787 | 0.43 |
ENST00000526170.1
ENST00000488769.1 |
TMEM80
|
transmembrane protein 80 |
| chr19_-_50316423 | 0.43 |
ENST00000528094.1
ENST00000526575.1 |
FUZ
|
fuzzy planar cell polarity protein |
| chrX_-_153059811 | 0.42 |
ENST00000427365.2
ENST00000444450.1 ENST00000370093.1 |
IDH3G
|
isocitrate dehydrogenase 3 (NAD+) gamma |
| chr12_+_58087901 | 0.42 |
ENST00000315970.7
ENST00000547079.1 ENST00000439210.2 ENST00000389146.6 ENST00000413095.2 ENST00000551035.1 ENST00000257966.8 ENST00000435406.2 ENST00000550372.1 ENST00000389142.5 |
OS9
|
osteosarcoma amplified 9, endoplasmic reticulum lectin |
| chr10_-_103347883 | 0.42 |
ENST00000339310.3
ENST00000370158.3 ENST00000299206.4 ENST00000456836.2 ENST00000413344.1 ENST00000429502.1 ENST00000430045.1 ENST00000370172.1 ENST00000436284.2 ENST00000370162.3 |
POLL
|
polymerase (DNA directed), lambda |
| chr1_+_161129240 | 0.42 |
ENST00000492950.1
|
USP21
|
ubiquitin specific peptidase 21 |
| chr19_-_4670345 | 0.42 |
ENST00000599630.1
ENST00000262947.3 |
C19orf10
|
chromosome 19 open reading frame 10 |
| chr19_+_5623186 | 0.42 |
ENST00000538656.1
|
SAFB
|
scaffold attachment factor B |
| chr17_-_4843316 | 0.42 |
ENST00000544061.2
|
SLC25A11
|
solute carrier family 25 (mitochondrial carrier; oxoglutarate carrier), member 11 |
| chr1_-_46769261 | 0.42 |
ENST00000343304.6
|
LRRC41
|
leucine rich repeat containing 41 |
| chr1_-_27226928 | 0.42 |
ENST00000361720.5
|
GPATCH3
|
G patch domain containing 3 |
| chr17_-_3571934 | 0.42 |
ENST00000225525.3
|
TAX1BP3
|
Tax1 (human T-cell leukemia virus type I) binding protein 3 |
| chr9_-_131709858 | 0.42 |
ENST00000372586.3
|
DOLK
|
dolichol kinase |
| chr17_+_4843352 | 0.41 |
ENST00000573404.1
ENST00000576452.1 |
RNF167
|
ring finger protein 167 |
| chr8_-_145515055 | 0.41 |
ENST00000526552.1
ENST00000529231.1 ENST00000307404.5 |
BOP1
|
block of proliferation 1 |
| chr12_+_58087738 | 0.41 |
ENST00000552285.1
|
OS9
|
osteosarcoma amplified 9, endoplasmic reticulum lectin |
| chr9_+_108424738 | 0.41 |
ENST00000334077.3
|
TAL2
|
T-cell acute lymphocytic leukemia 2 |
| chr1_-_149785236 | 0.41 |
ENST00000331491.1
|
HIST2H3D
|
histone cluster 2, H3d |
| chr1_+_161129254 | 0.41 |
ENST00000368002.3
ENST00000289865.8 ENST00000479344.1 ENST00000368001.1 |
USP21
|
ubiquitin specific peptidase 21 |
| chr1_-_228594490 | 0.41 |
ENST00000366699.3
ENST00000284551.6 |
TRIM11
|
tripartite motif containing 11 |
| chrX_+_70338552 | 0.41 |
ENST00000374080.3
ENST00000429213.1 |
MED12
|
mediator complex subunit 12 |
| chr22_+_35796108 | 0.41 |
ENST00000382011.5
ENST00000416905.1 |
MCM5
|
minichromosome maintenance complex component 5 |
| chr8_-_145688231 | 0.41 |
ENST00000530374.1
|
CYHR1
|
cysteine/histidine-rich 1 |
| chr14_-_23504087 | 0.40 |
ENST00000493471.2
ENST00000460922.2 |
PSMB5
|
proteasome (prosome, macropain) subunit, beta type, 5 |
| chr16_+_67927147 | 0.40 |
ENST00000291041.5
|
PSKH1
|
protein serine kinase H1 |
| chr6_+_33168597 | 0.40 |
ENST00000374675.3
|
SLC39A7
|
solute carrier family 39 (zinc transporter), member 7 |
| chr1_+_6684918 | 0.40 |
ENST00000054650.4
|
THAP3
|
THAP domain containing, apoptosis associated protein 3 |
| chr11_+_67250490 | 0.40 |
ENST00000528641.2
ENST00000279146.3 |
AIP
|
aryl hydrocarbon receptor interacting protein |
| chr7_+_73097890 | 0.40 |
ENST00000265758.2
ENST00000423166.2 ENST00000423497.1 |
WBSCR22
|
Williams Beuren syndrome chromosome region 22 |
| chr12_+_124155652 | 0.40 |
ENST00000426174.2
ENST00000303372.5 |
TCTN2
|
tectonic family member 2 |
| chr17_-_4843206 | 0.39 |
ENST00000576951.1
|
SLC25A11
|
solute carrier family 25 (mitochondrial carrier; oxoglutarate carrier), member 11 |
| chr9_+_131709966 | 0.39 |
ENST00000372577.2
|
NUP188
|
nucleoporin 188kDa |
| chr22_+_30752606 | 0.39 |
ENST00000399824.2
ENST00000405659.1 ENST00000338306.3 |
CCDC157
|
coiled-coil domain containing 157 |
| chr14_-_23504337 | 0.39 |
ENST00000361611.6
|
PSMB5
|
proteasome (prosome, macropain) subunit, beta type, 5 |
| chr6_+_37225540 | 0.39 |
ENST00000373491.3
|
TBC1D22B
|
TBC1 domain family, member 22B |
| chr1_-_149900122 | 0.39 |
ENST00000271628.8
|
SF3B4
|
splicing factor 3b, subunit 4, 49kDa |
| chr12_-_108954933 | 0.39 |
ENST00000431469.2
ENST00000546815.1 |
SART3
|
squamous cell carcinoma antigen recognized by T cells 3 |
| chr16_+_30006997 | 0.39 |
ENST00000304516.7
|
INO80E
|
INO80 complex subunit E |
| chr2_-_242576864 | 0.39 |
ENST00000407315.1
|
THAP4
|
THAP domain containing 4 |
| chr16_+_30773636 | 0.39 |
ENST00000402121.3
ENST00000565995.1 ENST00000563683.1 ENST00000357890.5 ENST00000565931.1 |
RNF40
|
ring finger protein 40, E3 ubiquitin protein ligase |
| chrX_-_153059958 | 0.39 |
ENST00000370092.3
ENST00000217901.5 |
IDH3G
|
isocitrate dehydrogenase 3 (NAD+) gamma |
| chrX_+_153656978 | 0.38 |
ENST00000369762.2
ENST00000422890.1 |
ATP6AP1
|
ATPase, H+ transporting, lysosomal accessory protein 1 |
| chrX_-_153141783 | 0.38 |
ENST00000458029.1
|
L1CAM
|
L1 cell adhesion molecule |
| chr9_-_139304979 | 0.38 |
ENST00000357365.3
ENST00000371723.4 |
SDCCAG3
|
serologically defined colon cancer antigen 3 |
| chr6_-_33756867 | 0.38 |
ENST00000293760.5
|
LEMD2
|
LEM domain containing 2 |
| chrX_+_153059608 | 0.38 |
ENST00000370087.1
|
SSR4
|
signal sequence receptor, delta |
| chr19_-_9237626 | 0.38 |
ENST00000305444.2
|
OR7G3
|
olfactory receptor, family 7, subfamily G, member 3 |
| chr17_+_38296576 | 0.38 |
ENST00000264645.7
|
CASC3
|
cancer susceptibility candidate 3 |
| chr17_+_74732889 | 0.38 |
ENST00000591864.1
|
MFSD11
|
major facilitator superfamily domain containing 11 |
| chr17_+_4843303 | 0.38 |
ENST00000571816.1
|
RNF167
|
ring finger protein 167 |
| chr19_+_11546153 | 0.38 |
ENST00000591946.1
ENST00000252455.2 ENST00000412601.1 |
PRKCSH
|
protein kinase C substrate 80K-H |
| chr19_+_11546093 | 0.37 |
ENST00000591462.1
|
PRKCSH
|
protein kinase C substrate 80K-H |
| chrX_+_153237740 | 0.37 |
ENST00000369982.4
|
TMEM187
|
transmembrane protein 187 |
| chr19_+_18043810 | 0.37 |
ENST00000445755.2
|
CCDC124
|
coiled-coil domain containing 124 |
| chr2_-_190044480 | 0.37 |
ENST00000374866.3
|
COL5A2
|
collagen, type V, alpha 2 |
| chr15_+_42120283 | 0.37 |
ENST00000542534.2
ENST00000397299.4 ENST00000408047.1 ENST00000431823.1 ENST00000382448.4 ENST00000342159.4 |
PLA2G4B
JMJD7
JMJD7-PLA2G4B
|
phospholipase A2, group IVB (cytosolic) jumonji domain containing 7 JMJD7-PLA2G4B readthrough |
| chr10_-_75532373 | 0.37 |
ENST00000595757.1
|
AC022400.2
|
Uncharacterized protein; cDNA FLJ44715 fis, clone BRACE3021430 |
| chr19_-_39421377 | 0.37 |
ENST00000430193.3
ENST00000600042.1 ENST00000221431.6 |
SARS2
|
seryl-tRNA synthetase 2, mitochondrial |
| chr19_+_38865176 | 0.37 |
ENST00000215071.4
|
PSMD8
|
proteasome (prosome, macropain) 26S subunit, non-ATPase, 8 |
| chr22_-_38245304 | 0.36 |
ENST00000609454.1
|
ANKRD54
|
ankyrin repeat domain 54 |
| chr19_+_50145328 | 0.36 |
ENST00000360565.3
|
SCAF1
|
SR-related CTD-associated factor 1 |
| chr9_+_131133598 | 0.36 |
ENST00000372853.4
ENST00000452446.1 ENST00000372850.1 ENST00000372847.1 |
URM1
|
ubiquitin related modifier 1 |
| chr19_-_2151523 | 0.36 |
ENST00000350812.6
ENST00000355272.6 ENST00000356926.4 ENST00000345016.5 |
AP3D1
|
adaptor-related protein complex 3, delta 1 subunit |
| chr3_-_49131473 | 0.36 |
ENST00000430979.1
ENST00000357496.2 ENST00000437939.1 |
QRICH1
|
glutamine-rich 1 |
| chr4_+_154178520 | 0.36 |
ENST00000433687.1
|
TRIM2
|
tripartite motif containing 2 |
| chr7_+_139025875 | 0.36 |
ENST00000297534.6
|
C7orf55
|
chromosome 7 open reading frame 55 |
| chr17_+_7487146 | 0.36 |
ENST00000396501.4
ENST00000584378.1 ENST00000423172.2 ENST00000579445.1 ENST00000585217.1 ENST00000581380.1 |
MPDU1
|
mannose-P-dolichol utilization defect 1 |
| chr6_+_33168637 | 0.36 |
ENST00000374677.3
|
SLC39A7
|
solute carrier family 39 (zinc transporter), member 7 |
| chr6_-_31509506 | 0.36 |
ENST00000449757.1
|
DDX39B
|
DEAD (Asp-Glu-Ala-Asp) box polypeptide 39B |
| chr1_+_202317855 | 0.36 |
ENST00000356764.2
|
PPP1R12B
|
protein phosphatase 1, regulatory subunit 12B |
| chr19_+_984313 | 0.35 |
ENST00000251289.5
ENST00000587001.2 ENST00000607440.1 |
WDR18
|
WD repeat domain 18 |
| chr4_+_56814968 | 0.35 |
ENST00000422247.2
|
CEP135
|
centrosomal protein 135kDa |
| chr3_+_52489503 | 0.35 |
ENST00000345716.4
|
NISCH
|
nischarin |
| chr19_+_38865398 | 0.35 |
ENST00000585598.1
ENST00000602911.1 ENST00000592561.1 |
PSMD8
|
proteasome (prosome, macropain) 26S subunit, non-ATPase, 8 |
| chr16_-_88772761 | 0.35 |
ENST00000567844.1
ENST00000312838.4 |
RNF166
|
ring finger protein 166 |
| chr5_-_137514288 | 0.35 |
ENST00000454473.1
ENST00000418329.1 ENST00000455658.2 ENST00000230901.5 ENST00000402931.1 |
BRD8
|
bromodomain containing 8 |
| chr3_-_127317047 | 0.35 |
ENST00000462228.1
ENST00000490643.1 |
TPRA1
|
transmembrane protein, adipocyte asscociated 1 |
| chr8_+_145515263 | 0.35 |
ENST00000528838.1
|
HSF1
|
heat shock transcription factor 1 |
| chr19_-_2456922 | 0.35 |
ENST00000582871.1
ENST00000325327.3 |
LMNB2
|
lamin B2 |
| chr6_-_121655850 | 0.35 |
ENST00000422369.1
|
TBC1D32
|
TBC1 domain family, member 32 |
| chr17_-_80231557 | 0.35 |
ENST00000392334.2
ENST00000314028.6 |
CSNK1D
|
casein kinase 1, delta |
| chr11_-_62414070 | 0.35 |
ENST00000540933.1
ENST00000346178.4 ENST00000356638.3 ENST00000534779.1 ENST00000525994.1 |
GANAB
|
glucosidase, alpha; neutral AB |
| chr6_+_33168189 | 0.35 |
ENST00000444757.1
|
SLC39A7
|
solute carrier family 39 (zinc transporter), member 7 |
| chr6_-_43484718 | 0.35 |
ENST00000372422.2
|
YIPF3
|
Yip1 domain family, member 3 |
| chr1_-_1167411 | 0.34 |
ENST00000263741.7
|
SDF4
|
stromal cell derived factor 4 |
| chrX_+_153060090 | 0.34 |
ENST00000370086.3
ENST00000370085.3 |
SSR4
|
signal sequence receptor, delta |
| chr19_-_19030157 | 0.34 |
ENST00000349893.4
ENST00000351079.4 ENST00000600932.1 ENST00000262812.4 |
COPE
|
coatomer protein complex, subunit epsilon |
| chr16_-_70557430 | 0.34 |
ENST00000393612.4
ENST00000564653.1 ENST00000323786.5 |
COG4
|
component of oligomeric golgi complex 4 |
| chr6_-_27858570 | 0.34 |
ENST00000359303.2
|
HIST1H3J
|
histone cluster 1, H3j |
| chr9_-_130742792 | 0.34 |
ENST00000373095.1
|
FAM102A
|
family with sequence similarity 102, member A |
| chr17_-_17399701 | 0.34 |
ENST00000225688.3
ENST00000579152.1 |
RASD1
|
RAS, dexamethasone-induced 1 |
| chr5_+_159343688 | 0.34 |
ENST00000306675.3
|
ADRA1B
|
adrenoceptor alpha 1B |
| chr11_-_117166201 | 0.34 |
ENST00000510915.1
|
BACE1
|
beta-site APP-cleaving enzyme 1 |
| chr3_-_52567792 | 0.34 |
ENST00000307092.4
ENST00000422318.2 ENST00000459839.1 |
NT5DC2
|
5'-nucleotidase domain containing 2 |
| chr5_-_138739739 | 0.34 |
ENST00000514983.1
ENST00000507779.2 ENST00000451821.2 ENST00000450845.2 ENST00000509959.1 ENST00000302091.5 |
SPATA24
|
spermatogenesis associated 24 |
| chr18_-_44775554 | 0.34 |
ENST00000425639.1
ENST00000400404.1 |
SKOR2
|
SKI family transcriptional corepressor 2 |
| chr17_+_4843679 | 0.34 |
ENST00000576229.1
|
RNF167
|
ring finger protein 167 |
| chr19_+_48949030 | 0.34 |
ENST00000253237.5
|
GRWD1
|
glutamate-rich WD repeat containing 1 |
| chr5_-_176981417 | 0.34 |
ENST00000514747.1
ENST00000443375.2 ENST00000329540.5 |
FAM193B
|
family with sequence similarity 193, member B |
| chr19_-_10946949 | 0.34 |
ENST00000214869.2
ENST00000591695.1 |
TMED1
|
transmembrane emp24 protein transport domain containing 1 |
| chr19_-_39340563 | 0.34 |
ENST00000601813.1
|
HNRNPL
|
heterogeneous nuclear ribonucleoprotein L |
| chr19_+_11546440 | 0.33 |
ENST00000589126.1
ENST00000588269.1 ENST00000587509.1 ENST00000592741.1 ENST00000593101.1 ENST00000587327.1 |
PRKCSH
|
protein kinase C substrate 80K-H |
| chr1_-_156252590 | 0.33 |
ENST00000361813.5
ENST00000368267.5 |
SMG5
|
SMG5 nonsense mediated mRNA decay factor |
| chr5_-_148930731 | 0.33 |
ENST00000515748.2
|
CSNK1A1
|
casein kinase 1, alpha 1 |
| chrX_-_53254358 | 0.33 |
ENST00000404049.3
|
KDM5C
|
lysine (K)-specific demethylase 5C |
| chr1_-_1167346 | 0.33 |
ENST00000545427.1
ENST00000360001.6 |
SDF4
|
stromal cell derived factor 4 |
| chr3_+_52489606 | 0.33 |
ENST00000488380.1
ENST00000420808.2 |
NISCH
|
nischarin |
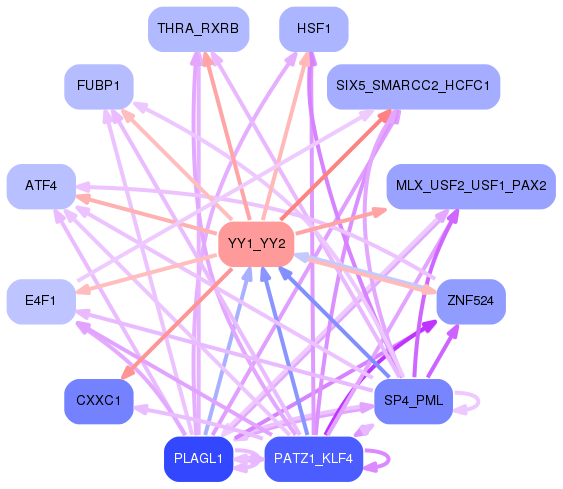
Network of associatons between targets according to the STRING database.

First level regulatory network of YY1_YY2
Gene Ontology Analysis
Gene overrepresentation in biological_process category:
| Log-likelihood per target | Total log-likelihood | Term | Description |
|---|---|---|---|
| 0.9 | 3.5 | GO:0019046 | release from viral latency(GO:0019046) |
| 0.3 | 1.4 | GO:2000314 | regulation of neural crest formation(GO:0090299) negative regulation of neural crest formation(GO:0090301) negative regulation of fibroblast growth factor receptor signaling pathway involved in neural plate anterior/posterior pattern formation(GO:2000314) |
| 0.2 | 0.7 | GO:0061394 | regulation of transcription from RNA polymerase II promoter in response to arsenic-containing substance(GO:0061394) |
| 0.2 | 0.7 | GO:1902824 | positive regulation of late endosome to lysosome transport(GO:1902824) |
| 0.2 | 0.6 | GO:0006427 | histidyl-tRNA aminoacylation(GO:0006427) |
| 0.2 | 0.8 | GO:0015742 | alpha-ketoglutarate transport(GO:0015742) |
| 0.2 | 0.5 | GO:0006419 | alanyl-tRNA aminoacylation(GO:0006419) |
| 0.2 | 0.5 | GO:0048250 | mitochondrial iron ion transport(GO:0048250) |
| 0.2 | 1.3 | GO:0000430 | regulation of transcription from RNA polymerase II promoter by glucose(GO:0000430) positive regulation of transcription from RNA polymerase II promoter by glucose(GO:0000432) |
| 0.2 | 0.5 | GO:1902512 | positive regulation of apoptotic DNA fragmentation(GO:1902512) |
| 0.2 | 1.2 | GO:0006102 | isocitrate metabolic process(GO:0006102) |
| 0.2 | 0.8 | GO:0090341 | negative regulation of secretion of lysosomal enzymes(GO:0090341) |
| 0.2 | 0.2 | GO:0036090 | cleavage furrow ingression(GO:0036090) |
| 0.2 | 0.5 | GO:0006425 | glutaminyl-tRNA aminoacylation(GO:0006425) |
| 0.2 | 0.5 | GO:0002940 | tRNA N2-guanine methylation(GO:0002940) |
| 0.2 | 0.5 | GO:0005986 | sucrose biosynthetic process(GO:0005986) |
| 0.1 | 0.1 | GO:0060395 | SMAD protein signal transduction(GO:0060395) |
| 0.1 | 0.6 | GO:0042412 | taurine biosynthetic process(GO:0042412) |
| 0.1 | 2.9 | GO:0075522 | IRES-dependent viral translational initiation(GO:0075522) |
| 0.1 | 0.8 | GO:0015887 | biotin transport(GO:0015878) pantothenate transmembrane transport(GO:0015887) |
| 0.1 | 0.4 | GO:0030997 | regulation of centriole-centriole cohesion(GO:0030997) |
| 0.1 | 0.4 | GO:1903225 | negative regulation of endodermal cell differentiation(GO:1903225) |
| 0.1 | 0.7 | GO:0034227 | tRNA thio-modification(GO:0034227) |
| 0.1 | 0.4 | GO:0006434 | seryl-tRNA aminoacylation(GO:0006434) |
| 0.1 | 0.1 | GO:0001731 | formation of translation preinitiation complex(GO:0001731) |
| 0.1 | 0.4 | GO:0048007 | synaptic vesicle recycling via endosome(GO:0036466) antigen processing and presentation of lipid antigen via MHC class Ib(GO:0048003) antigen processing and presentation, exogenous lipid antigen via MHC class Ib(GO:0048007) |
| 0.1 | 0.6 | GO:1990414 | replication-born double-strand break repair via sister chromatid exchange(GO:1990414) |
| 0.1 | 0.7 | GO:0009233 | menaquinone metabolic process(GO:0009233) |
| 0.1 | 0.3 | GO:0048213 | Golgi vesicle prefusion complex stabilization(GO:0048213) |
| 0.1 | 0.3 | GO:0001994 | norepinephrine-epinephrine vasoconstriction involved in regulation of systemic arterial blood pressure(GO:0001994) |
| 0.1 | 0.9 | GO:0090245 | axis elongation involved in somitogenesis(GO:0090245) |
| 0.1 | 0.6 | GO:0071051 | polyadenylation-dependent snoRNA 3'-end processing(GO:0071051) |
| 0.1 | 0.3 | GO:0036023 | limb joint morphogenesis(GO:0036022) embryonic skeletal limb joint morphogenesis(GO:0036023) |
| 0.1 | 0.3 | GO:0007439 | ectodermal digestive tract development(GO:0007439) embryonic ectodermal digestive tract development(GO:0048611) |
| 0.1 | 0.3 | GO:1900737 | regulation of proteinase activated receptor activity(GO:1900276) negative regulation of phospholipase C-activating G-protein coupled receptor signaling pathway(GO:1900737) |
| 0.1 | 0.5 | GO:0043983 | histone H4-K12 acetylation(GO:0043983) |
| 0.1 | 0.3 | GO:2000118 | regulation of sodium-dependent phosphate transport(GO:2000118) |
| 0.1 | 0.2 | GO:0046016 | positive regulation of transcription by glucose(GO:0046016) |
| 0.1 | 0.3 | GO:0006210 | pyrimidine nucleobase catabolic process(GO:0006208) thymine catabolic process(GO:0006210) thymine metabolic process(GO:0019859) |
| 0.1 | 0.7 | GO:0006432 | phenylalanyl-tRNA aminoacylation(GO:0006432) |
| 0.1 | 0.4 | GO:0046338 | phosphatidylethanolamine catabolic process(GO:0046338) |
| 0.1 | 0.3 | GO:0000349 | generation of catalytic spliceosome for first transesterification step(GO:0000349) |
| 0.1 | 1.0 | GO:2000767 | positive regulation of cytoplasmic translation(GO:2000767) |
| 0.1 | 0.4 | GO:0000354 | cis assembly of pre-catalytic spliceosome(GO:0000354) |
| 0.1 | 0.3 | GO:0007493 | endodermal cell fate determination(GO:0007493) |
| 0.1 | 0.6 | GO:0051697 | protein delipidation(GO:0051697) |
| 0.1 | 0.4 | GO:0045648 | positive regulation of erythrocyte differentiation(GO:0045648) |
| 0.1 | 0.7 | GO:2001206 | positive regulation of osteoclast development(GO:2001206) |
| 0.1 | 0.4 | GO:0002190 | cap-independent translational initiation(GO:0002190) |
| 0.1 | 1.0 | GO:1904153 | negative regulation of protein exit from endoplasmic reticulum(GO:0070862) negative regulation of retrograde protein transport, ER to cytosol(GO:1904153) |
| 0.1 | 0.3 | GO:0035574 | histone H4-K20 demethylation(GO:0035574) |
| 0.1 | 0.3 | GO:1905224 | clathrin-coated pit assembly(GO:1905224) |
| 0.1 | 0.4 | GO:1902775 | mitochondrial large ribosomal subunit assembly(GO:1902775) |
| 0.1 | 0.3 | GO:0001172 | transcription, RNA-templated(GO:0001172) |
| 0.1 | 0.5 | GO:0042695 | thelarche(GO:0042695) mammary gland branching involved in thelarche(GO:0060744) |
| 0.1 | 0.6 | GO:0045448 | regulation of mitotic cell cycle, embryonic(GO:0009794) mitotic cell cycle, embryonic(GO:0045448) |
| 0.1 | 0.2 | GO:1904897 | regulation of hepatic stellate cell proliferation(GO:1904897) positive regulation of hepatic stellate cell proliferation(GO:1904899) hepatic stellate cell proliferation(GO:1990922) |
| 0.1 | 0.1 | GO:0042376 | phylloquinone metabolic process(GO:0042374) phylloquinone catabolic process(GO:0042376) quinone catabolic process(GO:1901662) |
| 0.1 | 0.8 | GO:0045218 | zonula adherens maintenance(GO:0045218) |
| 0.1 | 0.3 | GO:1904116 | response to vasopressin(GO:1904116) cellular response to vasopressin(GO:1904117) |
| 0.1 | 0.1 | GO:0017055 | negative regulation of RNA polymerase II transcriptional preinitiation complex assembly(GO:0017055) |
| 0.1 | 0.2 | GO:1900126 | negative regulation of hyaluronan biosynthetic process(GO:1900126) |
| 0.1 | 0.1 | GO:0072738 | response to diamide(GO:0072737) cellular response to diamide(GO:0072738) |
| 0.1 | 0.2 | GO:0071418 | cellular response to amine stimulus(GO:0071418) |
| 0.1 | 0.5 | GO:0036515 | serotonergic neuron axon guidance(GO:0036515) |
| 0.1 | 0.3 | GO:0098582 | innate vocalization behavior(GO:0098582) |
| 0.1 | 1.0 | GO:0000463 | maturation of LSU-rRNA from tricistronic rRNA transcript (SSU-rRNA, 5.8S rRNA, LSU-rRNA)(GO:0000463) |
| 0.1 | 0.2 | GO:0033037 | polysaccharide localization(GO:0033037) |
| 0.1 | 0.4 | GO:0006287 | base-excision repair, gap-filling(GO:0006287) |
| 0.1 | 0.1 | GO:0046543 | development of secondary female sexual characteristics(GO:0046543) |
| 0.1 | 0.3 | GO:0060928 | cardiac septum cell differentiation(GO:0003292) atrioventricular node cell differentiation(GO:0060922) atrioventricular node cell development(GO:0060928) |
| 0.1 | 0.1 | GO:1904059 | regulation of locomotor rhythm(GO:1904059) |
| 0.1 | 1.0 | GO:0070072 | proton-transporting V-type ATPase complex assembly(GO:0070070) vacuolar proton-transporting V-type ATPase complex assembly(GO:0070072) |
| 0.1 | 0.7 | GO:0006268 | DNA unwinding involved in DNA replication(GO:0006268) |
| 0.1 | 0.3 | GO:0072344 | rescue of stalled ribosome(GO:0072344) |
| 0.1 | 0.9 | GO:0061051 | positive regulation of cell growth involved in cardiac muscle cell development(GO:0061051) |
| 0.1 | 1.7 | GO:0006488 | dolichol-linked oligosaccharide biosynthetic process(GO:0006488) |
| 0.1 | 0.8 | GO:0071421 | manganese ion transmembrane transport(GO:0071421) |
| 0.1 | 0.3 | GO:0046203 | spermidine catabolic process(GO:0046203) |
| 0.1 | 0.6 | GO:0000023 | maltose metabolic process(GO:0000023) |
| 0.1 | 0.4 | GO:0010286 | heat acclimation(GO:0010286) cellular heat acclimation(GO:0070370) |
| 0.1 | 0.2 | GO:0070446 | cellular response to caloric restriction(GO:0061433) negative regulation of oligodendrocyte progenitor proliferation(GO:0070446) |
| 0.1 | 0.2 | GO:0051898 | negative regulation of protein kinase B signaling(GO:0051898) |
| 0.1 | 0.2 | GO:0061428 | negative regulation of transcription from RNA polymerase II promoter in response to hypoxia(GO:0061428) |
| 0.1 | 0.2 | GO:0019858 | cytosine metabolic process(GO:0019858) |
| 0.1 | 0.2 | GO:1902396 | protein localization to bicellular tight junction(GO:1902396) |
| 0.1 | 0.2 | GO:1902630 | regulation of membrane hyperpolarization(GO:1902630) |
| 0.1 | 0.9 | GO:0000244 | spliceosomal tri-snRNP complex assembly(GO:0000244) |
| 0.1 | 0.2 | GO:0055099 | response to high density lipoprotein particle(GO:0055099) |
| 0.1 | 0.5 | GO:0000707 | meiotic DNA recombinase assembly(GO:0000707) |
| 0.1 | 0.2 | GO:0006624 | vacuolar protein processing(GO:0006624) |
| 0.1 | 0.4 | GO:0051344 | regulation of cyclic-nucleotide phosphodiesterase activity(GO:0051342) negative regulation of cyclic-nucleotide phosphodiesterase activity(GO:0051344) |
| 0.1 | 0.5 | GO:0023021 | termination of signal transduction(GO:0023021) |
| 0.1 | 0.2 | GO:1900110 | negative regulation of histone H3-K9 dimethylation(GO:1900110) |
| 0.1 | 2.0 | GO:0034389 | lipid particle organization(GO:0034389) |
| 0.1 | 0.2 | GO:0051758 | homologous chromosome movement towards spindle pole involved in homologous chromosome segregation(GO:0051758) |
| 0.1 | 0.2 | GO:0009405 | pathogenesis(GO:0009405) |
| 0.1 | 0.3 | GO:0007228 | positive regulation of hh target transcription factor activity(GO:0007228) |
| 0.1 | 0.2 | GO:0006119 | oxidative phosphorylation(GO:0006119) |
| 0.1 | 0.1 | GO:0061188 | negative regulation of chromatin silencing at rDNA(GO:0061188) |
| 0.1 | 0.2 | GO:1904596 | regulation of connective tissue replacement involved in inflammatory response wound healing(GO:1904596) negative regulation of connective tissue replacement involved in inflammatory response wound healing(GO:1904597) regulation of advanced glycation end-product receptor activity(GO:1904603) negative regulation of advanced glycation end-product receptor activity(GO:1904604) negative regulation of connective tissue replacement(GO:1905204) |
| 0.1 | 0.3 | GO:0033615 | mitochondrial proton-transporting ATP synthase complex assembly(GO:0033615) |
| 0.1 | 0.5 | GO:0007288 | sperm axoneme assembly(GO:0007288) |
| 0.1 | 0.3 | GO:2001170 | myofibroblast differentiation(GO:0036446) regulation of myofibroblast differentiation(GO:1904760) negative regulation of ATP biosynthetic process(GO:2001170) |
| 0.1 | 0.3 | GO:0042335 | cuticle development(GO:0042335) |
| 0.1 | 0.3 | GO:0060528 | secretory columnal luminar epithelial cell differentiation involved in prostate glandular acinus development(GO:0060528) |
| 0.1 | 0.2 | GO:0090214 | spongiotrophoblast layer developmental growth(GO:0090214) |
| 0.1 | 0.3 | GO:0007197 | adenylate cyclase-inhibiting G-protein coupled acetylcholine receptor signaling pathway(GO:0007197) |
| 0.1 | 0.4 | GO:0043314 | negative regulation of neutrophil degranulation(GO:0043314) |
| 0.1 | 0.3 | GO:0019418 | sulfide oxidation(GO:0019418) sulfide oxidation, using sulfide:quinone oxidoreductase(GO:0070221) |
| 0.1 | 0.5 | GO:0017185 | peptidyl-lysine hydroxylation(GO:0017185) |
| 0.1 | 0.2 | GO:0019243 | methylglyoxal catabolic process to D-lactate via S-lactoyl-glutathione(GO:0019243) methylglyoxal catabolic process(GO:0051596) methylglyoxal catabolic process to lactate(GO:0061727) |
| 0.0 | 0.2 | GO:2001178 | mediator complex assembly(GO:0036034) regulation of mediator complex assembly(GO:2001176) positive regulation of mediator complex assembly(GO:2001178) |
| 0.0 | 0.1 | GO:0015680 | intracellular copper ion transport(GO:0015680) |
| 0.0 | 0.1 | GO:0034970 | histone H3-R2 methylation(GO:0034970) |
| 0.0 | 0.1 | GO:1903697 | negative regulation of microvillus assembly(GO:1903697) |
| 0.0 | 1.7 | GO:0090383 | phagosome acidification(GO:0090383) |
| 0.0 | 0.3 | GO:0050727 | regulation of inflammatory response(GO:0050727) |
| 0.0 | 0.2 | GO:0033686 | positive regulation of luteinizing hormone secretion(GO:0033686) |
| 0.0 | 0.3 | GO:1903377 | negative regulation of oxidative stress-induced neuron intrinsic apoptotic signaling pathway(GO:1903377) |
| 0.0 | 0.3 | GO:1904209 | regulation of chemokine (C-C motif) ligand 2 secretion(GO:1904207) positive regulation of chemokine (C-C motif) ligand 2 secretion(GO:1904209) |
| 0.0 | 0.1 | GO:0002025 | vasodilation by norepinephrine-epinephrine involved in regulation of systemic arterial blood pressure(GO:0002025) |
| 0.0 | 0.3 | GO:1904354 | negative regulation of telomere capping(GO:1904354) |
| 0.0 | 0.3 | GO:0006013 | mannose metabolic process(GO:0006013) |
| 0.0 | 0.8 | GO:0000183 | chromatin silencing at rDNA(GO:0000183) |
| 0.0 | 0.1 | GO:0099558 | maintenance of synapse structure(GO:0099558) |
| 0.0 | 0.3 | GO:1904749 | regulation of protein localization to nucleolus(GO:1904749) |
| 0.0 | 0.2 | GO:0060391 | positive regulation of SMAD protein import into nucleus(GO:0060391) |
| 0.0 | 0.4 | GO:0034316 | negative regulation of Arp2/3 complex-mediated actin nucleation(GO:0034316) |
| 0.0 | 0.3 | GO:0014823 | response to activity(GO:0014823) |
| 0.0 | 0.4 | GO:0090521 | glomerular visceral epithelial cell migration(GO:0090521) |
| 0.0 | 0.1 | GO:0090370 | negative regulation of cholesterol efflux(GO:0090370) |
| 0.0 | 0.0 | GO:0032079 | positive regulation of endodeoxyribonuclease activity(GO:0032079) |
| 0.0 | 0.3 | GO:0070475 | rRNA base methylation(GO:0070475) |
| 0.0 | 0.1 | GO:1903251 | multi-ciliated epithelial cell differentiation(GO:1903251) |
| 0.0 | 0.1 | GO:0009447 | putrescine catabolic process(GO:0009447) |
| 0.0 | 0.1 | GO:0006114 | glycerol biosynthetic process(GO:0006114) |
| 0.0 | 0.3 | GO:2000270 | negative regulation of fibroblast apoptotic process(GO:2000270) |
| 0.0 | 0.2 | GO:0009138 | pyrimidine nucleoside diphosphate metabolic process(GO:0009138) |
| 0.0 | 0.2 | GO:0071955 | recycling endosome to Golgi transport(GO:0071955) |
| 0.0 | 0.4 | GO:1904715 | negative regulation of chaperone-mediated autophagy(GO:1904715) |
| 0.0 | 1.0 | GO:1900364 | negative regulation of mRNA polyadenylation(GO:1900364) |
| 0.0 | 0.1 | GO:0021718 | superior olivary nucleus development(GO:0021718) superior olivary nucleus maturation(GO:0021722) |
| 0.0 | 0.3 | GO:0046604 | positive regulation of mitotic centrosome separation(GO:0046604) |
| 0.0 | 0.1 | GO:0009786 | regulation of asymmetric cell division(GO:0009786) |
| 0.0 | 0.4 | GO:0045039 | protein import into mitochondrial inner membrane(GO:0045039) |
| 0.0 | 0.2 | GO:0043375 | negative regulation of cellular pH reduction(GO:0032848) CD8-positive, alpha-beta T cell lineage commitment(GO:0043375) negative regulation of retinal cell programmed cell death(GO:0046671) |
| 0.0 | 0.1 | GO:0071586 | CAAX-box protein processing(GO:0071586) CAAX-box protein maturation(GO:0080120) |
| 0.0 | 0.5 | GO:0021942 | radial glia guided migration of Purkinje cell(GO:0021942) |
| 0.0 | 0.3 | GO:0070092 | regulation of glucagon secretion(GO:0070092) |
| 0.0 | 0.3 | GO:1903593 | eosinophil activation involved in immune response(GO:0002278) eosinophil mediated immunity(GO:0002447) eosinophil activation(GO:0043307) eosinophil degranulation(GO:0043308) regulation of histamine secretion by mast cell(GO:1903593) |
| 0.0 | 0.1 | GO:1900736 | regulation of phospholipase C-activating G-protein coupled receptor signaling pathway(GO:1900736) positive regulation of phospholipase C-activating G-protein coupled receptor signaling pathway(GO:1900738) |
| 0.0 | 0.3 | GO:0034086 | maintenance of sister chromatid cohesion(GO:0034086) maintenance of mitotic sister chromatid cohesion(GO:0034088) |
| 0.0 | 0.1 | GO:0044240 | multicellular organism lipid catabolic process(GO:0044240) |
| 0.0 | 0.0 | GO:0010265 | SCF complex assembly(GO:0010265) |
| 0.0 | 0.2 | GO:0035105 | sterol regulatory element binding protein import into nucleus(GO:0035105) |
| 0.0 | 0.4 | GO:0045471 | response to ethanol(GO:0045471) |
| 0.0 | 0.1 | GO:1903093 | regulation of protein K48-linked deubiquitination(GO:1903093) negative regulation of protein K48-linked deubiquitination(GO:1903094) negative regulation of ubiquitin-specific protease activity(GO:2000157) |
| 0.0 | 0.1 | GO:0015671 | oxygen transport(GO:0015671) |
| 0.0 | 0.1 | GO:0031587 | positive regulation of inositol 1,4,5-trisphosphate-sensitive calcium-release channel activity(GO:0031587) |
| 0.0 | 0.4 | GO:0030263 | apoptotic chromosome condensation(GO:0030263) |
| 0.0 | 0.1 | GO:0051754 | meiotic sister chromatid cohesion, centromeric(GO:0051754) |
| 0.0 | 0.4 | GO:0061365 | positive regulation of lipoprotein lipase activity(GO:0051006) positive regulation of triglyceride lipase activity(GO:0061365) |
| 0.0 | 0.4 | GO:0046598 | positive regulation of viral entry into host cell(GO:0046598) |
| 0.0 | 0.3 | GO:0090238 | positive regulation of arachidonic acid secretion(GO:0090238) |
| 0.0 | 0.4 | GO:0038003 | opioid receptor signaling pathway(GO:0038003) |
| 0.0 | 0.1 | GO:0044537 | regulation of circulating fibrinogen levels(GO:0044537) |
| 0.0 | 0.9 | GO:0006744 | ubiquinone biosynthetic process(GO:0006744) quinone biosynthetic process(GO:1901663) |
| 0.0 | 0.1 | GO:0014707 | branchiomeric skeletal muscle development(GO:0014707) |
| 0.0 | 0.0 | GO:0033092 | positive regulation of immature T cell proliferation in thymus(GO:0033092) |
| 0.0 | 0.3 | GO:1902659 | regulation of glucose mediated signaling pathway(GO:1902659) |
| 0.0 | 0.3 | GO:0090385 | phagosome-lysosome fusion(GO:0090385) |
| 0.0 | 0.1 | GO:0002262 | myeloid cell homeostasis(GO:0002262) |
| 0.0 | 0.2 | GO:0070901 | mitochondrial tRNA methylation(GO:0070901) |
| 0.0 | 0.2 | GO:0045716 | positive regulation of low-density lipoprotein particle receptor biosynthetic process(GO:0045716) |
| 0.0 | 0.2 | GO:0006879 | cellular iron ion homeostasis(GO:0006879) |
| 0.0 | 0.1 | GO:0046041 | ITP metabolic process(GO:0046041) |
| 0.0 | 0.5 | GO:1901096 | regulation of autophagosome maturation(GO:1901096) |
| 0.0 | 0.3 | GO:0033299 | secretion of lysosomal enzymes(GO:0033299) |
| 0.0 | 0.1 | GO:0002949 | tRNA threonylcarbamoyladenosine modification(GO:0002949) |
| 0.0 | 0.3 | GO:1903265 | positive regulation of tumor necrosis factor-mediated signaling pathway(GO:1903265) |
| 0.0 | 1.0 | GO:0031498 | chromatin disassembly(GO:0031498) |
| 0.0 | 0.4 | GO:0000389 | mRNA 3'-splice site recognition(GO:0000389) |
| 0.0 | 0.5 | GO:0045945 | positive regulation of transcription from RNA polymerase III promoter(GO:0045945) |
| 0.0 | 0.2 | GO:0008295 | spermidine biosynthetic process(GO:0008295) |
| 0.0 | 0.3 | GO:0003322 | pancreatic A cell development(GO:0003322) |
| 0.0 | 0.5 | GO:0001833 | inner cell mass cell proliferation(GO:0001833) |
| 0.0 | 0.1 | GO:0060017 | parathyroid gland development(GO:0060017) |
| 0.0 | 0.4 | GO:0002329 | pre-B cell differentiation(GO:0002329) |
| 0.0 | 0.1 | GO:1904530 | negative regulation of actin filament binding(GO:1904530) negative regulation of actin binding(GO:1904617) |
| 0.0 | 0.2 | GO:0019626 | short-chain fatty acid catabolic process(GO:0019626) |
| 0.0 | 0.2 | GO:0043328 | protein targeting to vacuole involved in ubiquitin-dependent protein catabolic process via the multivesicular body sorting pathway(GO:0043328) |
| 0.0 | 0.6 | GO:0034384 | high-density lipoprotein particle clearance(GO:0034384) |
| 0.0 | 0.2 | GO:0003065 | positive regulation of heart rate by epinephrine(GO:0003065) |
| 0.0 | 0.1 | GO:0035606 | peptidyl-cysteine S-trans-nitrosylation(GO:0035606) |
| 0.0 | 0.6 | GO:0043248 | proteasome assembly(GO:0043248) |
| 0.0 | 0.2 | GO:0051182 | coenzyme transport(GO:0051182) |
| 0.0 | 0.3 | GO:0010571 | positive regulation of nuclear cell cycle DNA replication(GO:0010571) |
| 0.0 | 4.0 | GO:0036498 | IRE1-mediated unfolded protein response(GO:0036498) |
| 0.0 | 0.1 | GO:1904247 | positive regulation of polynucleotide adenylyltransferase activity(GO:1904247) |
| 0.0 | 0.2 | GO:0006420 | arginyl-tRNA aminoacylation(GO:0006420) |
| 0.0 | 0.4 | GO:0034720 | histone H3-K4 demethylation(GO:0034720) |
| 0.0 | 1.5 | GO:0006270 | DNA replication initiation(GO:0006270) |
| 0.0 | 1.0 | GO:0048025 | negative regulation of mRNA splicing, via spliceosome(GO:0048025) |
| 0.0 | 0.2 | GO:0008626 | granzyme-mediated apoptotic signaling pathway(GO:0008626) |
| 0.0 | 0.3 | GO:0070197 | meiotic telomere tethering at nuclear periphery(GO:0044821) meiotic attachment of telomere to nuclear envelope(GO:0070197) chromosome attachment to the nuclear envelope(GO:0097240) |
| 0.0 | 0.1 | GO:0030505 | inorganic diphosphate transport(GO:0030505) |
| 0.0 | 0.2 | GO:0045007 | depurination(GO:0045007) |
| 0.0 | 1.0 | GO:0043968 | histone H2A acetylation(GO:0043968) |
| 0.0 | 0.3 | GO:1902846 | regulation of spindle elongation(GO:0032887) regulation of mitotic spindle elongation(GO:0032888) anastral spindle assembly(GO:0055048) protein localization to spindle pole body(GO:0071988) regulation of protein localization to spindle pole body(GO:1902363) positive regulation of protein localization to spindle pole body(GO:1902365) positive regulation of mitotic spindle elongation(GO:1902846) |
| 0.0 | 0.1 | GO:0061485 | memory T cell proliferation(GO:0061485) |
| 0.0 | 0.1 | GO:0043456 | regulation of pentose-phosphate shunt(GO:0043456) |
| 0.0 | 0.2 | GO:0035407 | histone H3-T11 phosphorylation(GO:0035407) |
| 0.0 | 0.4 | GO:0040016 | embryonic cleavage(GO:0040016) |
| 0.0 | 0.1 | GO:1904562 | phosphatidylinositol 5-phosphate metabolic process(GO:1904562) |
| 0.0 | 0.1 | GO:0060988 | lipid tube assembly(GO:0060988) |
| 0.0 | 0.2 | GO:0035694 | mitochondrial protein catabolic process(GO:0035694) |
| 0.0 | 0.2 | GO:0019542 | acetate biosynthetic process(GO:0019413) acetyl-CoA biosynthetic process from acetate(GO:0019427) propionate metabolic process(GO:0019541) propionate biosynthetic process(GO:0019542) |
| 0.0 | 0.6 | GO:0009650 | UV protection(GO:0009650) |
| 0.0 | 0.6 | GO:0006265 | DNA topological change(GO:0006265) |
| 0.0 | 0.4 | GO:0021794 | thalamus development(GO:0021794) |
| 0.0 | 0.1 | GO:0007525 | somatic muscle development(GO:0007525) |
| 0.0 | 0.7 | GO:0000028 | ribosomal small subunit assembly(GO:0000028) |
| 0.0 | 0.6 | GO:0003376 | sphingosine-1-phosphate signaling pathway(GO:0003376) sphingolipid mediated signaling pathway(GO:0090520) |
| 0.0 | 0.3 | GO:2000210 | positive regulation of anoikis(GO:2000210) |
| 0.0 | 0.2 | GO:0072695 | negative regulation of DNA recombination at telomere(GO:0048239) regulation of DNA recombination at telomere(GO:0072695) |
| 0.0 | 0.2 | GO:0021993 | midbrain-hindbrain boundary morphogenesis(GO:0021555) initiation of neural tube closure(GO:0021993) |
| 0.0 | 0.4 | GO:0045721 | negative regulation of gluconeogenesis(GO:0045721) |
| 0.0 | 1.0 | GO:0006491 | N-glycan processing(GO:0006491) |
| 0.0 | 0.1 | GO:0060392 | negative regulation of SMAD protein import into nucleus(GO:0060392) |
| 0.0 | 0.1 | GO:0061737 | leukotriene signaling pathway(GO:0061737) |
| 0.0 | 0.1 | GO:0070584 | mitochondrion morphogenesis(GO:0070584) |
| 0.0 | 1.4 | GO:0050911 | detection of chemical stimulus involved in sensory perception of smell(GO:0050911) |
| 0.0 | 0.2 | GO:1902499 | positive regulation of protein autoubiquitination(GO:1902499) |
| 0.0 | 0.3 | GO:0006682 | galactosylceramide biosynthetic process(GO:0006682) galactolipid biosynthetic process(GO:0019375) |
| 0.0 | 0.1 | GO:1903862 | positive regulation of oxidative phosphorylation(GO:1903862) |
| 0.0 | 0.1 | GO:0000294 | nuclear-transcribed mRNA catabolic process, endonucleolytic cleavage-dependent decay(GO:0000294) |
| 0.0 | 0.2 | GO:0032007 | negative regulation of TOR signaling(GO:0032007) |
| 0.0 | 0.1 | GO:0033599 | regulation of mammary gland epithelial cell proliferation(GO:0033599) |
| 0.0 | 0.4 | GO:0006924 | activation-induced cell death of T cells(GO:0006924) |
| 0.0 | 0.3 | GO:0000821 | regulation of arginine metabolic process(GO:0000821) |
| 0.0 | 0.2 | GO:0006390 | transcription from mitochondrial promoter(GO:0006390) |
| 0.0 | 0.3 | GO:0042904 | 9-cis-retinoic acid biosynthetic process(GO:0042904) 9-cis-retinoic acid metabolic process(GO:0042905) |
| 0.0 | 0.6 | GO:0030150 | protein import into mitochondrial matrix(GO:0030150) |
| 0.0 | 1.1 | GO:0006882 | cellular zinc ion homeostasis(GO:0006882) |
| 0.0 | 0.1 | GO:1902019 | regulation of cilium movement involved in cell motility(GO:0060295) regulation of cilium beat frequency involved in ciliary motility(GO:0060296) regulation of cilium-dependent cell motility(GO:1902019) |
| 0.0 | 0.1 | GO:0034499 | late endosome to Golgi transport(GO:0034499) |
| 0.0 | 0.3 | GO:0006782 | protoporphyrinogen IX biosynthetic process(GO:0006782) |
| 0.0 | 0.1 | GO:0046707 | IDP metabolic process(GO:0046707) IDP catabolic process(GO:0046709) |
| 0.0 | 0.1 | GO:0035927 | RNA import into mitochondrion(GO:0035927) rRNA import into mitochondrion(GO:0035928) |
| 0.0 | 0.2 | GO:0042593 | carbohydrate homeostasis(GO:0033500) glucose homeostasis(GO:0042593) |
| 0.0 | 0.1 | GO:1900748 | positive regulation of vascular endothelial growth factor signaling pathway(GO:1900748) |
| 0.0 | 0.0 | GO:1901264 | carbohydrate derivative transport(GO:1901264) |
| 0.0 | 0.2 | GO:0009635 | response to herbicide(GO:0009635) |
| 0.0 | 0.4 | GO:2000291 | regulation of myoblast proliferation(GO:2000291) |
| 0.0 | 0.2 | GO:0002943 | tRNA dihydrouridine synthesis(GO:0002943) |
| 0.0 | 0.0 | GO:0021775 | smoothened signaling pathway involved in ventral spinal cord interneuron specification(GO:0021775) smoothened signaling pathway involved in spinal cord motor neuron cell fate specification(GO:0021776) |
| 0.0 | 0.1 | GO:0045053 | protein retention in Golgi apparatus(GO:0045053) |
| 0.0 | 0.1 | GO:0072429 | response to intra-S DNA damage checkpoint signaling(GO:0072429) |
| 0.0 | 0.1 | GO:0001927 | exocyst assembly(GO:0001927) |
| 0.0 | 0.2 | GO:0014029 | neural crest formation(GO:0014029) |
| 0.0 | 0.3 | GO:2000786 | positive regulation of autophagosome assembly(GO:2000786) |
| 0.0 | 0.2 | GO:1900363 | regulation of mRNA polyadenylation(GO:1900363) |
| 0.0 | 0.4 | GO:0035330 | regulation of hippo signaling(GO:0035330) |
| 0.0 | 0.2 | GO:0051418 | interphase microtubule nucleation by interphase microtubule organizing center(GO:0051415) microtubule nucleation by microtubule organizing center(GO:0051418) |
| 0.0 | 0.1 | GO:0016260 | selenocysteine biosynthetic process(GO:0016260) |
| 0.0 | 0.1 | GO:1902174 | positive regulation of keratinocyte apoptotic process(GO:1902174) |
| 0.0 | 0.3 | GO:0007258 | JUN phosphorylation(GO:0007258) |
| 0.0 | 0.2 | GO:0044211 | CTP salvage(GO:0044211) |
| 0.0 | 0.6 | GO:0030970 | retrograde protein transport, ER to cytosol(GO:0030970) |
| 0.0 | 0.1 | GO:2000535 | regulation of entry of bacterium into host cell(GO:2000535) |
| 0.0 | 0.1 | GO:0071543 | diadenosine polyphosphate catabolic process(GO:0015961) diphosphoinositol polyphosphate metabolic process(GO:0071543) diadenosine pentaphosphate metabolic process(GO:1901906) diadenosine pentaphosphate catabolic process(GO:1901907) diadenosine hexaphosphate metabolic process(GO:1901908) diadenosine hexaphosphate catabolic process(GO:1901909) adenosine 5'-(hexahydrogen pentaphosphate) metabolic process(GO:1901910) adenosine 5'-(hexahydrogen pentaphosphate) catabolic process(GO:1901911) |
| 0.0 | 0.2 | GO:0045732 | positive regulation of protein catabolic process(GO:0045732) |
| 0.0 | 0.1 | GO:0010936 | negative regulation of macrophage cytokine production(GO:0010936) |
| 0.0 | 0.3 | GO:0060056 | mammary gland involution(GO:0060056) |
| 0.0 | 0.2 | GO:0036500 | ATF6-mediated unfolded protein response(GO:0036500) |
| 0.0 | 0.0 | GO:0035359 | negative regulation of peroxisome proliferator activated receptor signaling pathway(GO:0035359) |
| 0.0 | 0.1 | GO:0071348 | cellular response to interleukin-11(GO:0071348) |
| 0.0 | 0.1 | GO:0045897 | positive regulation of transcription during mitosis(GO:0045897) |
| 0.0 | 0.1 | GO:1905040 | vestibulocochlear nerve structural organization(GO:0021649) positive regulation of cytokine activity(GO:0060301) renal artery morphogenesis(GO:0061441) ganglion morphogenesis(GO:0061552) VEGF-activated neuropilin signaling pathway involved in axon guidance(GO:1902378) dorsal root ganglion morphogenesis(GO:1904835) otic placode development(GO:1905040) |
| 0.0 | 0.1 | GO:0070634 | transepithelial ammonium transport(GO:0070634) |
| 0.0 | 0.1 | GO:0060412 | ventricular septum morphogenesis(GO:0060412) |
| 0.0 | 0.4 | GO:2000311 | regulation of alpha-amino-3-hydroxy-5-methyl-4-isoxazole propionate selective glutamate receptor activity(GO:2000311) |
| 0.0 | 0.5 | GO:1902224 | ketone body metabolic process(GO:1902224) |
| 0.0 | 0.2 | GO:0060753 | regulation of mast cell chemotaxis(GO:0060753) |
| 0.0 | 0.5 | GO:0045899 | positive regulation of RNA polymerase II transcriptional preinitiation complex assembly(GO:0045899) |
| 0.0 | 0.4 | GO:0048243 | norepinephrine secretion(GO:0048243) |
| 0.0 | 0.0 | GO:0043461 | proton-transporting ATP synthase complex assembly(GO:0043461) proton-transporting ATP synthase complex biogenesis(GO:0070272) |
| 0.0 | 0.1 | GO:0060356 | leucine import(GO:0060356) |
| 0.0 | 0.1 | GO:2000393 | negative regulation of lamellipodium morphogenesis(GO:2000393) |
| 0.0 | 0.2 | GO:2000117 | negative regulation of cysteine-type endopeptidase activity(GO:2000117) |
| 0.0 | 0.0 | GO:0035924 | cellular response to vascular endothelial growth factor stimulus(GO:0035924) |
| 0.0 | 0.3 | GO:0000290 | deadenylation-dependent decapping of nuclear-transcribed mRNA(GO:0000290) |
| 0.0 | 0.1 | GO:0061073 | ciliary body morphogenesis(GO:0061073) |
| 0.0 | 0.3 | GO:0018026 | peptidyl-lysine monomethylation(GO:0018026) |
| 0.0 | 0.2 | GO:0034465 | response to carbon monoxide(GO:0034465) |
| 0.0 | 0.6 | GO:1990126 | retrograde transport, endosome to plasma membrane(GO:1990126) |
| 0.0 | 0.4 | GO:0032688 | negative regulation of interferon-beta production(GO:0032688) |
| 0.0 | 0.1 | GO:0060161 | positive regulation of dopamine receptor signaling pathway(GO:0060161) |
| 0.0 | 0.4 | GO:0008298 | intracellular mRNA localization(GO:0008298) |
| 0.0 | 0.2 | GO:0021564 | vagus nerve development(GO:0021564) |
| 0.0 | 0.0 | GO:0006429 | leucyl-tRNA aminoacylation(GO:0006429) |
| 0.0 | 0.3 | GO:0035562 | negative regulation of chromatin binding(GO:0035562) |
| 0.0 | 0.1 | GO:0060068 | vagina development(GO:0060068) |
| 0.0 | 0.2 | GO:0002052 | positive regulation of neuroblast proliferation(GO:0002052) |
| 0.0 | 0.1 | GO:0007256 | activation of JNKK activity(GO:0007256) |
| 0.0 | 0.4 | GO:0018022 | peptidyl-lysine methylation(GO:0018022) |
| 0.0 | 0.1 | GO:1903450 | regulation of G1 to G0 transition(GO:1903450) positive regulation of G1 to G0 transition(GO:1903452) |
| 0.0 | 0.2 | GO:0048845 | venous blood vessel morphogenesis(GO:0048845) |
| 0.0 | 0.3 | GO:0090179 | planar cell polarity pathway involved in neural tube closure(GO:0090179) |
| 0.0 | 0.1 | GO:0034729 | histone H3-K79 methylation(GO:0034729) |
| 0.0 | 0.2 | GO:1904262 | negative regulation of TORC1 signaling(GO:1904262) |
| 0.0 | 0.1 | GO:0071934 | thiamine transmembrane transport(GO:0071934) |
| 0.0 | 0.2 | GO:0061162 | establishment of monopolar cell polarity(GO:0061162) establishment or maintenance of monopolar cell polarity(GO:0061339) |
| 0.0 | 0.2 | GO:0015991 | ATP hydrolysis coupled proton transport(GO:0015991) |
| 0.0 | 0.6 | GO:0032011 | ARF protein signal transduction(GO:0032011) |
| 0.0 | 0.0 | GO:2000273 | positive regulation of receptor activity(GO:2000273) |
| 0.0 | 0.1 | GO:0043163 | cell envelope organization(GO:0043163) external encapsulating structure organization(GO:0045229) |
| 0.0 | 1.4 | GO:0006521 | regulation of cellular amino acid metabolic process(GO:0006521) |
| 0.0 | 0.1 | GO:0060434 | bronchus morphogenesis(GO:0060434) |
| 0.0 | 0.1 | GO:0097646 | calcitonin family receptor signaling pathway(GO:0097646) amylin receptor signaling pathway(GO:0097647) |
| 0.0 | 0.1 | GO:0098787 | mRNA cleavage involved in mRNA processing(GO:0098787) pre-mRNA cleavage required for polyadenylation(GO:0098789) |
| 0.0 | 0.0 | GO:1903691 | positive regulation of wound healing, spreading of epidermal cells(GO:1903691) |
| 0.0 | 0.1 | GO:0030950 | establishment or maintenance of actin cytoskeleton polarity(GO:0030950) |
| 0.0 | 0.1 | GO:0051533 | positive regulation of NFAT protein import into nucleus(GO:0051533) |
| 0.0 | 0.2 | GO:0048712 | negative regulation of astrocyte differentiation(GO:0048712) |
| 0.0 | 0.1 | GO:0042059 | negative regulation of epidermal growth factor receptor signaling pathway(GO:0042059) |
| 0.0 | 0.1 | GO:0060154 | cellular process regulating host cell cycle in response to virus(GO:0060154) |
| 0.0 | 0.1 | GO:0032929 | negative regulation of superoxide anion generation(GO:0032929) |
| 0.0 | 0.0 | GO:0060648 | mammary gland bud morphogenesis(GO:0060648) |
| 0.0 | 0.2 | GO:0035542 | regulation of SNARE complex assembly(GO:0035542) |
| 0.0 | 0.0 | GO:0006423 | cysteinyl-tRNA aminoacylation(GO:0006423) |
| 0.0 | 0.2 | GO:0036503 | ERAD pathway(GO:0036503) |
| 0.0 | 0.0 | GO:0006117 | acetaldehyde metabolic process(GO:0006117) |
| 0.0 | 0.6 | GO:0015012 | heparan sulfate proteoglycan biosynthetic process(GO:0015012) |
| 0.0 | 0.4 | GO:0043523 | regulation of neuron apoptotic process(GO:0043523) |
| 0.0 | 0.1 | GO:2000765 | regulation of cytoplasmic translation(GO:2000765) negative regulation of cytoplasmic translation(GO:2000766) |
| 0.0 | 0.2 | GO:0001711 | endodermal cell fate commitment(GO:0001711) |
| 0.0 | 0.4 | GO:0060670 | branching involved in labyrinthine layer morphogenesis(GO:0060670) |
| 0.0 | 0.2 | GO:0051085 | chaperone mediated protein folding requiring cofactor(GO:0051085) |
| 0.0 | 0.2 | GO:0035897 | proteolysis in other organism(GO:0035897) |
| 0.0 | 0.0 | GO:0030299 | intestinal cholesterol absorption(GO:0030299) intestinal lipid absorption(GO:0098856) |
| 0.0 | 0.2 | GO:0033197 | response to vitamin E(GO:0033197) |
| 0.0 | 0.1 | GO:0010693 | negative regulation of alkaline phosphatase activity(GO:0010693) |
| 0.0 | 0.2 | GO:2000465 | regulation of glycogen (starch) synthase activity(GO:2000465) |
| 0.0 | 0.1 | GO:0097498 | endothelial tube lumen extension(GO:0097498) |
| 0.0 | 0.1 | GO:0038018 | Wnt receptor catabolic process(GO:0038018) |
| 0.0 | 0.3 | GO:0060044 | negative regulation of cardiac muscle cell proliferation(GO:0060044) |
| 0.0 | 0.3 | GO:1903020 | positive regulation of glycoprotein metabolic process(GO:1903020) |
| 0.0 | 0.1 | GO:0061484 | hematopoietic stem cell homeostasis(GO:0061484) |
| 0.0 | 0.1 | GO:0018401 | peptidyl-proline hydroxylation to 4-hydroxy-L-proline(GO:0018401) |
| 0.0 | 0.0 | GO:0043012 | regulation of fusion of sperm to egg plasma membrane(GO:0043012) |
| 0.0 | 0.1 | GO:0010457 | centriole-centriole cohesion(GO:0010457) |
| 0.0 | 0.1 | GO:0070173 | regulation of enamel mineralization(GO:0070173) |
| 0.0 | 0.1 | GO:0007185 | transmembrane receptor protein tyrosine phosphatase signaling pathway(GO:0007185) |
| 0.0 | 0.1 | GO:0009838 | abscission(GO:0009838) |
| 0.0 | 0.3 | GO:0010960 | magnesium ion homeostasis(GO:0010960) |
| 0.0 | 0.1 | GO:0006975 | DNA damage induced protein phosphorylation(GO:0006975) |
| 0.0 | 0.3 | GO:1990118 | sodium ion import across plasma membrane(GO:0098719) sodium ion import into cell(GO:1990118) |
| 0.0 | 0.0 | GO:0072221 | distal convoluted tubule development(GO:0072025) metanephric distal convoluted tubule development(GO:0072221) |
| 0.0 | 0.1 | GO:0036414 | protein citrullination(GO:0018101) histone citrullination(GO:0036414) |
| 0.0 | 0.1 | GO:0040032 | post-embryonic body morphogenesis(GO:0040032) |
| 0.0 | 0.0 | GO:0090190 | positive regulation of branching involved in ureteric bud morphogenesis(GO:0090190) |
| 0.0 | 0.0 | GO:0038193 | thromboxane A2 signaling pathway(GO:0038193) |
| 0.0 | 0.1 | GO:0033140 | negative regulation of peptidyl-serine phosphorylation of STAT protein(GO:0033140) |
| 0.0 | 0.1 | GO:0032815 | negative regulation of natural killer cell activation(GO:0032815) |
| 0.0 | 0.1 | GO:1903859 | regulation of dendrite extension(GO:1903859) positive regulation of dendrite extension(GO:1903861) |
| 0.0 | 0.2 | GO:0070886 | positive regulation of calcineurin-NFAT signaling cascade(GO:0070886) |
| 0.0 | 0.1 | GO:0035881 | amacrine cell differentiation(GO:0035881) |
| 0.0 | 0.0 | GO:0046901 | tetrahydrofolylpolyglutamate biosynthetic process(GO:0046901) |
| 0.0 | 0.1 | GO:0003406 | retinal pigment epithelium development(GO:0003406) |
| 0.0 | 0.2 | GO:0071550 | death-inducing signaling complex assembly(GO:0071550) |
| 0.0 | 0.1 | GO:0032099 | negative regulation of response to food(GO:0032096) negative regulation of appetite(GO:0032099) |
| 0.0 | 0.1 | GO:0003215 | cardiac right ventricle morphogenesis(GO:0003215) |
| 0.0 | 0.1 | GO:0048026 | positive regulation of mRNA splicing, via spliceosome(GO:0048026) |
| 0.0 | 0.1 | GO:0010165 | response to X-ray(GO:0010165) |
| 0.0 | 0.2 | GO:0034162 | toll-like receptor 9 signaling pathway(GO:0034162) |
| 0.0 | 0.0 | GO:0032006 | regulation of TOR signaling(GO:0032006) |
| 0.0 | 0.1 | GO:0031573 | intra-S DNA damage checkpoint(GO:0031573) |
| 0.0 | 0.1 | GO:0071494 | cellular response to UV-C(GO:0071494) |
| 0.0 | 0.0 | GO:0021764 | amygdala development(GO:0021764) |
| 0.0 | 0.1 | GO:0021557 | optic cup structural organization(GO:0003409) oculomotor nerve development(GO:0021557) oculomotor nerve morphogenesis(GO:0021622) oculomotor nerve formation(GO:0021623) |
| 0.0 | 0.1 | GO:1902952 | positive regulation of dendritic spine maintenance(GO:1902952) |
| 0.0 | 0.2 | GO:0003264 | cardioblast proliferation(GO:0003263) regulation of cardioblast proliferation(GO:0003264) |
| 0.0 | 0.1 | GO:0071802 | negative regulation of podosome assembly(GO:0071802) |
| 0.0 | 0.0 | GO:0007008 | outer mitochondrial membrane organization(GO:0007008) protein import into mitochondrial outer membrane(GO:0045040) establishment of protein localization to mitochondrial membrane(GO:0090151) |
| 0.0 | 0.1 | GO:1904378 | maintenance of unfolded protein(GO:0036506) maintenance of unfolded protein involved in ERAD pathway(GO:1904378) |
| 0.0 | 0.4 | GO:0018345 | protein palmitoylation(GO:0018345) |
| 0.0 | 0.1 | GO:0006857 | oligopeptide transport(GO:0006857) |
| 0.0 | 0.2 | GO:0098780 | response to mitochondrial depolarisation(GO:0098780) |
| 0.0 | 0.1 | GO:0008631 | intrinsic apoptotic signaling pathway in response to oxidative stress(GO:0008631) |
| 0.0 | 0.0 | GO:0009236 | cobalamin biosynthetic process(GO:0009236) |
| 0.0 | 0.6 | GO:0048384 | retinoic acid receptor signaling pathway(GO:0048384) |
| 0.0 | 0.1 | GO:1901409 | positive regulation of phosphorylation of RNA polymerase II C-terminal domain(GO:1901409) |
| 0.0 | 0.2 | GO:0045974 | miRNA mediated inhibition of translation(GO:0035278) negative regulation of translation, ncRNA-mediated(GO:0040033) regulation of translation, ncRNA-mediated(GO:0045974) |
| 0.0 | 0.1 | GO:0031507 | heterochromatin assembly(GO:0031507) |
| 0.0 | 0.0 | GO:0060020 | Bergmann glial cell differentiation(GO:0060020) |
| 0.0 | 0.1 | GO:0010793 | regulation of mRNA export from nucleus(GO:0010793) |
| 0.0 | 0.1 | GO:0099525 | presynaptic dense core granule exocytosis(GO:0099525) |
| 0.0 | 0.1 | GO:0043129 | surfactant homeostasis(GO:0043129) |
| 0.0 | 0.1 | GO:0061050 | regulation of cell growth involved in cardiac muscle cell development(GO:0061050) |
| 0.0 | 0.0 | GO:0030035 | microspike assembly(GO:0030035) |
| 0.0 | 0.2 | GO:0033539 | fatty acid beta-oxidation using acyl-CoA dehydrogenase(GO:0033539) |
| 0.0 | 0.2 | GO:2000324 | positive regulation of glucocorticoid receptor signaling pathway(GO:2000324) |
| 0.0 | 0.1 | GO:0090394 | negative regulation of excitatory postsynaptic potential(GO:0090394) |
| 0.0 | 0.2 | GO:0006020 | inositol metabolic process(GO:0006020) |
| 0.0 | 0.1 | GO:0030509 | BMP signaling pathway(GO:0030509) |
| 0.0 | 0.1 | GO:1902177 | positive regulation of oxidative stress-induced intrinsic apoptotic signaling pathway(GO:1902177) |
| 0.0 | 0.2 | GO:0016246 | RNA interference(GO:0016246) |
| 0.0 | 0.0 | GO:0019516 | lactate oxidation(GO:0019516) |
| 0.0 | 0.1 | GO:0006880 | intracellular sequestering of iron ion(GO:0006880) sequestering of iron ion(GO:0097577) |
| 0.0 | 0.0 | GO:0040040 | thermosensory behavior(GO:0040040) |
| 0.0 | 0.1 | GO:0006436 | tryptophanyl-tRNA aminoacylation(GO:0006436) |
| 0.0 | 0.1 | GO:0061469 | regulation of type B pancreatic cell proliferation(GO:0061469) |
| 0.0 | 0.6 | GO:0006509 | membrane protein ectodomain proteolysis(GO:0006509) |
| 0.0 | 0.1 | GO:0098902 | regulation of membrane depolarization during action potential(GO:0098902) regulation of membrane depolarization during cardiac muscle cell action potential(GO:1900825) |
| 0.0 | 0.0 | GO:0044205 | 'de novo' UMP biosynthetic process(GO:0044205) |
| 0.0 | 0.1 | GO:0038166 | angiotensin-activated signaling pathway(GO:0038166) |
| 0.0 | 0.0 | GO:1900747 | negative regulation of vascular endothelial growth factor signaling pathway(GO:1900747) |
| 0.0 | 0.1 | GO:0033274 | response to vitamin B2(GO:0033274) heterochromatin maintenance(GO:0070829) |
| 0.0 | 0.1 | GO:0097369 | sodium ion import(GO:0097369) |
| 0.0 | 0.1 | GO:0007023 | post-chaperonin tubulin folding pathway(GO:0007023) |
| 0.0 | 0.0 | GO:1990523 | bone regeneration(GO:1990523) |
| 0.0 | 0.2 | GO:0042501 | serine phosphorylation of STAT protein(GO:0042501) |
| 0.0 | 0.1 | GO:0035469 | determination of pancreatic left/right asymmetry(GO:0035469) determination of liver left/right asymmetry(GO:0071910) |
| 0.0 | 0.1 | GO:0060689 | cell differentiation involved in salivary gland development(GO:0060689) |
| 0.0 | 0.0 | GO:0072321 | chaperone-mediated protein transport(GO:0072321) |
Gene overrepresentation in cellular_component category:
| Log-likelihood per target | Total log-likelihood | Term | Description |
|---|---|---|---|
| 0.2 | 6.2 | GO:0048188 | Set1C/COMPASS complex(GO:0048188) |
| 0.2 | 0.9 | GO:0071001 | U4/U6 snRNP(GO:0071001) |
| 0.1 | 0.7 | GO:0009328 | phenylalanine-tRNA ligase complex(GO:0009328) |
| 0.1 | 1.5 | GO:0000836 | Hrd1p ubiquitin ligase complex(GO:0000836) |
| 0.1 | 0.5 | GO:0070931 | Golgi-associated vesicle lumen(GO:0070931) |
| 0.1 | 0.4 | GO:0005588 | collagen type V trimer(GO:0005588) |
| 0.1 | 0.3 | GO:0039713 | viral factory(GO:0039713) cytoplasmic viral factory(GO:0039714) host cell viral assembly compartment(GO:0072517) |
| 0.1 | 0.7 | GO:0071256 | Sec61 translocon complex(GO:0005784) translocon complex(GO:0071256) |
| 0.1 | 0.3 | GO:1990723 | cytoplasmic periphery of the nuclear pore complex(GO:1990723) |
| 0.1 | 1.6 | GO:0033180 | proton-transporting V-type ATPase, V1 domain(GO:0033180) |
| 0.1 | 0.9 | GO:0000220 | vacuolar proton-transporting V-type ATPase, V0 domain(GO:0000220) |
| 0.1 | 1.7 | GO:0019774 | proteasome core complex, beta-subunit complex(GO:0019774) |
| 0.1 | 0.6 | GO:0032021 | NELF complex(GO:0032021) |
| 0.1 | 0.4 | GO:1990745 | EARP complex(GO:1990745) |
| 0.1 | 0.5 | GO:0032044 | DSIF complex(GO:0032044) |
| 0.1 | 0.5 | GO:1990037 | Lewy body core(GO:1990037) |
| 0.1 | 1.6 | GO:0042555 | MCM complex(GO:0042555) |
| 0.1 | 0.2 | GO:0034657 | GID complex(GO:0034657) |
| 0.1 | 0.8 | GO:0008541 | proteasome regulatory particle, lid subcomplex(GO:0008541) |
| 0.1 | 1.0 | GO:0042788 | polysomal ribosome(GO:0042788) |
| 0.1 | 0.8 | GO:0005688 | U6 snRNP(GO:0005688) |
| 0.1 | 0.7 | GO:0005638 | lamin filament(GO:0005638) |
| 0.1 | 0.8 | GO:0071541 | eukaryotic translation initiation factor 3 complex, eIF3m(GO:0071541) |
| 0.1 | 0.5 | GO:0097165 | nuclear stress granule(GO:0097165) |
| 0.1 | 0.1 | GO:0019034 | viral replication complex(GO:0019034) |
| 0.1 | 0.5 | GO:0033063 | Rad51B-Rad51C-Rad51D-XRCC2 complex(GO:0033063) |
| 0.1 | 0.3 | GO:0044611 | nuclear pore inner ring(GO:0044611) |
| 0.1 | 0.3 | GO:0070044 | synaptobrevin 2-SNAP-25-syntaxin-1a complex(GO:0070044) |
| 0.1 | 1.3 | GO:0035145 | exon-exon junction complex(GO:0035145) |
| 0.1 | 0.3 | GO:0000333 | telomerase catalytic core complex(GO:0000333) |
| 0.1 | 0.3 | GO:0034457 | Mpp10 complex(GO:0034457) |
| 0.1 | 0.2 | GO:0070938 | contractile ring(GO:0070938) |
| 0.1 | 0.2 | GO:1990622 | CHOP-ATF3 complex(GO:1990622) |
| 0.1 | 0.4 | GO:0070545 | PeBoW complex(GO:0070545) |
| 0.1 | 0.3 | GO:1903349 | omegasome membrane(GO:1903349) |
| 0.1 | 0.5 | GO:0061574 | ASAP complex(GO:0061574) |
| 0.1 | 0.6 | GO:0031595 | nuclear proteasome complex(GO:0031595) |
| 0.0 | 0.2 | GO:1990923 | PET complex(GO:1990923) |
| 0.0 | 0.1 | GO:0005745 | m-AAA complex(GO:0005745) |
| 0.0 | 0.4 | GO:0034751 | aryl hydrocarbon receptor complex(GO:0034751) |
| 0.0 | 1.0 | GO:0000812 | Swr1 complex(GO:0000812) |
| 0.0 | 0.1 | GO:0000806 | Y chromosome(GO:0000806) |
| 0.0 | 0.3 | GO:0045323 | interleukin-1 receptor complex(GO:0045323) |
| 0.0 | 0.2 | GO:0000126 | transcription factor TFIIIB complex(GO:0000126) |
| 0.0 | 0.1 | GO:0090571 | RNA polymerase II transcription repressor complex(GO:0090571) |
| 0.0 | 0.3 | GO:0031262 | Ndc80 complex(GO:0031262) |
| 0.0 | 1.6 | GO:0005682 | U5 snRNP(GO:0005682) |
| 0.0 | 0.5 | GO:0000788 | nuclear nucleosome(GO:0000788) |
| 0.0 | 0.3 | GO:0071010 | prespliceosome(GO:0071010) |
| 0.0 | 0.8 | GO:0032059 | bleb(GO:0032059) |
| 0.0 | 0.2 | GO:0070436 | Grb2-EGFR complex(GO:0070436) |
| 0.0 | 0.4 | GO:0042382 | paraspeckles(GO:0042382) |
| 0.0 | 0.1 | GO:0045160 | myosin I complex(GO:0045160) |
| 0.0 | 0.7 | GO:0000177 | cytoplasmic exosome (RNase complex)(GO:0000177) |
| 0.0 | 0.5 | GO:0070776 | H3 histone acetyltransferase complex(GO:0070775) MOZ/MORF histone acetyltransferase complex(GO:0070776) |
| 0.0 | 0.5 | GO:0005677 | chromatin silencing complex(GO:0005677) |
| 0.0 | 0.3 | GO:0044294 | dendritic growth cone(GO:0044294) |
| 0.0 | 0.5 | GO:0005751 | mitochondrial respiratory chain complex IV(GO:0005751) |
| 0.0 | 1.3 | GO:0044665 | MLL1/2 complex(GO:0044665) MLL1 complex(GO:0071339) |
| 0.0 | 0.2 | GO:0008275 | gamma-tubulin small complex(GO:0008275) |
| 0.0 | 0.1 | GO:0044301 | climbing fiber(GO:0044301) |
| 0.0 | 0.3 | GO:0000120 | RNA polymerase I transcription factor complex(GO:0000120) |
| 0.0 | 0.2 | GO:0036398 | TCR signalosome(GO:0036398) |
| 0.0 | 0.3 | GO:0033503 | HULC complex(GO:0033503) |
| 0.0 | 0.8 | GO:0031011 | Ino80 complex(GO:0031011) DNA helicase complex(GO:0033202) |
| 0.0 | 0.1 | GO:0016272 | prefoldin complex(GO:0016272) |
| 0.0 | 0.4 | GO:0030897 | HOPS complex(GO:0030897) |
| 0.0 | 0.2 | GO:0031074 | nucleocytoplasmic shuttling complex(GO:0031074) |
| 0.0 | 1.6 | GO:0016592 | mediator complex(GO:0016592) |
| 0.0 | 0.2 | GO:1990730 | VCP-NSFL1C complex(GO:1990730) |
| 0.0 | 0.1 | GO:0016533 | cyclin-dependent protein kinase 5 holoenzyme complex(GO:0016533) |
| 0.0 | 0.2 | GO:0034388 | Pwp2p-containing subcomplex of 90S preribosome(GO:0034388) |
| 0.0 | 0.2 | GO:0000799 | nuclear condensin complex(GO:0000799) |
| 0.0 | 0.3 | GO:0055028 | cortical microtubule(GO:0055028) |
| 0.0 | 0.1 | GO:1903440 | calcitonin family receptor complex(GO:1903439) amylin receptor complex(GO:1903440) |
| 0.0 | 0.3 | GO:0000808 | origin recognition complex(GO:0000808) nuclear origin of replication recognition complex(GO:0005664) |
| 0.0 | 0.1 | GO:0000814 | ESCRT II complex(GO:0000814) |
| 0.0 | 0.4 | GO:0030123 | AP-3 adaptor complex(GO:0030123) |
| 0.0 | 0.1 | GO:0032279 | asymmetric synapse(GO:0032279) |
| 0.0 | 0.3 | GO:0016529 | sarcoplasmic reticulum(GO:0016529) |
| 0.0 | 0.1 | GO:0048476 | Holliday junction resolvase complex(GO:0048476) |
| 0.0 | 0.1 | GO:0005852 | eukaryotic translation initiation factor 3 complex(GO:0005852) |
| 0.0 | 0.2 | GO:0044194 | cytolytic granule(GO:0044194) |
| 0.0 | 0.0 | GO:0035101 | FACT complex(GO:0035101) |
| 0.0 | 0.1 | GO:0035061 | interchromatin granule(GO:0035061) |
| 0.0 | 0.6 | GO:0042599 | lamellar body(GO:0042599) |
| 0.0 | 0.3 | GO:0033269 | internode region of axon(GO:0033269) |
| 0.0 | 0.2 | GO:0016593 | Cdc73/Paf1 complex(GO:0016593) |
| 0.0 | 0.2 | GO:0000408 | EKC/KEOPS complex(GO:0000408) |
| 0.0 | 0.1 | GO:0055087 | Ski complex(GO:0055087) |
| 0.0 | 0.1 | GO:0071159 | NF-kappaB complex(GO:0071159) |
| 0.0 | 0.5 | GO:0005689 | U12-type spliceosomal complex(GO:0005689) |
| 0.0 | 0.5 | GO:0005915 | zonula adherens(GO:0005915) |
| 0.0 | 0.3 | GO:0097136 | Bcl-2 family protein complex(GO:0097136) |
| 0.0 | 0.4 | GO:0030126 | COPI vesicle coat(GO:0030126) |
| 0.0 | 0.3 | GO:0030478 | actin cap(GO:0030478) |
| 0.0 | 0.1 | GO:0008043 | intracellular ferritin complex(GO:0008043) ferritin complex(GO:0070288) |
| 0.0 | 0.5 | GO:0005685 | U1 snRNP(GO:0005685) |
| 0.0 | 0.3 | GO:0031931 | TORC1 complex(GO:0031931) |
| 0.0 | 1.2 | GO:0030173 | integral component of Golgi membrane(GO:0030173) |
| 0.0 | 0.1 | GO:0071942 | XPC complex(GO:0071942) |
| 0.0 | 0.2 | GO:1990316 | ATG1/ULK1 kinase complex(GO:1990316) |
| 0.0 | 0.1 | GO:1990635 | proximal dendrite(GO:1990635) |
| 0.0 | 0.4 | GO:0097539 | ciliary transition fiber(GO:0097539) |
| 0.0 | 0.5 | GO:0016514 | SWI/SNF complex(GO:0016514) |
| 0.0 | 0.1 | GO:0032584 | growth cone membrane(GO:0032584) |
| 0.0 | 0.5 | GO:0030687 | preribosome, large subunit precursor(GO:0030687) |
| 0.0 | 0.6 | GO:0005849 | mRNA cleavage factor complex(GO:0005849) |
| 0.0 | 0.3 | GO:0034045 | pre-autophagosomal structure membrane(GO:0034045) |
| 0.0 | 0.2 | GO:0005742 | mitochondrial outer membrane translocase complex(GO:0005742) |
| 0.0 | 0.1 | GO:0016938 | kinesin I complex(GO:0016938) |
| 0.0 | 0.3 | GO:0032433 | filopodium tip(GO:0032433) |
| 0.0 | 0.1 | GO:0032133 | chromosome passenger complex(GO:0032133) |
| 0.0 | 1.5 | GO:0019005 | SCF ubiquitin ligase complex(GO:0019005) |
| 0.0 | 0.5 | GO:0044295 | axonal growth cone(GO:0044295) |
| 0.0 | 0.1 | GO:0071458 | integral component of cytoplasmic side of endoplasmic reticulum membrane(GO:0071458) |
| 0.0 | 0.2 | GO:0005610 | laminin-5 complex(GO:0005610) |
| 0.0 | 0.1 | GO:1990851 | Wnt-Frizzled-LRP5/6 complex(GO:1990851) |
| 0.0 | 0.2 | GO:0005869 | dynactin complex(GO:0005869) |
| 0.0 | 0.2 | GO:0030137 | COPI-coated vesicle(GO:0030137) |
| 0.0 | 0.2 | GO:0035068 | micro-ribonucleoprotein complex(GO:0035068) |
| 0.0 | 0.4 | GO:0001533 | cornified envelope(GO:0001533) |
| 0.0 | 0.1 | GO:0070435 | Shc-EGFR complex(GO:0070435) |
| 0.0 | 0.1 | GO:0001741 | XY body(GO:0001741) |
| 0.0 | 1.0 | GO:0045171 | intercellular bridge(GO:0045171) |
| 0.0 | 0.1 | GO:0061700 | Seh1-associated complex(GO:0035859) GATOR2 complex(GO:0061700) |
| 0.0 | 0.2 | GO:0070652 | HAUS complex(GO:0070652) |
| 0.0 | 0.1 | GO:0097255 | R2TP complex(GO:0097255) |
| 0.0 | 0.1 | GO:0097179 | protease inhibitor complex(GO:0097179) |
| 0.0 | 0.2 | GO:0034451 | centriolar satellite(GO:0034451) |
| 0.0 | 0.1 | GO:0001739 | sex chromatin(GO:0001739) |
| 0.0 | 0.2 | GO:0019907 | cyclin-dependent protein kinase activating kinase holoenzyme complex(GO:0019907) |
| 0.0 | 0.2 | GO:0005666 | DNA-directed RNA polymerase III complex(GO:0005666) |
| 0.0 | 0.1 | GO:0070765 | gamma-secretase complex(GO:0070765) |
| 0.0 | 0.6 | GO:0034364 | high-density lipoprotein particle(GO:0034364) |
| 0.0 | 0.0 | GO:0002945 | cyclin K-CDK12 complex(GO:0002944) cyclin K-CDK13 complex(GO:0002945) |
| 0.0 | 1.1 | GO:0033116 | endoplasmic reticulum-Golgi intermediate compartment membrane(GO:0033116) |
| 0.0 | 0.1 | GO:0035370 | UBC13-UEV1A complex(GO:0035370) |
| 0.0 | 0.1 | GO:0035985 | senescence-associated heterochromatin focus(GO:0035985) |
| 0.0 | 0.2 | GO:0030870 | Mre11 complex(GO:0030870) |
| 0.0 | 0.2 | GO:0097197 | tetraspanin-enriched microdomain(GO:0097197) |
| 0.0 | 0.2 | GO:0030015 | CCR4-NOT core complex(GO:0030015) |
| 0.0 | 0.3 | GO:0008021 | synaptic vesicle(GO:0008021) |
| 0.0 | 0.1 | GO:0016013 | syntrophin complex(GO:0016013) |
| 0.0 | 0.3 | GO:0098563 | integral component of synaptic vesicle membrane(GO:0030285) intrinsic component of synaptic vesicle membrane(GO:0098563) |
| 0.0 | 0.3 | GO:0005639 | integral component of nuclear inner membrane(GO:0005639) intrinsic component of nuclear inner membrane(GO:0031229) |
| 0.0 | 2.3 | GO:0031227 | intrinsic component of endoplasmic reticulum membrane(GO:0031227) |
| 0.0 | 0.4 | GO:0031143 | pseudopodium(GO:0031143) |
| 0.0 | 0.2 | GO:0036038 | MKS complex(GO:0036038) |
| 0.0 | 0.1 | GO:1990130 | Iml1 complex(GO:1990130) |
| 0.0 | 0.2 | GO:0090543 | Flemming body(GO:0090543) |
| 0.0 | 0.5 | GO:0000786 | nucleosome(GO:0000786) |
| 0.0 | 0.1 | GO:0071818 | BAT3 complex(GO:0071818) ER membrane insertion complex(GO:0072379) |
| 0.0 | 0.1 | GO:0005833 | hemoglobin complex(GO:0005833) |
| 0.0 | 0.1 | GO:0042721 | mitochondrial inner membrane protein insertion complex(GO:0042721) |
| 0.0 | 0.8 | GO:0045271 | mitochondrial respiratory chain complex I(GO:0005747) NADH dehydrogenase complex(GO:0030964) respiratory chain complex I(GO:0045271) |
Gene overrepresentation in molecular_function category:
| Log-likelihood per target | Total log-likelihood | Term | Description |
|---|---|---|---|
| 0.5 | 1.9 | GO:0045322 | unmethylated CpG binding(GO:0045322) |
| 0.3 | 1.1 | GO:0004449 | isocitrate dehydrogenase (NAD+) activity(GO:0004449) |
| 0.2 | 0.7 | GO:0004886 | 9-cis retinoic acid receptor activity(GO:0004886) |
| 0.2 | 3.6 | GO:0043995 | histone acetyltransferase activity (H4-K5 specific)(GO:0043995) histone acetyltransferase activity (H4-K8 specific)(GO:0043996) histone acetyltransferase activity (H4-K16 specific)(GO:0046972) |
| 0.2 | 0.6 | GO:0004821 | histidine-tRNA ligase activity(GO:0004821) |
| 0.2 | 0.6 | GO:0031862 | prostanoid receptor binding(GO:0031862) |
| 0.2 | 0.5 | GO:0004813 | alanine-tRNA ligase activity(GO:0004813) |
| 0.2 | 1.6 | GO:0030621 | U4 snRNA binding(GO:0030621) |
| 0.2 | 0.8 | GO:0015140 | malate transmembrane transporter activity(GO:0015140) |
| 0.2 | 0.5 | GO:0004819 | glutamine-tRNA ligase activity(GO:0004819) |
| 0.2 | 0.5 | GO:0042132 | fructose 1,6-bisphosphate 1-phosphatase activity(GO:0042132) |
| 0.1 | 0.4 | GO:0061629 | RNA polymerase II sequence-specific DNA binding transcription factor binding(GO:0061629) |
| 0.1 | 0.4 | GO:0004828 | serine-tRNA ligase activity(GO:0004828) |
| 0.1 | 0.6 | GO:0004782 | sulfinoalanine decarboxylase activity(GO:0004782) |
| 0.1 | 0.4 | GO:0016422 | mRNA (2'-O-methyladenosine-N6-)-methyltransferase activity(GO:0016422) |
| 0.1 | 0.5 | GO:0004140 | dephospho-CoA kinase activity(GO:0004140) |
| 0.1 | 0.3 | GO:0034038 | deoxyhypusine synthase activity(GO:0034038) |
| 0.1 | 0.5 | GO:0008798 | beta-aspartyl-peptidase activity(GO:0008798) |
| 0.1 | 2.3 | GO:0003688 | DNA replication origin binding(GO:0003688) |
| 0.1 | 0.8 | GO:0008523 | sodium-dependent multivitamin transmembrane transporter activity(GO:0008523) |
| 0.1 | 0.6 | GO:0046624 | sphingolipid transporter activity(GO:0046624) |
| 0.1 | 0.7 | GO:0004826 | phenylalanine-tRNA ligase activity(GO:0004826) |
| 0.1 | 0.4 | GO:0016435 | rRNA (guanine) methyltransferase activity(GO:0016435) |
| 0.1 | 0.3 | GO:0042134 | rRNA primary transcript binding(GO:0042134) |
| 0.1 | 0.8 | GO:0032810 | sterol response element binding(GO:0032810) |
| 0.1 | 0.3 | GO:0097158 | pre-mRNA intronic pyrimidine-rich binding(GO:0097158) |
| 0.1 | 0.3 | GO:0035575 | histone demethylase activity (H4-K20 specific)(GO:0035575) |
| 0.1 | 0.3 | GO:0098808 | mRNA cap binding(GO:0098808) |
| 0.1 | 0.3 | GO:0003968 | RNA-directed RNA polymerase activity(GO:0003968) |
| 0.1 | 0.3 | GO:0004853 | uroporphyrinogen decarboxylase activity(GO:0004853) |
| 0.1 | 0.6 | GO:0004609 | phosphatidylserine decarboxylase activity(GO:0004609) |
| 0.1 | 0.2 | GO:0031752 | D5 dopamine receptor binding(GO:0031752) |
| 0.1 | 0.5 | GO:0004809 | tRNA (guanine-N2-)-methyltransferase activity(GO:0004809) |
| 0.1 | 0.9 | GO:0090599 | alpha-glucosidase activity(GO:0090599) |
| 0.1 | 0.5 | GO:0070815 | peptidyl-lysine 5-dioxygenase activity(GO:0070815) |
| 0.1 | 0.6 | GO:0009378 | four-way junction helicase activity(GO:0009378) |
| 0.1 | 0.2 | GO:0004852 | uroporphyrinogen-III synthase activity(GO:0004852) |
| 0.1 | 0.2 | GO:0015275 | stretch-activated, cation-selective, calcium channel activity(GO:0015275) |
| 0.1 | 0.4 | GO:0016971 | flavin-linked sulfhydryl oxidase activity(GO:0016971) |
| 0.1 | 0.3 | GO:0032050 | clathrin heavy chain binding(GO:0032050) |
| 0.1 | 0.3 | GO:0034739 | histone deacetylase activity (H4-K16 specific)(GO:0034739) |
| 0.1 | 0.3 | GO:0031694 | alpha-2A adrenergic receptor binding(GO:0031694) |
| 0.1 | 0.8 | GO:0005384 | manganese ion transmembrane transporter activity(GO:0005384) |
| 0.1 | 0.9 | GO:0008097 | 5S rRNA binding(GO:0008097) |
| 0.1 | 0.4 | GO:0047498 | calcium-dependent phospholipase A2 activity(GO:0047498) |
| 0.1 | 0.2 | GO:0008427 | calcium-dependent protein kinase inhibitor activity(GO:0008427) |
| 0.1 | 2.1 | GO:0046961 | proton-transporting ATPase activity, rotational mechanism(GO:0046961) |
| 0.1 | 0.5 | GO:0070740 | tubulin-glutamic acid ligase activity(GO:0070740) |
| 0.1 | 0.2 | GO:0050816 | phosphothreonine binding(GO:0050816) |
| 0.1 | 0.2 | GO:0032406 | MutLbeta complex binding(GO:0032406) MutSbeta complex binding(GO:0032408) |
| 0.1 | 0.2 | GO:0034041 | sterol-transporting ATPase activity(GO:0034041) |
| 0.1 | 0.2 | GO:0020037 | heme binding(GO:0020037) |
| 0.1 | 0.6 | GO:0003917 | DNA topoisomerase type I activity(GO:0003917) |
| 0.1 | 0.2 | GO:0052857 | NADHX epimerase activity(GO:0052856) NADPHX epimerase activity(GO:0052857) |
| 0.1 | 0.2 | GO:0004766 | spermidine synthase activity(GO:0004766) |
| 0.1 | 0.1 | GO:0034040 | lipid-transporting ATPase activity(GO:0034040) |
| 0.1 | 0.3 | GO:0031871 | proteinase activated receptor binding(GO:0031871) |
| 0.1 | 0.2 | GO:1904599 | advanced glycation end-product binding(GO:1904599) |
| 0.1 | 0.3 | GO:0008267 | poly-glutamine tract binding(GO:0008267) |
| 0.1 | 0.4 | GO:0035614 | snRNA stem-loop binding(GO:0035614) |
| 0.1 | 0.3 | GO:0016907 | G-protein coupled acetylcholine receptor activity(GO:0016907) |
| 0.1 | 0.3 | GO:0052839 | inositol 5-diphosphate pentakisphosphate 5-kinase activity(GO:0052836) inositol diphosphate tetrakisphosphate kinase activity(GO:0052839) |
| 0.1 | 0.2 | GO:0016309 | 1-phosphatidylinositol-5-phosphate 4-kinase activity(GO:0016309) |
| 0.1 | 0.4 | GO:0001165 | RNA polymerase I upstream control element sequence-specific DNA binding(GO:0001165) |
| 0.1 | 0.2 | GO:0004416 | hydroxyacylglutathione hydrolase activity(GO:0004416) |
| 0.0 | 0.1 | GO:0070984 | SET domain binding(GO:0070984) |
| 0.0 | 0.5 | GO:0036402 | proteasome-activating ATPase activity(GO:0036402) |
| 0.0 | 0.2 | GO:0008184 | glycogen phosphorylase activity(GO:0008184) |
| 0.0 | 0.9 | GO:0070513 | death domain binding(GO:0070513) |
| 0.0 | 0.6 | GO:0004861 | cyclin-dependent protein serine/threonine kinase inhibitor activity(GO:0004861) |
| 0.0 | 0.2 | GO:0052798 | beta-galactoside alpha-2,3-sialyltransferase activity(GO:0052798) |
| 0.0 | 0.1 | GO:0003863 | alpha-ketoacid dehydrogenase activity(GO:0003826) 3-methyl-2-oxobutanoate dehydrogenase (2-methylpropanoyl-transferring) activity(GO:0003863) |
| 0.0 | 0.2 | GO:0045131 | pre-mRNA branch point binding(GO:0045131) |
| 0.0 | 0.1 | GO:0061711 | N(6)-L-threonylcarbamoyladenine synthase(GO:0061711) |
| 0.0 | 0.1 | GO:0016401 | palmitoyl-CoA oxidase activity(GO:0016401) |
| 0.0 | 0.3 | GO:0003945 | N-acetyllactosamine synthase activity(GO:0003945) |
| 0.0 | 1.3 | GO:0005351 | sugar:proton symporter activity(GO:0005351) cation:sugar symporter activity(GO:0005402) |
| 0.0 | 0.2 | GO:0001026 | TFIIIB-type transcription factor activity(GO:0001026) |
| 0.0 | 0.2 | GO:0008479 | queuine tRNA-ribosyltransferase activity(GO:0008479) |
| 0.0 | 0.1 | GO:0090541 | MIT domain binding(GO:0090541) |
| 0.0 | 0.2 | GO:0050659 | chondroitin 4-sulfotransferase activity(GO:0047756) N-acetylgalactosamine 4-sulfate 6-O-sulfotransferase activity(GO:0050659) |
| 0.0 | 1.8 | GO:0008187 | poly-pyrimidine tract binding(GO:0008187) |
| 0.0 | 0.7 | GO:0004887 | thyroid hormone receptor activity(GO:0004887) |
| 0.0 | 1.3 | GO:0004298 | threonine-type endopeptidase activity(GO:0004298) threonine-type peptidase activity(GO:0070003) |
| 0.0 | 0.2 | GO:0009041 | uridylate kinase activity(GO:0009041) |
| 0.0 | 0.0 | GO:0030272 | 5-formyltetrahydrofolate cyclo-ligase activity(GO:0030272) |
| 0.0 | 0.7 | GO:0016783 | sulfurtransferase activity(GO:0016783) |
| 0.0 | 0.2 | GO:0051185 | coenzyme transporter activity(GO:0051185) |
| 0.0 | 0.2 | GO:0008453 | alanine-glyoxylate transaminase activity(GO:0008453) |
| 0.0 | 0.7 | GO:0047499 | calcium-independent phospholipase A2 activity(GO:0047499) |
| 0.0 | 0.1 | GO:0016534 | cyclin-dependent protein kinase 5 activator activity(GO:0016534) |
| 0.0 | 0.2 | GO:0010736 | serum response element binding(GO:0010736) |
| 0.0 | 0.1 | GO:0072345 | NAADP-sensitive calcium-release channel activity(GO:0072345) |
| 0.0 | 0.5 | GO:0070181 | small ribosomal subunit rRNA binding(GO:0070181) |
| 0.0 | 0.2 | GO:0003943 | N-acetylgalactosamine-4-sulfatase activity(GO:0003943) |
| 0.0 | 0.1 | GO:0032093 | SAM domain binding(GO:0032093) |
| 0.0 | 0.1 | GO:0045155 | electron transporter, transferring electrons from CoQH2-cytochrome c reductase complex and cytochrome c oxidase complex activity(GO:0045155) |
| 0.0 | 0.4 | GO:0051575 | 5'-deoxyribose-5-phosphate lyase activity(GO:0051575) |
| 0.0 | 0.1 | GO:0036435 | K48-linked polyubiquitin binding(GO:0036435) |
| 0.0 | 0.5 | GO:0004767 | sphingomyelin phosphodiesterase activity(GO:0004767) |
| 0.0 | 0.1 | GO:0016532 | superoxide dismutase copper chaperone activity(GO:0016532) |
| 0.0 | 0.7 | GO:0042809 | vitamin D receptor binding(GO:0042809) |
| 0.0 | 0.5 | GO:0005078 | MAP-kinase scaffold activity(GO:0005078) |
| 0.0 | 0.4 | GO:0001042 | RNA polymerase I core binding(GO:0001042) |
| 0.0 | 0.3 | GO:0004704 | NF-kappaB-inducing kinase activity(GO:0004704) |
| 0.0 | 0.6 | GO:0017162 | aryl hydrocarbon receptor binding(GO:0017162) |
| 0.0 | 0.1 | GO:0004706 | JUN kinase kinase kinase activity(GO:0004706) |
| 0.0 | 0.5 | GO:0005381 | iron ion transmembrane transporter activity(GO:0005381) |
| 0.0 | 0.4 | GO:0001162 | RNA polymerase II intronic transcription regulatory region sequence-specific DNA binding(GO:0001162) |
| 0.0 | 0.2 | GO:0004045 | aminoacyl-tRNA hydrolase activity(GO:0004045) |
| 0.0 | 0.2 | GO:0071208 | histone pre-mRNA DCP binding(GO:0071208) |
| 0.0 | 0.3 | GO:0004839 | ubiquitin activating enzyme activity(GO:0004839) |
| 0.0 | 0.3 | GO:0019826 | oxygen sensor activity(GO:0019826) |
| 0.0 | 0.1 | GO:0004584 | dolichyl-phosphate-mannose-glycolipid alpha-mannosyltransferase activity(GO:0004584) |
| 0.0 | 0.2 | GO:0004814 | arginine-tRNA ligase activity(GO:0004814) |
| 0.0 | 0.4 | GO:0032453 | histone demethylase activity (H3-K4 specific)(GO:0032453) |
| 0.0 | 0.1 | GO:0004165 | dodecenoyl-CoA delta-isomerase activity(GO:0004165) |
| 0.0 | 0.2 | GO:0060072 | large conductance calcium-activated potassium channel activity(GO:0060072) |
| 0.0 | 0.1 | GO:0035613 | RNA stem-loop binding(GO:0035613) |
| 0.0 | 0.7 | GO:0043522 | leucine zipper domain binding(GO:0043522) |
| 0.0 | 0.1 | GO:0004419 | hydroxymethylglutaryl-CoA lyase activity(GO:0004419) |
| 0.0 | 0.1 | GO:0097643 | amylin receptor activity(GO:0097643) |
| 0.0 | 0.1 | GO:0004796 | thromboxane-A synthase activity(GO:0004796) 12-hydroxyheptadecatrienoic acid synthase activity(GO:0036134) |
| 0.0 | 0.3 | GO:0004197 | cysteine-type endopeptidase activity(GO:0004197) |
| 0.0 | 0.1 | GO:0046538 | bisphosphoglycerate mutase activity(GO:0004082) phosphoglycerate mutase activity(GO:0004619) 2,3-bisphosphoglycerate-dependent phosphoglycerate mutase activity(GO:0046538) |
| 0.0 | 0.2 | GO:0035402 | histone kinase activity (H3-T11 specific)(GO:0035402) |
| 0.0 | 1.6 | GO:0031624 | ubiquitin conjugating enzyme binding(GO:0031624) |
| 0.0 | 0.1 | GO:0004145 | diamine N-acetyltransferase activity(GO:0004145) |
| 0.0 | 0.5 | GO:0016004 | phospholipase activator activity(GO:0016004) |
| 0.0 | 0.2 | GO:1990829 | C-rich single-stranded DNA binding(GO:1990829) |
| 0.0 | 0.5 | GO:0022841 | potassium ion leak channel activity(GO:0022841) |
| 0.0 | 1.1 | GO:0005385 | zinc ion transmembrane transporter activity(GO:0005385) |
| 0.0 | 0.3 | GO:0097027 | ubiquitin-protein transferase activator activity(GO:0097027) |
| 0.0 | 0.4 | GO:0004308 | exo-alpha-sialidase activity(GO:0004308) alpha-sialidase activity(GO:0016997) |
| 0.0 | 0.1 | GO:0008410 | 3-oxoacid CoA-transferase activity(GO:0008260) CoA-transferase activity(GO:0008410) |
| 0.0 | 0.1 | GO:0001632 | leukotriene B4 receptor activity(GO:0001632) leukotriene receptor activity(GO:0004974) |
| 0.0 | 1.4 | GO:0004984 | olfactory receptor activity(GO:0004984) |
| 0.0 | 0.3 | GO:0010385 | double-stranded methylated DNA binding(GO:0010385) |
| 0.0 | 0.1 | GO:0000253 | 3-keto sterol reductase activity(GO:0000253) |
| 0.0 | 0.1 | GO:0001161 | intronic transcription regulatory region sequence-specific DNA binding(GO:0001161) intronic transcription regulatory region DNA binding(GO:0044213) |
| 0.0 | 0.2 | GO:0005280 | hydrogen:amino acid symporter activity(GO:0005280) |
| 0.0 | 0.5 | GO:0003993 | acid phosphatase activity(GO:0003993) |
| 0.0 | 0.2 | GO:0003987 | acetate-CoA ligase activity(GO:0003987) |
| 0.0 | 0.2 | GO:0017150 | tRNA dihydrouridine synthase activity(GO:0017150) |
| 0.0 | 0.1 | GO:0003976 | UDP-N-acetylglucosamine-lysosomal-enzyme N-acetylglucosaminephosphotransferase activity(GO:0003976) |
| 0.0 | 0.2 | GO:0036132 | 13-prostaglandin reductase activity(GO:0036132) 15-oxoprostaglandin 13-oxidase activity(GO:0047522) |
| 0.0 | 0.2 | GO:0044020 | histone methyltransferase activity (H4-R3 specific)(GO:0044020) |
| 0.0 | 1.0 | GO:0004198 | calcium-dependent cysteine-type endopeptidase activity(GO:0004198) |
| 0.0 | 0.3 | GO:0017070 | U6 snRNA binding(GO:0017070) |
| 0.0 | 0.1 | GO:0016781 | selenide, water dikinase activity(GO:0004756) phosphotransferase activity, paired acceptors(GO:0016781) |
| 0.0 | 0.5 | GO:0051011 | microtubule minus-end binding(GO:0051011) |
| 0.0 | 0.5 | GO:0035497 | cAMP response element binding(GO:0035497) |
| 0.0 | 0.1 | GO:0034431 | endopolyphosphatase activity(GO:0000298) diphosphoinositol-polyphosphate diphosphatase activity(GO:0008486) bis(5'-adenosyl)-hexaphosphatase activity(GO:0034431) bis(5'-adenosyl)-pentaphosphatase activity(GO:0034432) inositol diphosphate tetrakisphosphate diphosphatase activity(GO:0052840) inositol bisdiphosphate tetrakisphosphate diphosphatase activity(GO:0052841) inositol diphosphate pentakisphosphate diphosphatase activity(GO:0052842) inositol-1-diphosphate-2,3,4,5,6-pentakisphosphate diphosphatase activity(GO:0052843) inositol-3-diphosphate-1,2,4,5,6-pentakisphosphate diphosphatase activity(GO:0052844) inositol-5-diphosphate-1,2,3,4,6-pentakisphosphate diphosphatase activity(GO:0052845) inositol-1,5-bisdiphosphate-2,3,4,6-tetrakisphosphate 1-diphosphatase activity(GO:0052846) inositol-1,5-bisdiphosphate-2,3,4,6-tetrakisphosphate 5-diphosphatase activity(GO:0052847) inositol-3,5-bisdiphosphate-2,3,4,6-tetrakisphosphate 5-diphosphatase activity(GO:0052848) |
| 0.0 | 1.5 | GO:0043425 | bHLH transcription factor binding(GO:0043425) |
| 0.0 | 0.3 | GO:0019911 | structural constituent of myelin sheath(GO:0019911) |
| 0.0 | 0.1 | GO:0072545 | tyrosine binding(GO:0072545) |
| 0.0 | 0.1 | GO:0005134 | interleukin-2 receptor binding(GO:0005134) |
| 0.0 | 0.1 | GO:0022897 | peptide:proton symporter activity(GO:0015333) proton-dependent peptide secondary active transmembrane transporter activity(GO:0022897) |
| 0.0 | 0.2 | GO:0009008 | DNA-methyltransferase activity(GO:0009008) |
| 0.0 | 0.4 | GO:0008499 | UDP-galactose:beta-N-acetylglucosamine beta-1,3-galactosyltransferase activity(GO:0008499) |
| 0.0 | 0.1 | GO:0098519 | nucleotide phosphatase activity, acting on free nucleotides(GO:0098519) |
| 0.0 | 0.1 | GO:0004977 | melanocortin receptor activity(GO:0004977) |
| 0.0 | 0.1 | GO:0035529 | NADH pyrophosphatase activity(GO:0035529) |
| 0.0 | 0.4 | GO:0005522 | profilin binding(GO:0005522) |
| 0.0 | 0.5 | GO:0001223 | transcription coactivator binding(GO:0001223) |
| 0.0 | 0.3 | GO:0015386 | potassium:proton antiporter activity(GO:0015386) |
| 0.0 | 0.2 | GO:0004849 | uridine kinase activity(GO:0004849) |
| 0.0 | 0.1 | GO:0017095 | heparan sulfate 6-O-sulfotransferase activity(GO:0017095) |
| 0.0 | 0.1 | GO:0003845 | 11-beta-hydroxysteroid dehydrogenase [NAD(P)] activity(GO:0003845) |
| 0.0 | 0.3 | GO:0019887 | protein kinase regulator activity(GO:0019887) |
| 0.0 | 0.0 | GO:0004823 | leucine-tRNA ligase activity(GO:0004823) |
| 0.0 | 0.1 | GO:0048273 | mitogen-activated protein kinase p38 binding(GO:0048273) |
| 0.0 | 0.1 | GO:0004616 | phosphogluconate dehydrogenase (decarboxylating) activity(GO:0004616) |
| 0.0 | 0.2 | GO:0048408 | epidermal growth factor binding(GO:0048408) |
| 0.0 | 0.2 | GO:0015266 | protein channel activity(GO:0015266) |
| 0.0 | 0.4 | GO:0005225 | volume-sensitive anion channel activity(GO:0005225) |
| 0.0 | 0.1 | GO:0050119 | N-acetylglucosamine deacetylase activity(GO:0050119) |
| 0.0 | 1.4 | GO:0005080 | protein kinase C binding(GO:0005080) |
| 0.0 | 0.1 | GO:0015234 | thiamine transmembrane transporter activity(GO:0015234) |
| 0.0 | 0.2 | GO:0001056 | RNA polymerase III activity(GO:0001056) |
| 0.0 | 0.3 | GO:0001758 | retinal dehydrogenase activity(GO:0001758) |
| 0.0 | 0.1 | GO:0016402 | pristanoyl-CoA oxidase activity(GO:0016402) |
| 0.0 | 0.2 | GO:0008420 | CTD phosphatase activity(GO:0008420) |
| 0.0 | 0.1 | GO:0003998 | acylphosphatase activity(GO:0003998) |
| 0.0 | 0.2 | GO:0002039 | p53 binding(GO:0002039) |
| 0.0 | 0.4 | GO:0016653 | oxidoreductase activity, acting on NAD(P)H, heme protein as acceptor(GO:0016653) |
| 0.0 | 0.1 | GO:0016706 | oxidoreductase activity, acting on paired donors, with incorporation or reduction of molecular oxygen, 2-oxoglutarate as one donor, and incorporation of one atom each of oxygen into both donors(GO:0016706) |
| 0.0 | 0.3 | GO:0005537 | mannose binding(GO:0005537) |
| 0.0 | 0.1 | GO:0001849 | complement component C1q binding(GO:0001849) |
| 0.0 | 0.0 | GO:0004817 | cysteine-tRNA ligase activity(GO:0004817) |
| 0.0 | 0.1 | GO:0047760 | butyrate-CoA ligase activity(GO:0047760) |
| 0.0 | 0.3 | GO:0033549 | MAP kinase phosphatase activity(GO:0033549) |
| 0.0 | 0.2 | GO:0004305 | ethanolamine kinase activity(GO:0004305) |
| 0.0 | 0.6 | GO:0070034 | telomerase RNA binding(GO:0070034) |
| 0.0 | 0.2 | GO:0008140 | cAMP response element binding protein binding(GO:0008140) |
| 0.0 | 0.1 | GO:0031685 | adenosine receptor binding(GO:0031685) |
| 0.0 | 0.3 | GO:0030247 | pattern binding(GO:0001871) polysaccharide binding(GO:0030247) |
| 0.0 | 0.1 | GO:0043891 | glyceraldehyde-3-phosphate dehydrogenase (NAD+) (phosphorylating) activity(GO:0004365) glyceraldehyde-3-phosphate dehydrogenase (NAD(P)+) (phosphorylating) activity(GO:0043891) |
| 0.0 | 0.1 | GO:0016822 | hydrolase activity, acting on acid carbon-carbon bonds(GO:0016822) hydrolase activity, acting on acid carbon-carbon bonds, in ketonic substances(GO:0016823) |
| 0.0 | 0.3 | GO:0050321 | tau-protein kinase activity(GO:0050321) |
| 0.0 | 0.1 | GO:0019144 | ADP-sugar diphosphatase activity(GO:0019144) adenosine-diphosphatase activity(GO:0043262) |
| 0.0 | 0.5 | GO:0042605 | peptide antigen binding(GO:0042605) |
| 0.0 | 0.5 | GO:0004707 | MAP kinase activity(GO:0004707) |
| 0.0 | 0.3 | GO:0008253 | 5'-nucleotidase activity(GO:0008253) |
| 0.0 | 0.2 | GO:0005168 | neurotrophin TRKA receptor binding(GO:0005168) |
| 0.0 | 0.1 | GO:0030942 | endoplasmic reticulum signal peptide binding(GO:0030942) |
| 0.0 | 0.1 | GO:0005497 | androgen binding(GO:0005497) |
| 0.0 | 0.1 | GO:0000033 | alpha-1,3-mannosyltransferase activity(GO:0000033) |
| 0.0 | 0.1 | GO:0019534 | toxin transporter activity(GO:0019534) |
| 0.0 | 0.0 | GO:0046870 | cadmium ion binding(GO:0046870) |
| 0.0 | 0.1 | GO:0008508 | bile acid:sodium symporter activity(GO:0008508) |
| 0.0 | 0.0 | GO:0005499 | vitamin D binding(GO:0005499) |
| 0.0 | 0.1 | GO:1990404 | protein ADP-ribosylase activity(GO:1990404) |
| 0.0 | 0.3 | GO:0015929 | hexosaminidase activity(GO:0015929) |
| 0.0 | 0.0 | GO:0004961 | thromboxane receptor activity(GO:0004960) thromboxane A2 receptor activity(GO:0004961) |
| 0.0 | 0.2 | GO:0034450 | ubiquitin-ubiquitin ligase activity(GO:0034450) |
| 0.0 | 0.1 | GO:0004711 | ribosomal protein S6 kinase activity(GO:0004711) |
| 0.0 | 0.2 | GO:0019784 | NEDD8-specific protease activity(GO:0019784) |
| 0.0 | 0.1 | GO:0000405 | bubble DNA binding(GO:0000405) |
| 0.0 | 0.1 | GO:0032183 | SUMO binding(GO:0032183) |
| 0.0 | 0.0 | GO:0008841 | tetrahydrofolylpolyglutamate synthase activity(GO:0004326) dihydrofolate synthase activity(GO:0008841) |
| 0.0 | 0.0 | GO:0070097 | delta-catenin binding(GO:0070097) |
| 0.0 | 0.1 | GO:0003696 | satellite DNA binding(GO:0003696) |
| 0.0 | 0.5 | GO:0070577 | lysine-acetylated histone binding(GO:0070577) |
| 0.0 | 0.0 | GO:0005344 | oxygen transporter activity(GO:0005344) |
| 0.0 | 0.2 | GO:0009881 | photoreceptor activity(GO:0009881) |
| 0.0 | 0.1 | GO:0046920 | alpha-(1->3)-fucosyltransferase activity(GO:0046920) |
| 0.0 | 0.0 | GO:0051525 | NFAT protein binding(GO:0051525) |
| 0.0 | 0.1 | GO:0008113 | peptide-methionine (S)-S-oxide reductase activity(GO:0008113) |
| 0.0 | 0.3 | GO:0042800 | histone methyltransferase activity (H3-K4 specific)(GO:0042800) |
| 0.0 | 0.4 | GO:0005086 | ARF guanyl-nucleotide exchange factor activity(GO:0005086) |
| 0.0 | 0.1 | GO:0004430 | 1-phosphatidylinositol 4-kinase activity(GO:0004430) |
| 0.0 | 0.4 | GO:0019706 | protein-cysteine S-palmitoyltransferase activity(GO:0019706) protein-cysteine S-acyltransferase activity(GO:0019707) |
| 0.0 | 0.1 | GO:0032454 | histone demethylase activity (H3-K9 specific)(GO:0032454) |
| 0.0 | 0.1 | GO:0031434 | mitogen-activated protein kinase kinase binding(GO:0031434) |
| 0.0 | 0.3 | GO:0030898 | actin-dependent ATPase activity(GO:0030898) |
| 0.0 | 0.2 | GO:0008327 | methyl-CpG binding(GO:0008327) |
| 0.0 | 0.1 | GO:0004668 | protein-arginine deiminase activity(GO:0004668) |
| 0.0 | 0.1 | GO:0050265 | RNA uridylyltransferase activity(GO:0050265) |
| 0.0 | 0.1 | GO:0042500 | aspartic endopeptidase activity, intramembrane cleaving(GO:0042500) |
| 0.0 | 0.1 | GO:0001163 | RNA polymerase I regulatory region DNA binding(GO:0001013) RNA polymerase I regulatory region sequence-specific DNA binding(GO:0001163) RNA polymerase I CORE element sequence-specific DNA binding(GO:0001164) |
| 0.0 | 0.1 | GO:0008821 | crossover junction endodeoxyribonuclease activity(GO:0008821) |
| 0.0 | 0.1 | GO:0016724 | ferroxidase activity(GO:0004322) oxidoreductase activity, oxidizing metal ions, oxygen as acceptor(GO:0016724) |
| 0.0 | 0.3 | GO:0042288 | MHC class I protein binding(GO:0042288) |
| 0.0 | 0.1 | GO:0070095 | fructose-6-phosphate binding(GO:0070095) |
| 0.0 | 0.1 | GO:0004830 | tryptophan-tRNA ligase activity(GO:0004830) |
| 0.0 | 0.3 | GO:1990381 | ubiquitin-specific protease binding(GO:1990381) |
| 0.0 | 0.4 | GO:0017147 | Wnt-protein binding(GO:0017147) |
| 0.0 | 0.1 | GO:0004971 | AMPA glutamate receptor activity(GO:0004971) |
| 0.0 | 0.2 | GO:0015095 | magnesium ion transmembrane transporter activity(GO:0015095) |
| 0.0 | 0.1 | GO:0005315 | inorganic phosphate transmembrane transporter activity(GO:0005315) |
| 0.0 | 0.3 | GO:0004129 | cytochrome-c oxidase activity(GO:0004129) heme-copper terminal oxidase activity(GO:0015002) oxidoreductase activity, acting on a heme group of donors(GO:0016675) oxidoreductase activity, acting on a heme group of donors, oxygen as acceptor(GO:0016676) |
| 0.0 | 0.1 | GO:0004489 | methylenetetrahydrofolate reductase (NAD(P)H) activity(GO:0004489) |
| 0.0 | 0.2 | GO:0005432 | calcium:sodium antiporter activity(GO:0005432) |
| 0.0 | 0.2 | GO:0015250 | water channel activity(GO:0015250) |
| 0.0 | 0.1 | GO:0004716 | receptor signaling protein tyrosine kinase activity(GO:0004716) |
| 0.0 | 0.1 | GO:0017077 | oxidative phosphorylation uncoupler activity(GO:0017077) |
| 0.0 | 0.1 | GO:0097157 | pre-mRNA intronic binding(GO:0097157) |
Gene overrepresentation in C2:CP category:
| Log-likelihood per target | Total log-likelihood | Term | Description |
|---|---|---|---|
| 0.1 | 0.3 | SA CASPASE CASCADE | Apoptosis is mediated by caspases, cysteine proteases arranged in a proteolytic cascade. |
| 0.0 | 1.5 | PID ARF 3PATHWAY | Arf1 pathway |
| 0.0 | 4.2 | PID P53 REGULATION PATHWAY | p53 pathway |
| 0.0 | 0.7 | PID CIRCADIAN PATHWAY | Circadian rhythm pathway |
| 0.0 | 1.7 | PID RXR VDR PATHWAY | RXR and RAR heterodimerization with other nuclear receptor |
| 0.0 | 0.2 | SIG PIP3 SIGNALING IN CARDIAC MYOCTES | Genes related to PIP3 signaling in cardiac myocytes |
| 0.0 | 0.4 | PID PI3KCI PATHWAY | Class I PI3K signaling events |
| 0.0 | 0.4 | PID DNA PK PATHWAY | DNA-PK pathway in nonhomologous end joining |
| 0.0 | 0.1 | ST WNT CA2 CYCLIC GMP PATHWAY | Wnt/Ca2+/cyclic GMP signaling. |
| 0.0 | 0.5 | PID P38 GAMMA DELTA PATHWAY | Signaling mediated by p38-gamma and p38-delta |
| 0.0 | 0.3 | PID IL5 PATHWAY | IL5-mediated signaling events |
| 0.0 | 0.6 | PID HNF3A PATHWAY | FOXA1 transcription factor network |
| 0.0 | 0.3 | ST GRANULE CELL SURVIVAL PATHWAY | Granule Cell Survival Pathway is a specific case of more general PAC1 Receptor Pathway. |
| 0.0 | 0.2 | PID AR NONGENOMIC PATHWAY | Nongenotropic Androgen signaling |
| 0.0 | 0.1 | PID WNT NONCANONICAL PATHWAY | Noncanonical Wnt signaling pathway |
| 0.0 | 0.9 | PID REELIN PATHWAY | Reelin signaling pathway |
| 0.0 | 0.3 | PID WNT CANONICAL PATHWAY | Canonical Wnt signaling pathway |
| 0.0 | 0.3 | ST MYOCYTE AD PATHWAY | Myocyte Adrenergic Pathway is a specific case of the generalized Adrenergic Pathway. |
| 0.0 | 0.5 | PID FANCONI PATHWAY | Fanconi anemia pathway |
| 0.0 | 1.1 | PID RB 1PATHWAY | Regulation of retinoblastoma protein |
| 0.0 | 0.3 | SA PROGRAMMED CELL DEATH | Programmed cell death, or apoptosis, eliminates damaged or unneeded cells. |
| 0.0 | 0.8 | PID ATR PATHWAY | ATR signaling pathway |
| 0.0 | 0.1 | SA REG CASCADE OF CYCLIN EXPR | Expression of cyclins regulates progression through the cell cycle by activating cyclin-dependent kinases. |
| 0.0 | 0.6 | PID IL2 PI3K PATHWAY | IL2 signaling events mediated by PI3K |
| 0.0 | 0.5 | PID HIF1A PATHWAY | Hypoxic and oxygen homeostasis regulation of HIF-1-alpha |
| 0.0 | 0.1 | ST JAK STAT PATHWAY | Jak-STAT Pathway |
| 0.0 | 0.7 | PID FRA PATHWAY | Validated transcriptional targets of AP1 family members Fra1 and Fra2 |
| 0.0 | 0.5 | PID ENDOTHELIN PATHWAY | Endothelins |
| 0.0 | 0.1 | PID VEGF VEGFR PATHWAY | VEGF and VEGFR signaling network |
| 0.0 | 0.3 | PID WNT SIGNALING PATHWAY | Wnt signaling network |
| 0.0 | 0.2 | PID TCR JNK PATHWAY | JNK signaling in the CD4+ TCR pathway |
| 0.0 | 0.2 | PID IL8 CXCR2 PATHWAY | IL8- and CXCR2-mediated signaling events |
| 0.0 | 0.4 | PID HDAC CLASSII PATHWAY | Signaling events mediated by HDAC Class II |
Gene overrepresentation in C2:CP:REACTOME category:
| Log-likelihood per target | Total log-likelihood | Term | Description |
|---|---|---|---|
| 0.2 | 1.0 | REACTOME PEPTIDE CHAIN ELONGATION | Genes involved in Peptide chain elongation |
| 0.1 | 0.6 | REACTOME ABORTIVE ELONGATION OF HIV1 TRANSCRIPT IN THE ABSENCE OF TAT | Genes involved in Abortive elongation of HIV-1 transcript in the absence of Tat |
| 0.1 | 1.6 | REACTOME UNWINDING OF DNA | Genes involved in Unwinding of DNA |
| 0.1 | 1.5 | REACTOME CALNEXIN CALRETICULIN CYCLE | Genes involved in Calnexin/calreticulin cycle |
| 0.1 | 0.9 | REACTOME COPI MEDIATED TRANSPORT | Genes involved in COPI Mediated Transport |
| 0.1 | 1.6 | REACTOME MITOCHONDRIAL TRNA AMINOACYLATION | Genes involved in Mitochondrial tRNA aminoacylation |
| 0.1 | 3.3 | REACTOME RNA POL I PROMOTER OPENING | Genes involved in RNA Polymerase I Promoter Opening |
| 0.0 | 0.5 | REACTOME ACTIVATION OF CHAPERONE GENES BY ATF6 ALPHA | Genes involved in Activation of Chaperone Genes by ATF6-alpha |
| 0.0 | 1.5 | REACTOME INSULIN RECEPTOR RECYCLING | Genes involved in Insulin receptor recycling |
| 0.0 | 0.2 | REACTOME N GLYCAN TRIMMING IN THE ER AND CALNEXIN CALRETICULIN CYCLE | Genes involved in N-glycan trimming in the ER and Calnexin/Calreticulin cycle |
| 0.0 | 0.7 | REACTOME ERKS ARE INACTIVATED | Genes involved in ERKs are inactivated |
| 0.0 | 3.8 | REACTOME ACTIVATION OF CHAPERONE GENES BY XBP1S | Genes involved in Activation of Chaperone Genes by XBP1(S) |
| 0.0 | 0.5 | REACTOME MRNA DECAY BY 3 TO 5 EXORIBONUCLEASE | Genes involved in mRNA Decay by 3' to 5' Exoribonuclease |
| 0.0 | 2.6 | REACTOME CROSS PRESENTATION OF SOLUBLE EXOGENOUS ANTIGENS ENDOSOMES | Genes involved in Cross-presentation of soluble exogenous antigens (endosomes) |
| 0.0 | 5.8 | REACTOME MRNA SPLICING | Genes involved in mRNA Splicing |
| 0.0 | 0.8 | REACTOME RNA POL III TRANSCRIPTION INITIATION FROM TYPE 2 PROMOTER | Genes involved in RNA Polymerase III Transcription Initiation From Type 2 Promoter |
| 0.0 | 0.3 | REACTOME FORMATION OF TRANSCRIPTION COUPLED NER TC NER REPAIR COMPLEX | Genes involved in Formation of transcription-coupled NER (TC-NER) repair complex |
| 0.0 | 2.1 | REACTOME MITOCHONDRIAL PROTEIN IMPORT | Genes involved in Mitochondrial Protein Import |
| 0.0 | 0.5 | REACTOME ELONGATION ARREST AND RECOVERY | Genes involved in Elongation arrest and recovery |
| 0.0 | 0.9 | REACTOME ZINC TRANSPORTERS | Genes involved in Zinc transporters |
| 0.0 | 0.3 | REACTOME RNA POL I TRANSCRIPTION TERMINATION | Genes involved in RNA Polymerase I Transcription Termination |
| 0.0 | 0.8 | REACTOME BIOSYNTHESIS OF THE N GLYCAN PRECURSOR DOLICHOL LIPID LINKED OLIGOSACCHARIDE LLO AND TRANSFER TO A NASCENT PROTEIN | Genes involved in Biosynthesis of the N-glycan precursor (dolichol lipid-linked oligosaccharide, LLO) and transfer to a nascent protein |
| 0.0 | 0.5 | REACTOME VITAMIN B5 PANTOTHENATE METABOLISM | Genes involved in Vitamin B5 (pantothenate) metabolism |
| 0.0 | 1.3 | REACTOME OLFACTORY SIGNALING PATHWAY | Genes involved in Olfactory Signaling Pathway |
| 0.0 | 0.1 | REACTOME PROCESSING OF CAPPED INTRON CONTAINING PRE MRNA | Genes involved in Processing of Capped Intron-Containing Pre-mRNA |
| 0.0 | 1.3 | REACTOME BASIGIN INTERACTIONS | Genes involved in Basigin interactions |
| 0.0 | 0.8 | REACTOME TRAFFICKING OF GLUR2 CONTAINING AMPA RECEPTORS | Genes involved in Trafficking of GluR2-containing AMPA receptors |
| 0.0 | 0.2 | REACTOME E2F ENABLED INHIBITION OF PRE REPLICATION COMPLEX FORMATION | Genes involved in E2F-enabled inhibition of pre-replication complex formation |
| 0.0 | 0.5 | REACTOME RECRUITMENT OF NUMA TO MITOTIC CENTROSOMES | Genes involved in Recruitment of NuMA to mitotic centrosomes |
| 0.0 | 1.4 | REACTOME GLUCONEOGENESIS | Genes involved in Gluconeogenesis |
| 0.0 | 0.1 | REACTOME ER PHAGOSOME PATHWAY | Genes involved in ER-Phagosome pathway |
| 0.0 | 0.3 | REACTOME MITOCHONDRIAL FATTY ACID BETA OXIDATION | Genes involved in Mitochondrial Fatty Acid Beta-Oxidation |
| 0.0 | 0.3 | REACTOME GAMMA CARBOXYLATION TRANSPORT AND AMINO TERMINAL CLEAVAGE OF PROTEINS | Genes involved in Gamma-carboxylation, transport, and amino-terminal cleavage of proteins |
| 0.0 | 0.2 | REACTOME TRAF6 MEDIATED IRF7 ACTIVATION IN TLR7 8 OR 9 SIGNALING | Genes involved in TRAF6 mediated IRF7 activation in TLR7/8 or 9 signaling |
| 0.0 | 1.7 | REACTOME NUCLEAR RECEPTOR TRANSCRIPTION PATHWAY | Genes involved in Nuclear Receptor transcription pathway |
| 0.0 | 0.3 | REACTOME GAP JUNCTION DEGRADATION | Genes involved in Gap junction degradation |
| 0.0 | 0.2 | REACTOME SIGNAL ATTENUATION | Genes involved in Signal attenuation |
| 0.0 | 0.5 | REACTOME METABOLISM OF PORPHYRINS | Genes involved in Metabolism of porphyrins |
| 0.0 | 0.6 | REACTOME KERATAN SULFATE BIOSYNTHESIS | Genes involved in Keratan sulfate biosynthesis |
| 0.0 | 0.2 | REACTOME ADENYLATE CYCLASE ACTIVATING PATHWAY | Genes involved in Adenylate cyclase activating pathway |
| 0.0 | 0.2 | REACTOME ACETYLCHOLINE NEUROTRANSMITTER RELEASE CYCLE | Genes involved in Acetylcholine Neurotransmitter Release Cycle |
| 0.0 | 0.1 | REACTOME CIRCADIAN CLOCK | Genes involved in Circadian Clock |
| 0.0 | 0.4 | REACTOME GLYCOGEN BREAKDOWN GLYCOGENOLYSIS | Genes involved in Glycogen breakdown (glycogenolysis) |
| 0.0 | 0.5 | REACTOME MEIOSIS | Genes involved in Meiosis |
| 0.0 | 0.5 | REACTOME POST CHAPERONIN TUBULIN FOLDING PATHWAY | Genes involved in Post-chaperonin tubulin folding pathway |
| 0.0 | 0.3 | REACTOME ACYL CHAIN REMODELLING OF PE | Genes involved in Acyl chain remodelling of PE |
| 0.0 | 0.2 | REACTOME BASE FREE SUGAR PHOSPHATE REMOVAL VIA THE SINGLE NUCLEOTIDE REPLACEMENT PATHWAY | Genes involved in Base-free sugar-phosphate removal via the single-nucleotide replacement pathway |
| 0.0 | 0.4 | REACTOME PTM GAMMA CARBOXYLATION HYPUSINE FORMATION AND ARYLSULFATASE ACTIVATION | Genes involved in PTM: gamma carboxylation, hypusine formation and arylsulfatase activation |
| 0.0 | 0.7 | REACTOME SEMA4D IN SEMAPHORIN SIGNALING | Genes involved in Sema4D in semaphorin signaling |
| 0.0 | 0.3 | REACTOME DSCAM INTERACTIONS | Genes involved in DSCAM interactions |
| 0.0 | 0.2 | REACTOME PASSIVE TRANSPORT BY AQUAPORINS | Genes involved in Passive Transport by Aquaporins |
| 0.0 | 0.2 | REACTOME REGULATED PROTEOLYSIS OF P75NTR | Genes involved in Regulated proteolysis of p75NTR |
| 0.0 | 0.3 | REACTOME BMAL1 CLOCK NPAS2 ACTIVATES CIRCADIAN EXPRESSION | Genes involved in BMAL1:CLOCK/NPAS2 Activates Circadian Expression |
| 0.0 | 0.0 | REACTOME NRAGE SIGNALS DEATH THROUGH JNK | Genes involved in NRAGE signals death through JNK |
| 0.0 | 0.3 | REACTOME AKT PHOSPHORYLATES TARGETS IN THE CYTOSOL | Genes involved in AKT phosphorylates targets in the cytosol |
| 0.0 | 0.4 | REACTOME CRMPS IN SEMA3A SIGNALING | Genes involved in CRMPs in Sema3A signaling |
| 0.0 | 1.3 | REACTOME TRANSCRIPTIONAL REGULATION OF WHITE ADIPOCYTE DIFFERENTIATION | Genes involved in Transcriptional Regulation of White Adipocyte Differentiation |
| 0.0 | 0.2 | REACTOME ETHANOL OXIDATION | Genes involved in Ethanol oxidation |