Project
A549 cells infected with SARS-CoV-2 Analysis Results (GEO series: GSE147507)
Navigation
Downloads
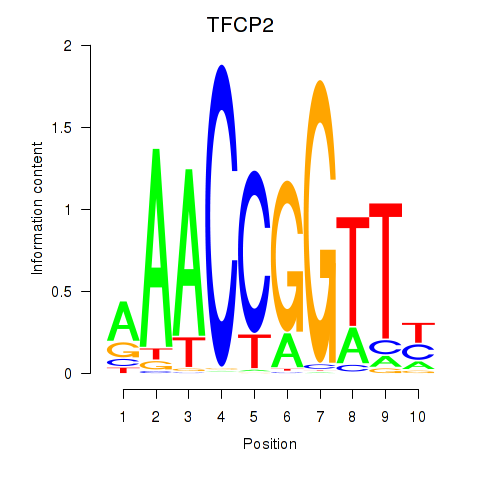
Results for TFCP2
Z-value: 1.44
Motif logo
Transcription factors associated with TFCP2
| Gene Symbol | Gene ID | Gene Info |
|---|---|---|
|
TFCP2
|
ENSG00000135457.5 | transcription factor CP2 |
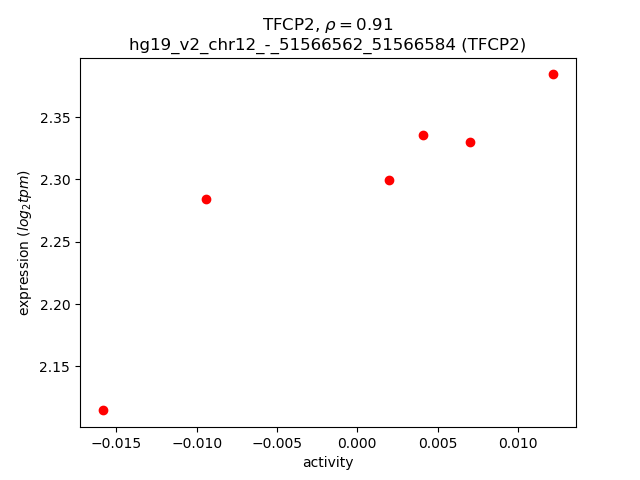
Activity-expression correlation:
| Gene | Promoter | Pearson corr. coef. | P-value | Plot |
|---|---|---|---|---|
| TFCP2 | hg19_v2_chr12_-_51566562_51566584 | 0.91 | 1.3e-02 | Click! |
Activity profile of TFCP2 motif
Sorted Z-values of TFCP2 motif
| Promoter | Log-likelihood | Transcript | Gene | Gene Info |
|---|---|---|---|---|
| chr20_-_62203808 | 1.78 |
ENST00000467148.1
|
HELZ2
|
helicase with zinc finger 2, transcriptional coactivator |
| chr7_-_120497178 | 1.67 |
ENST00000441017.1
ENST00000424710.1 ENST00000433758.1 |
TSPAN12
|
tetraspanin 12 |
| chr2_-_61765315 | 1.49 |
ENST00000406957.1
ENST00000401558.2 |
XPO1
|
exportin 1 (CRM1 homolog, yeast) |
| chr2_-_113542063 | 1.29 |
ENST00000263339.3
|
IL1A
|
interleukin 1, alpha |
| chr19_-_19739321 | 1.24 |
ENST00000588461.1
|
LPAR2
|
lysophosphatidic acid receptor 2 |
| chr11_-_96123022 | 1.21 |
ENST00000542662.1
|
CCDC82
|
coiled-coil domain containing 82 |
| chr4_-_129207942 | 1.11 |
ENST00000503588.1
|
PGRMC2
|
progesterone receptor membrane component 2 |
| chr11_+_65265141 | 1.01 |
ENST00000534336.1
|
MALAT1
|
metastasis associated lung adenocarcinoma transcript 1 (non-protein coding) |
| chrX_-_119693745 | 0.99 |
ENST00000371323.2
|
CUL4B
|
cullin 4B |
| chr9_+_125703282 | 0.97 |
ENST00000373647.4
ENST00000402311.1 |
RABGAP1
|
RAB GTPase activating protein 1 |
| chr12_-_86230315 | 0.96 |
ENST00000361228.3
|
RASSF9
|
Ras association (RalGDS/AF-6) domain family (N-terminal) member 9 |
| chr12_+_72061563 | 0.93 |
ENST00000551238.1
|
THAP2
|
THAP domain containing, apoptosis associated protein 2 |
| chr6_+_142623063 | 0.91 |
ENST00000296932.8
ENST00000367609.3 |
GPR126
|
G protein-coupled receptor 126 |
| chr3_-_113464906 | 0.90 |
ENST00000477813.1
|
NAA50
|
N(alpha)-acetyltransferase 50, NatE catalytic subunit |
| chr21_-_40720974 | 0.90 |
ENST00000380748.1
|
HMGN1
|
high mobility group nucleosome binding domain 1 |
| chr2_+_38177575 | 0.89 |
ENST00000407257.1
ENST00000417700.2 ENST00000234195.3 ENST00000442857.1 |
RMDN2
|
regulator of microtubule dynamics 2 |
| chr18_+_20494078 | 0.87 |
ENST00000579124.1
ENST00000577588.1 ENST00000582354.1 ENST00000581819.1 |
RBBP8
|
retinoblastoma binding protein 8 |
| chr2_+_198318217 | 0.85 |
ENST00000409398.1
|
COQ10B
|
coenzyme Q10 homolog B (S. cerevisiae) |
| chr14_-_71107921 | 0.85 |
ENST00000553982.1
ENST00000500016.1 |
CTD-2540L5.5
CTD-2540L5.6
|
CTD-2540L5.5 CTD-2540L5.6 |
| chr15_-_42565023 | 0.85 |
ENST00000566474.1
|
TMEM87A
|
transmembrane protein 87A |
| chr17_-_46035187 | 0.83 |
ENST00000300557.2
|
PRR15L
|
proline rich 15-like |
| chr5_+_61708582 | 0.81 |
ENST00000325324.6
|
IPO11
|
importin 11 |
| chr4_+_128702969 | 0.77 |
ENST00000508776.1
ENST00000439123.2 |
HSPA4L
|
heat shock 70kDa protein 4-like |
| chr20_-_5591626 | 0.74 |
ENST00000379019.4
|
GPCPD1
|
glycerophosphocholine phosphodiesterase GDE1 homolog (S. cerevisiae) |
| chr3_-_42845922 | 0.73 |
ENST00000452906.2
|
HIGD1A
|
HIG1 hypoxia inducible domain family, member 1A |
| chr14_-_50506589 | 0.72 |
ENST00000553914.2
|
RP11-58E21.3
|
RP11-58E21.3 |
| chr1_+_151739131 | 0.70 |
ENST00000400999.1
|
OAZ3
|
ornithine decarboxylase antizyme 3 |
| chr7_-_37488547 | 0.69 |
ENST00000453399.1
|
ELMO1
|
engulfment and cell motility 1 |
| chr4_-_129208030 | 0.65 |
ENST00000503872.1
|
PGRMC2
|
progesterone receptor membrane component 2 |
| chr10_+_6625733 | 0.64 |
ENST00000607982.1
ENST00000608526.1 |
PRKCQ-AS1
|
PRKCQ antisense RNA 1 |
| chrX_+_133507327 | 0.64 |
ENST00000332070.3
ENST00000394292.1 ENST00000370799.1 ENST00000416404.2 |
PHF6
|
PHD finger protein 6 |
| chr4_-_174255536 | 0.62 |
ENST00000446922.2
|
HMGB2
|
high mobility group box 2 |
| chr1_+_16330723 | 0.61 |
ENST00000329454.2
|
C1orf64
|
chromosome 1 open reading frame 64 |
| chr3_-_42845951 | 0.61 |
ENST00000418900.2
ENST00000430190.1 |
HIGD1A
|
HIG1 hypoxia inducible domain family, member 1A |
| chr16_-_20817753 | 0.61 |
ENST00000389345.5
ENST00000300005.3 ENST00000357967.4 ENST00000569729.1 |
ERI2
|
ERI1 exoribonuclease family member 2 |
| chr1_-_54304212 | 0.60 |
ENST00000540001.1
|
NDC1
|
NDC1 transmembrane nucleoporin |
| chr4_+_79567362 | 0.58 |
ENST00000512322.1
|
RP11-792D21.2
|
long intergenic non-protein coding RNA 1094 |
| chr15_+_63682335 | 0.57 |
ENST00000559379.1
ENST00000559821.1 |
RP11-321G12.1
|
RP11-321G12.1 |
| chr17_-_5322786 | 0.57 |
ENST00000225696.4
|
NUP88
|
nucleoporin 88kDa |
| chr12_-_76478446 | 0.56 |
ENST00000393263.3
ENST00000548044.1 ENST00000547704.1 ENST00000431879.3 ENST00000549596.1 ENST00000550934.1 ENST00000551600.1 ENST00000547479.1 ENST00000547773.1 ENST00000544816.1 ENST00000542344.1 ENST00000548273.1 |
NAP1L1
|
nucleosome assembly protein 1-like 1 |
| chr2_-_61765732 | 0.55 |
ENST00000443240.1
ENST00000436018.1 |
XPO1
|
exportin 1 (CRM1 homolog, yeast) |
| chr17_-_7082668 | 0.55 |
ENST00000573083.1
ENST00000574388.1 |
ASGR1
|
asialoglycoprotein receptor 1 |
| chr12_-_51422017 | 0.54 |
ENST00000394904.3
|
SLC11A2
|
solute carrier family 11 (proton-coupled divalent metal ion transporter), member 2 |
| chr5_-_111092873 | 0.53 |
ENST00000509025.1
ENST00000515855.1 |
NREP
|
neuronal regeneration related protein |
| chr15_-_42565221 | 0.52 |
ENST00000563371.1
ENST00000568400.1 ENST00000568432.1 |
TMEM87A
|
transmembrane protein 87A |
| chr19_-_37019136 | 0.52 |
ENST00000592282.1
|
ZNF260
|
zinc finger protein 260 |
| chr21_-_40720995 | 0.52 |
ENST00000380749.5
|
HMGN1
|
high mobility group nucleosome binding domain 1 |
| chr17_+_57297807 | 0.51 |
ENST00000284116.4
ENST00000581140.1 ENST00000581276.1 |
GDPD1
|
glycerophosphodiester phosphodiesterase domain containing 1 |
| chrX_+_133507283 | 0.51 |
ENST00000370803.3
|
PHF6
|
PHD finger protein 6 |
| chr10_-_90611566 | 0.51 |
ENST00000371930.4
|
ANKRD22
|
ankyrin repeat domain 22 |
| chr11_-_92930556 | 0.51 |
ENST00000529184.1
|
SLC36A4
|
solute carrier family 36 (proton/amino acid symporter), member 4 |
| chr17_+_42733730 | 0.51 |
ENST00000359945.3
ENST00000425535.1 |
C17orf104
|
chromosome 17 open reading frame 104 |
| chr8_+_19536083 | 0.51 |
ENST00000519803.1
|
RP11-1105O14.1
|
RP11-1105O14.1 |
| chr2_+_182850551 | 0.50 |
ENST00000452904.1
ENST00000409137.3 ENST00000280295.3 |
PPP1R1C
|
protein phosphatase 1, regulatory (inhibitor) subunit 1C |
| chr16_+_1128781 | 0.50 |
ENST00000293897.4
ENST00000562758.1 |
SSTR5
|
somatostatin receptor 5 |
| chr3_+_197476621 | 0.50 |
ENST00000241502.4
|
FYTTD1
|
forty-two-three domain containing 1 |
| chr8_+_95731904 | 0.50 |
ENST00000522422.1
|
DPY19L4
|
dpy-19-like 4 (C. elegans) |
| chr19_+_2841433 | 0.50 |
ENST00000334241.4
ENST00000585966.1 ENST00000591539.1 |
ZNF555
|
zinc finger protein 555 |
| chr9_-_125675576 | 0.49 |
ENST00000373659.3
|
ZBTB6
|
zinc finger and BTB domain containing 6 |
| chr4_+_79567057 | 0.49 |
ENST00000503259.1
ENST00000507802.1 |
RP11-792D21.2
|
long intergenic non-protein coding RNA 1094 |
| chr4_-_157892055 | 0.46 |
ENST00000422544.2
|
PDGFC
|
platelet derived growth factor C |
| chr5_-_39219641 | 0.46 |
ENST00000509072.1
ENST00000504542.1 ENST00000505428.1 ENST00000506557.1 |
FYB
|
FYN binding protein |
| chr8_-_17533838 | 0.46 |
ENST00000400046.1
|
MTUS1
|
microtubule associated tumor suppressor 1 |
| chr5_-_36242119 | 0.45 |
ENST00000511088.1
ENST00000282512.3 ENST00000506945.1 |
NADK2
|
NAD kinase 2, mitochondrial |
| chr3_+_108321623 | 0.45 |
ENST00000497905.1
ENST00000463306.1 |
DZIP3
|
DAZ interacting zinc finger protein 3 |
| chr1_-_145382362 | 0.45 |
ENST00000419817.1
ENST00000421937.3 ENST00000433081.2 |
RP11-458D21.1
|
RP11-458D21.1 |
| chr2_-_188378368 | 0.44 |
ENST00000392365.1
ENST00000435414.1 |
TFPI
|
tissue factor pathway inhibitor (lipoprotein-associated coagulation inhibitor) |
| chr6_-_84937314 | 0.44 |
ENST00000257766.4
ENST00000403245.3 |
KIAA1009
|
KIAA1009 |
| chr18_+_56531584 | 0.44 |
ENST00000590287.1
|
ZNF532
|
zinc finger protein 532 |
| chr8_-_95487331 | 0.44 |
ENST00000336148.5
|
RAD54B
|
RAD54 homolog B (S. cerevisiae) |
| chr14_+_75746781 | 0.43 |
ENST00000555347.1
|
FOS
|
FBJ murine osteosarcoma viral oncogene homolog |
| chr16_-_82045049 | 0.43 |
ENST00000532128.1
ENST00000328945.5 |
SDR42E1
|
short chain dehydrogenase/reductase family 42E, member 1 |
| chr5_+_136070614 | 0.43 |
ENST00000502421.1
|
CTB-1I21.1
|
CTB-1I21.1 |
| chr4_-_141348763 | 0.43 |
ENST00000509477.1
|
CLGN
|
calmegin |
| chr14_+_96722539 | 0.43 |
ENST00000553356.1
|
BDKRB1
|
bradykinin receptor B1 |
| chr11_-_105892937 | 0.42 |
ENST00000301919.4
ENST00000534458.1 ENST00000530108.1 ENST00000530788.1 |
MSANTD4
|
Myb/SANT-like DNA-binding domain containing 4 with coiled-coils |
| chr2_-_200820459 | 0.42 |
ENST00000354611.4
|
TYW5
|
tRNA-yW synthesizing protein 5 |
| chr2_+_58274001 | 0.42 |
ENST00000428021.1
|
VRK2
|
vaccinia related kinase 2 |
| chr12_+_41086215 | 0.42 |
ENST00000547702.1
ENST00000551424.1 |
CNTN1
|
contactin 1 |
| chr1_-_115632035 | 0.42 |
ENST00000433172.1
ENST00000369514.2 ENST00000369516.2 ENST00000369515.2 |
TSPAN2
|
tetraspanin 2 |
| chr1_-_185286461 | 0.42 |
ENST00000367498.3
|
IVNS1ABP
|
influenza virus NS1A binding protein |
| chr5_+_65222500 | 0.41 |
ENST00000511297.1
ENST00000506030.1 |
ERBB2IP
|
erbb2 interacting protein |
| chr5_-_39219705 | 0.41 |
ENST00000351578.6
|
FYB
|
FYN binding protein |
| chr12_+_41086297 | 0.41 |
ENST00000551295.2
|
CNTN1
|
contactin 1 |
| chr19_-_51875523 | 0.41 |
ENST00000593572.1
ENST00000595157.1 |
NKG7
|
natural killer cell group 7 sequence |
| chr12_-_54982420 | 0.40 |
ENST00000257905.8
|
PPP1R1A
|
protein phosphatase 1, regulatory (inhibitor) subunit 1A |
| chr5_-_111093406 | 0.40 |
ENST00000379671.3
|
NREP
|
neuronal regeneration related protein |
| chr18_-_54305658 | 0.40 |
ENST00000586262.1
ENST00000217515.6 |
TXNL1
|
thioredoxin-like 1 |
| chr3_+_138153451 | 0.39 |
ENST00000389567.4
ENST00000289135.4 |
ESYT3
|
extended synaptotagmin-like protein 3 |
| chr1_-_153513170 | 0.39 |
ENST00000368717.2
|
S100A5
|
S100 calcium binding protein A5 |
| chr2_+_191792376 | 0.39 |
ENST00000409428.1
ENST00000409215.1 |
GLS
|
glutaminase |
| chr7_-_108168580 | 0.39 |
ENST00000453085.1
|
PNPLA8
|
patatin-like phospholipase domain containing 8 |
| chr3_+_197477038 | 0.39 |
ENST00000426031.1
ENST00000424384.2 |
FYTTD1
|
forty-two-three domain containing 1 |
| chr14_+_32547434 | 0.38 |
ENST00000556191.1
ENST00000554090.1 |
ARHGAP5
|
Rho GTPase activating protein 5 |
| chr6_+_64282447 | 0.38 |
ENST00000370650.2
ENST00000578299.1 |
PTP4A1
|
protein tyrosine phosphatase type IVA, member 1 |
| chr2_+_172290707 | 0.38 |
ENST00000375255.3
ENST00000539783.1 |
DCAF17
|
DDB1 and CUL4 associated factor 17 |
| chr8_-_103250997 | 0.37 |
ENST00000522368.1
|
RRM2B
|
ribonucleotide reductase M2 B (TP53 inducible) |
| chr11_-_57334732 | 0.37 |
ENST00000526659.1
ENST00000527022.1 |
UBE2L6
|
ubiquitin-conjugating enzyme E2L 6 |
| chr18_-_67872891 | 0.37 |
ENST00000454359.1
ENST00000437017.1 |
RTTN
|
rotatin |
| chr1_-_22109682 | 0.36 |
ENST00000400301.1
ENST00000532737.1 |
USP48
|
ubiquitin specific peptidase 48 |
| chr4_+_107236692 | 0.36 |
ENST00000510207.1
|
AIMP1
|
aminoacyl tRNA synthetase complex-interacting multifunctional protein 1 |
| chr3_-_142297668 | 0.36 |
ENST00000350721.4
ENST00000383101.3 |
ATR
|
ataxia telangiectasia and Rad3 related |
| chr3_-_113465065 | 0.35 |
ENST00000497255.1
ENST00000478020.1 ENST00000240922.3 ENST00000493900.1 |
NAA50
|
N(alpha)-acetyltransferase 50, NatE catalytic subunit |
| chr5_+_111964133 | 0.35 |
ENST00000508879.1
ENST00000507565.1 |
RP11-159K7.2
|
RP11-159K7.2 |
| chrX_-_118925600 | 0.34 |
ENST00000361575.3
|
RPL39
|
ribosomal protein L39 |
| chr4_-_99850243 | 0.34 |
ENST00000280892.6
ENST00000511644.1 ENST00000504432.1 ENST00000505992.1 |
EIF4E
|
eukaryotic translation initiation factor 4E |
| chr13_+_52586517 | 0.34 |
ENST00000523764.1
ENST00000521508.1 |
ALG11
|
ALG11, alpha-1,2-mannosyltransferase |
| chr2_+_200820269 | 0.33 |
ENST00000392290.1
|
C2orf47
|
chromosome 2 open reading frame 47 |
| chrX_+_30671476 | 0.33 |
ENST00000378946.3
ENST00000378943.3 ENST00000378945.3 ENST00000427190.1 ENST00000378941.3 |
GK
|
glycerol kinase |
| chr8_-_95487272 | 0.33 |
ENST00000297592.5
|
RAD54B
|
RAD54 homolog B (S. cerevisiae) |
| chr1_+_153330322 | 0.33 |
ENST00000368738.3
|
S100A9
|
S100 calcium binding protein A9 |
| chr4_-_53522703 | 0.33 |
ENST00000508499.1
|
USP46
|
ubiquitin specific peptidase 46 |
| chr4_-_141348789 | 0.33 |
ENST00000414773.1
|
CLGN
|
calmegin |
| chr17_+_7608511 | 0.33 |
ENST00000226091.2
|
EFNB3
|
ephrin-B3 |
| chr20_+_36974759 | 0.32 |
ENST00000217407.2
|
LBP
|
lipopolysaccharide binding protein |
| chr6_+_64281906 | 0.32 |
ENST00000370651.3
|
PTP4A1
|
protein tyrosine phosphatase type IVA, member 1 |
| chr11_+_120107344 | 0.32 |
ENST00000260264.4
|
POU2F3
|
POU class 2 homeobox 3 |
| chr19_-_11849697 | 0.32 |
ENST00000586121.1
ENST00000431998.1 ENST00000341191.6 ENST00000545749.1 ENST00000440527.1 |
ZNF823
|
zinc finger protein 823 |
| chr13_+_27825706 | 0.32 |
ENST00000272274.4
ENST00000319826.4 ENST00000326092.4 |
RPL21
|
ribosomal protein L21 |
| chr4_-_174255400 | 0.32 |
ENST00000506267.1
|
HMGB2
|
high mobility group box 2 |
| chr2_-_56150184 | 0.32 |
ENST00000394554.1
|
EFEMP1
|
EGF containing fibulin-like extracellular matrix protein 1 |
| chr2_+_75874105 | 0.31 |
ENST00000476622.1
|
MRPL19
|
mitochondrial ribosomal protein L19 |
| chr19_+_1491144 | 0.31 |
ENST00000233596.3
|
REEP6
|
receptor accessory protein 6 |
| chr18_-_67873078 | 0.31 |
ENST00000255674.6
|
RTTN
|
rotatin |
| chr17_-_40169659 | 0.31 |
ENST00000457167.4
|
DNAJC7
|
DnaJ (Hsp40) homolog, subfamily C, member 7 |
| chr11_-_114271139 | 0.31 |
ENST00000325636.4
|
C11orf71
|
chromosome 11 open reading frame 71 |
| chr3_+_97483572 | 0.30 |
ENST00000335979.2
ENST00000394206.1 |
ARL6
|
ADP-ribosylation factor-like 6 |
| chr18_+_56338750 | 0.30 |
ENST00000345724.3
|
MALT1
|
mucosa associated lymphoid tissue lymphoma translocation gene 1 |
| chr17_+_54671047 | 0.30 |
ENST00000332822.4
|
NOG
|
noggin |
| chr14_-_82089405 | 0.30 |
ENST00000554211.1
|
RP11-799P8.1
|
RP11-799P8.1 |
| chr3_-_185270342 | 0.29 |
ENST00000424591.2
|
LIPH
|
lipase, member H |
| chr17_-_33905521 | 0.29 |
ENST00000225873.4
|
PEX12
|
peroxisomal biogenesis factor 12 |
| chr11_+_96123158 | 0.29 |
ENST00000332349.4
ENST00000458427.1 |
JRKL
|
jerky homolog-like (mouse) |
| chr7_+_95115210 | 0.28 |
ENST00000428113.1
ENST00000325885.5 |
ASB4
|
ankyrin repeat and SOCS box containing 4 |
| chr12_+_130554803 | 0.28 |
ENST00000535487.1
|
RP11-474D1.2
|
RP11-474D1.2 |
| chr5_-_37371163 | 0.28 |
ENST00000513532.1
|
NUP155
|
nucleoporin 155kDa |
| chr2_-_55277692 | 0.28 |
ENST00000394611.2
|
RTN4
|
reticulon 4 |
| chr11_-_57335280 | 0.28 |
ENST00000287156.4
|
UBE2L6
|
ubiquitin-conjugating enzyme E2L 6 |
| chr7_+_76091775 | 0.28 |
ENST00000442516.1
|
DTX2
|
deltex homolog 2 (Drosophila) |
| chr1_+_100817262 | 0.28 |
ENST00000455467.1
|
CDC14A
|
cell division cycle 14A |
| chr1_-_85040090 | 0.27 |
ENST00000370630.5
|
CTBS
|
chitobiase, di-N-acetyl- |
| chr7_-_120498357 | 0.27 |
ENST00000415871.1
ENST00000222747.3 ENST00000430985.1 |
TSPAN12
|
tetraspanin 12 |
| chr4_-_141348999 | 0.27 |
ENST00000325617.5
|
CLGN
|
calmegin |
| chr5_+_54455946 | 0.27 |
ENST00000503787.1
ENST00000296734.6 ENST00000515370.1 |
GPX8
|
glutathione peroxidase 8 (putative) |
| chr16_-_3545424 | 0.26 |
ENST00000437192.3
ENST00000399645.3 |
C16orf90
|
chromosome 16 open reading frame 90 |
| chr11_+_46403303 | 0.26 |
ENST00000407067.1
ENST00000395565.1 |
MDK
|
midkine (neurite growth-promoting factor 2) |
| chr5_+_65222384 | 0.26 |
ENST00000380943.2
ENST00000416865.2 ENST00000380939.2 ENST00000380936.1 ENST00000380935.1 |
ERBB2IP
|
erbb2 interacting protein |
| chrX_+_133507389 | 0.25 |
ENST00000370800.4
|
PHF6
|
PHD finger protein 6 |
| chr6_+_106959718 | 0.25 |
ENST00000369066.3
|
AIM1
|
absent in melanoma 1 |
| chr17_-_57229155 | 0.25 |
ENST00000584089.1
|
SKA2
|
spindle and kinetochore associated complex subunit 2 |
| chr13_+_27825446 | 0.25 |
ENST00000311549.6
|
RPL21
|
ribosomal protein L21 |
| chr3_+_107241783 | 0.25 |
ENST00000415149.2
ENST00000402543.1 ENST00000325805.8 ENST00000427402.1 |
BBX
|
bobby sox homolog (Drosophila) |
| chr13_-_49975632 | 0.25 |
ENST00000457041.1
ENST00000355854.4 |
CAB39L
|
calcium binding protein 39-like |
| chr10_-_21186144 | 0.24 |
ENST00000377119.1
|
NEBL
|
nebulette |
| chr3_+_32726620 | 0.24 |
ENST00000331889.6
ENST00000328834.5 |
CNOT10
|
CCR4-NOT transcription complex, subunit 10 |
| chr4_-_157892498 | 0.24 |
ENST00000502773.1
|
PDGFC
|
platelet derived growth factor C |
| chrX_+_149009941 | 0.23 |
ENST00000535454.1
ENST00000542674.1 ENST00000286482.1 |
MAGEA8
|
melanoma antigen family A, 8 |
| chr11_-_28129656 | 0.23 |
ENST00000263181.6
|
KIF18A
|
kinesin family member 18A |
| chr10_+_75936444 | 0.23 |
ENST00000372734.3
ENST00000541550.1 |
ADK
|
adenosine kinase |
| chr19_+_15619299 | 0.23 |
ENST00000269703.3
|
CYP4F22
|
cytochrome P450, family 4, subfamily F, polypeptide 22 |
| chrX_+_119737806 | 0.23 |
ENST00000371317.5
|
MCTS1
|
malignant T cell amplified sequence 1 |
| chr11_+_113185292 | 0.23 |
ENST00000429951.1
ENST00000442859.1 ENST00000531164.1 ENST00000529850.1 ENST00000314756.3 ENST00000525965.1 |
TTC12
|
tetratricopeptide repeat domain 12 |
| chr8_+_61822605 | 0.23 |
ENST00000526936.1
|
AC022182.1
|
AC022182.1 |
| chr5_+_65222438 | 0.23 |
ENST00000380938.2
|
ERBB2IP
|
erbb2 interacting protein |
| chr11_+_46402744 | 0.22 |
ENST00000533952.1
|
MDK
|
midkine (neurite growth-promoting factor 2) |
| chrX_-_46759138 | 0.22 |
ENST00000377879.3
|
CXorf31
|
chromosome X open reading frame 31 |
| chr19_-_57678811 | 0.22 |
ENST00000554048.2
|
DUXA
|
double homeobox A |
| chr22_+_36044411 | 0.22 |
ENST00000409652.4
|
APOL6
|
apolipoprotein L, 6 |
| chr16_+_69600209 | 0.22 |
ENST00000566899.1
|
NFAT5
|
nuclear factor of activated T-cells 5, tonicity-responsive |
| chr6_+_109416684 | 0.22 |
ENST00000521522.1
ENST00000524064.1 ENST00000522608.1 ENST00000521503.1 ENST00000519407.1 ENST00000519095.1 ENST00000368968.2 ENST00000522490.1 ENST00000523209.1 ENST00000368970.2 ENST00000520883.1 ENST00000523787.1 |
CEP57L1
|
centrosomal protein 57kDa-like 1 |
| chr5_-_132362226 | 0.21 |
ENST00000509437.1
ENST00000355372.2 ENST00000513541.1 ENST00000509008.1 ENST00000513848.1 ENST00000504170.1 ENST00000324170.3 |
ZCCHC10
|
zinc finger, CCHC domain containing 10 |
| chr8_-_95908902 | 0.21 |
ENST00000520509.1
|
CCNE2
|
cyclin E2 |
| chr4_+_79567314 | 0.21 |
ENST00000503539.1
ENST00000504675.1 |
RP11-792D21.2
|
long intergenic non-protein coding RNA 1094 |
| chr17_-_7082861 | 0.21 |
ENST00000269299.3
|
ASGR1
|
asialoglycoprotein receptor 1 |
| chr11_+_114271251 | 0.21 |
ENST00000375490.5
|
RBM7
|
RNA binding motif protein 7 |
| chr12_-_118796971 | 0.21 |
ENST00000542902.1
|
TAOK3
|
TAO kinase 3 |
| chr6_+_107349392 | 0.21 |
ENST00000443043.1
ENST00000405204.2 ENST00000311381.5 |
C6orf203
|
chromosome 6 open reading frame 203 |
| chr1_-_109656439 | 0.20 |
ENST00000369949.4
|
C1orf194
|
chromosome 1 open reading frame 194 |
| chrX_+_1733876 | 0.20 |
ENST00000381241.3
|
ASMT
|
acetylserotonin O-methyltransferase |
| chr17_+_68100989 | 0.20 |
ENST00000585558.1
ENST00000392670.1 |
KCNJ16
|
potassium inwardly-rectifying channel, subfamily J, member 16 |
| chr5_-_37371278 | 0.20 |
ENST00000231498.3
|
NUP155
|
nucleoporin 155kDa |
| chr17_+_47210125 | 0.20 |
ENST00000393354.2
|
B4GALNT2
|
beta-1,4-N-acetyl-galactosaminyl transferase 2 |
| chr18_+_56338618 | 0.20 |
ENST00000348428.3
|
MALT1
|
mucosa associated lymphoid tissue lymphoma translocation gene 1 |
| chr4_-_107237340 | 0.20 |
ENST00000394706.3
|
TBCK
|
TBC1 domain containing kinase |
| chr2_+_33661382 | 0.20 |
ENST00000402538.3
|
RASGRP3
|
RAS guanyl releasing protein 3 (calcium and DAG-regulated) |
| chr1_+_26348259 | 0.19 |
ENST00000374280.3
|
EXTL1
|
exostosin-like glycosyltransferase 1 |
| chr14_+_50999744 | 0.19 |
ENST00000441560.2
|
ATL1
|
atlastin GTPase 1 |
| chr6_+_31496494 | 0.19 |
ENST00000376191.2
|
MCCD1
|
mitochondrial coiled-coil domain 1 |
| chr20_-_61274656 | 0.19 |
ENST00000370520.3
|
RP11-93B14.6
|
HCG2018282; Uncharacterized protein |
| chr5_-_111093167 | 0.19 |
ENST00000446294.2
ENST00000419114.2 |
NREP
|
neuronal regeneration related protein |
| chr10_-_33625154 | 0.19 |
ENST00000265371.4
|
NRP1
|
neuropilin 1 |
| chr12_-_54982300 | 0.19 |
ENST00000547431.1
|
PPP1R1A
|
protein phosphatase 1, regulatory (inhibitor) subunit 1A |
| chrX_-_48776292 | 0.19 |
ENST00000376509.4
|
PIM2
|
pim-2 oncogene |
| chr22_+_51176624 | 0.18 |
ENST00000216139.5
ENST00000529621.1 |
ACR
|
acrosin |
| chr17_+_33474826 | 0.18 |
ENST00000268876.5
ENST00000433649.1 ENST00000378449.1 |
UNC45B
|
unc-45 homolog B (C. elegans) |
| chr1_+_164528866 | 0.18 |
ENST00000420696.2
|
PBX1
|
pre-B-cell leukemia homeobox 1 |
| chr7_-_6048702 | 0.18 |
ENST00000265849.7
|
PMS2
|
PMS2 postmeiotic segregation increased 2 (S. cerevisiae) |
| chr6_+_126240442 | 0.18 |
ENST00000448104.1
ENST00000438495.1 ENST00000444128.1 |
NCOA7
|
nuclear receptor coactivator 7 |
| chr12_-_118796910 | 0.18 |
ENST00000541186.1
ENST00000539872.1 |
TAOK3
|
TAO kinase 3 |
| chrX_+_151883090 | 0.18 |
ENST00000370293.2
ENST00000423993.1 ENST00000447530.1 ENST00000458057.1 ENST00000331220.2 ENST00000422085.1 ENST00000453150.1 ENST00000409560.1 |
MAGEA2B
|
melanoma antigen family A, 2B |
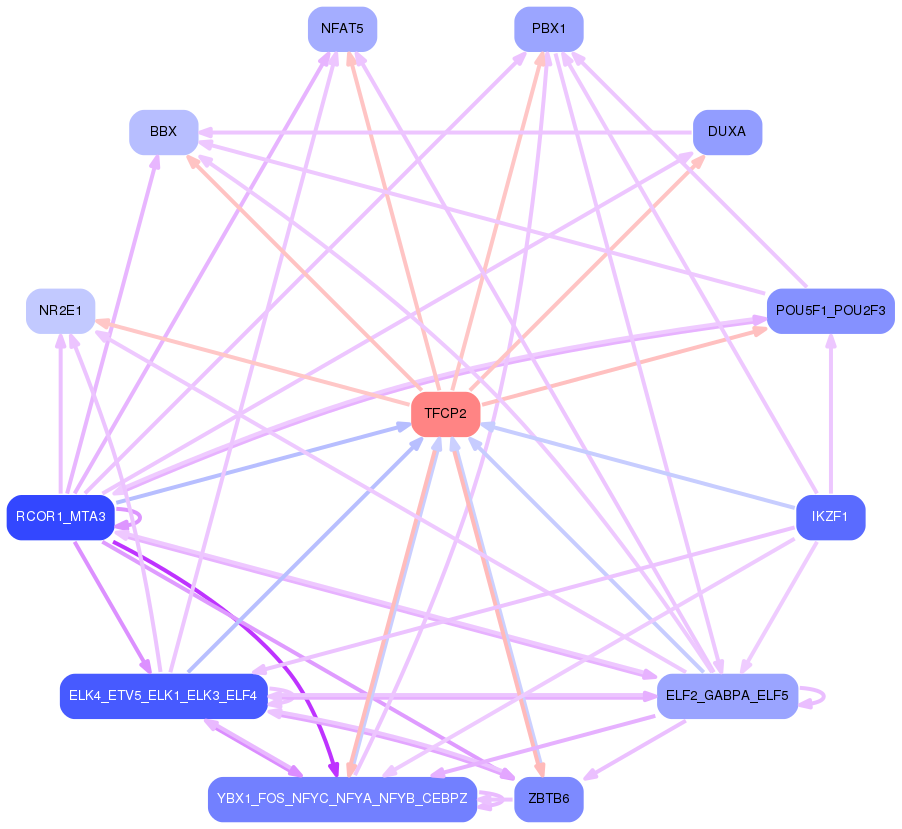
Network of associatons between targets according to the STRING database.

First level regulatory network of TFCP2
Gene Ontology Analysis
Gene overrepresentation in biological_process category:
| Log-likelihood per target | Total log-likelihood | Term | Description |
|---|---|---|---|
| 0.3 | 2.6 | GO:0000056 | ribosomal small subunit export from nucleus(GO:0000056) |
| 0.2 | 0.9 | GO:0001835 | blastocyst hatching(GO:0001835) hatching(GO:0035188) organism emergence from protective structure(GO:0071684) |
| 0.2 | 0.6 | GO:0051300 | spindle pole body duplication(GO:0030474) spindle pole body organization(GO:0051300) spindle pole body localization(GO:0070631) establishment of spindle pole body localization(GO:0070632) spindle pole body localization to nuclear envelope(GO:0071789) establishment of spindle pole body localization to nuclear envelope(GO:0071790) |
| 0.2 | 0.2 | GO:0031081 | nuclear pore distribution(GO:0031081) nuclear pore localization(GO:0051664) |
| 0.2 | 0.5 | GO:0038169 | somatostatin receptor signaling pathway(GO:0038169) somatostatin signaling pathway(GO:0038170) |
| 0.2 | 1.3 | GO:0035234 | ectopic germ cell programmed cell death(GO:0035234) |
| 0.1 | 0.7 | GO:1902268 | negative regulation of polyamine transmembrane transport(GO:1902268) |
| 0.1 | 0.5 | GO:0036228 | protein targeting to nuclear inner membrane(GO:0036228) |
| 0.1 | 0.3 | GO:0030186 | melatonin metabolic process(GO:0030186) melatonin biosynthetic process(GO:0030187) |
| 0.1 | 0.3 | GO:0035606 | peptidyl-cysteine S-trans-nitrosylation(GO:0035606) |
| 0.1 | 0.3 | GO:0015920 | leukocyte chemotaxis involved in inflammatory response(GO:0002232) lipopolysaccharide transport(GO:0015920) |
| 0.1 | 0.5 | GO:0001923 | B-1 B cell differentiation(GO:0001923) |
| 0.1 | 0.4 | GO:0046338 | phosphatidylethanolamine catabolic process(GO:0046338) |
| 0.1 | 0.5 | GO:0015692 | lead ion transport(GO:0015692) |
| 0.1 | 1.3 | GO:0070601 | centromeric sister chromatid cohesion(GO:0070601) |
| 0.1 | 0.5 | GO:0030421 | defecation(GO:0030421) |
| 0.1 | 0.7 | GO:0072501 | cellular phosphate ion homeostasis(GO:0030643) cellular divalent inorganic anion homeostasis(GO:0072501) cellular trivalent inorganic anion homeostasis(GO:0072502) |
| 0.1 | 0.2 | GO:0044209 | AMP salvage(GO:0044209) |
| 0.1 | 0.2 | GO:0002188 | translation reinitiation(GO:0002188) |
| 0.1 | 0.3 | GO:0046909 | intermembrane transport(GO:0046909) protein transport from ciliary membrane to plasma membrane(GO:1903445) |
| 0.1 | 0.9 | GO:0045654 | positive regulation of megakaryocyte differentiation(GO:0045654) |
| 0.1 | 0.4 | GO:1904868 | telomerase catalytic core complex assembly(GO:1904868) regulation of telomerase catalytic core complex assembly(GO:1904882) positive regulation of telomerase catalytic core complex assembly(GO:1904884) |
| 0.1 | 0.4 | GO:0014005 | microglia differentiation(GO:0014004) microglia development(GO:0014005) |
| 0.1 | 0.3 | GO:0006610 | ribosomal protein import into nucleus(GO:0006610) |
| 0.1 | 0.4 | GO:0007598 | blood coagulation, extrinsic pathway(GO:0007598) |
| 0.1 | 0.6 | GO:0015808 | L-alanine transport(GO:0015808) proline transmembrane transport(GO:0035524) |
| 0.1 | 0.5 | GO:0060300 | regulation of cytokine activity(GO:0060300) |
| 0.1 | 0.2 | GO:0070408 | carbamoyl phosphate metabolic process(GO:0070408) carbamoyl phosphate biosynthetic process(GO:0070409) response to ammonia(GO:1903717) cellular response to ammonia(GO:1903718) |
| 0.1 | 0.5 | GO:0006741 | NADP biosynthetic process(GO:0006741) |
| 0.1 | 0.4 | GO:0006543 | glutamine catabolic process(GO:0006543) |
| 0.1 | 0.3 | GO:0016198 | axon choice point recognition(GO:0016198) |
| 0.1 | 0.6 | GO:0032020 | ISG15-protein conjugation(GO:0032020) |
| 0.1 | 1.9 | GO:0010842 | retina layer formation(GO:0010842) |
| 0.1 | 0.2 | GO:0018312 | peptidyl-serine ADP-ribosylation(GO:0018312) |
| 0.0 | 0.1 | GO:0060164 | regulation of timing of neuron differentiation(GO:0060164) |
| 0.0 | 0.4 | GO:0001661 | conditioned taste aversion(GO:0001661) |
| 0.0 | 0.3 | GO:0006072 | glycerol-3-phosphate metabolic process(GO:0006072) |
| 0.0 | 0.1 | GO:0010643 | cell communication by chemical coupling(GO:0010643) |
| 0.0 | 0.2 | GO:0007341 | penetration of zona pellucida(GO:0007341) |
| 0.0 | 0.5 | GO:0018103 | protein C-linked glycosylation(GO:0018103) peptidyl-tryptophan modification(GO:0018211) protein C-linked glycosylation via tryptophan(GO:0018317) protein C-linked glycosylation via 2'-alpha-mannosyl-L-tryptophan(GO:0018406) |
| 0.0 | 1.0 | GO:0070914 | UV-damage excision repair(GO:0070914) |
| 0.0 | 0.1 | GO:0014839 | myoblast migration involved in skeletal muscle regeneration(GO:0014839) |
| 0.0 | 0.2 | GO:0010273 | detoxification of copper ion(GO:0010273) stress response to copper ion(GO:1990169) |
| 0.0 | 0.3 | GO:0048050 | post-embryonic eye morphogenesis(GO:0048050) |
| 0.0 | 0.1 | GO:0061092 | regulation of phospholipid translocation(GO:0061091) positive regulation of phospholipid translocation(GO:0061092) |
| 0.0 | 1.4 | GO:0032786 | positive regulation of DNA-templated transcription, elongation(GO:0032786) |
| 0.0 | 0.3 | GO:0008343 | adult feeding behavior(GO:0008343) |
| 0.0 | 0.9 | GO:0006744 | ubiquinone biosynthetic process(GO:0006744) quinone biosynthetic process(GO:1901663) |
| 0.0 | 0.3 | GO:0002227 | innate immune response in mucosa(GO:0002227) |
| 0.0 | 0.1 | GO:0015015 | heparan sulfate proteoglycan biosynthetic process, enzymatic modification(GO:0015015) |
| 0.0 | 1.2 | GO:0007202 | activation of phospholipase C activity(GO:0007202) |
| 0.0 | 0.3 | GO:1901166 | trunk segmentation(GO:0035290) trunk neural crest cell migration(GO:0036484) ventral trunk neural crest cell migration(GO:0036486) neural crest cell migration involved in autonomic nervous system development(GO:1901166) |
| 0.0 | 0.1 | GO:0035548 | gamma-delta T cell activation involved in immune response(GO:0002290) negative regulation of interferon-beta secretion(GO:0035548) regulation of gamma-delta T cell activation involved in immune response(GO:2001191) positive regulation of gamma-delta T cell activation involved in immune response(GO:2001193) |
| 0.0 | 0.2 | GO:0048388 | endosomal lumen acidification(GO:0048388) |
| 0.0 | 0.1 | GO:1901165 | positive regulation of trophoblast cell migration(GO:1901165) |
| 0.0 | 0.1 | GO:0045349 | interferon-alpha biosynthetic process(GO:0045349) regulation of interferon-alpha biosynthetic process(GO:0045354) |
| 0.0 | 0.2 | GO:0015853 | adenine transport(GO:0015853) |
| 0.0 | 0.1 | GO:0006421 | asparaginyl-tRNA aminoacylation(GO:0006421) |
| 0.0 | 0.7 | GO:0007171 | activation of transmembrane receptor protein tyrosine kinase activity(GO:0007171) |
| 0.0 | 0.1 | GO:0048698 | negative regulation of collateral sprouting in absence of injury(GO:0048698) |
| 0.0 | 0.1 | GO:1902904 | negative regulation of fibril organization(GO:1902904) chaperone-mediated autophagy translocation complex disassembly(GO:1904764) |
| 0.0 | 1.0 | GO:0007339 | binding of sperm to zona pellucida(GO:0007339) |
| 0.0 | 0.4 | GO:2000659 | regulation of interleukin-1-mediated signaling pathway(GO:2000659) |
| 0.0 | 0.8 | GO:0006312 | mitotic recombination(GO:0006312) |
| 0.0 | 0.1 | GO:2000638 | regulation of SREBP signaling pathway(GO:2000638) negative regulation of SREBP signaling pathway(GO:2000639) |
| 0.0 | 0.1 | GO:0033364 | mast cell secretory granule organization(GO:0033364) |
| 0.0 | 0.4 | GO:0006264 | mitochondrial DNA replication(GO:0006264) |
| 0.0 | 0.4 | GO:0051255 | spindle midzone assembly(GO:0051255) |
| 0.0 | 0.2 | GO:0019276 | UDP-N-acetylgalactosamine metabolic process(GO:0019276) lipid glycosylation(GO:0030259) |
| 0.0 | 0.3 | GO:0070389 | chaperone cofactor-dependent protein refolding(GO:0070389) |
| 0.0 | 0.9 | GO:0006607 | NLS-bearing protein import into nucleus(GO:0006607) |
| 0.0 | 0.1 | GO:0042998 | positive regulation of Golgi to plasma membrane protein transport(GO:0042998) |
| 0.0 | 0.2 | GO:0071787 | endoplasmic reticulum tubular network assembly(GO:0071787) |
| 0.0 | 0.3 | GO:0006030 | chitin metabolic process(GO:0006030) chitin catabolic process(GO:0006032) |
| 0.0 | 0.1 | GO:0071442 | positive regulation of histone H3-K14 acetylation(GO:0071442) regulation of stem cell division(GO:2000035) |
| 0.0 | 0.3 | GO:2001214 | positive regulation of vasculogenesis(GO:2001214) |
| 0.0 | 0.3 | GO:0043922 | negative regulation by host of viral transcription(GO:0043922) |
| 0.0 | 0.1 | GO:1901993 | meiotic cell cycle phase transition(GO:0044771) regulation of meiotic cell cycle phase transition(GO:1901993) negative regulation of meiotic cell cycle phase transition(GO:1901994) |
| 0.0 | 0.1 | GO:2000774 | positive regulation of cellular senescence(GO:2000774) |
| 0.0 | 0.2 | GO:0072520 | seminiferous tubule development(GO:0072520) |
| 0.0 | 0.7 | GO:0001937 | negative regulation of endothelial cell proliferation(GO:0001937) |
| 0.0 | 0.3 | GO:0050908 | detection of light stimulus involved in visual perception(GO:0050908) detection of light stimulus involved in sensory perception(GO:0050962) |
| 0.0 | 0.3 | GO:0007095 | mitotic G2 DNA damage checkpoint(GO:0007095) |
| 0.0 | 0.8 | GO:0010765 | positive regulation of sodium ion transport(GO:0010765) |
| 0.0 | 0.2 | GO:1902083 | negative regulation of peptidyl-cysteine S-nitrosylation(GO:1902083) |
| 0.0 | 0.3 | GO:0006490 | oligosaccharide-lipid intermediate biosynthetic process(GO:0006490) |
| 0.0 | 0.1 | GO:0046952 | ketone body catabolic process(GO:0046952) |
| 0.0 | 0.6 | GO:0051281 | positive regulation of release of sequestered calcium ion into cytosol(GO:0051281) |
| 0.0 | 0.1 | GO:0021759 | globus pallidus development(GO:0021759) |
| 0.0 | 0.6 | GO:0016601 | Rac protein signal transduction(GO:0016601) |
| 0.0 | 0.2 | GO:0016446 | somatic hypermutation of immunoglobulin genes(GO:0016446) |
Gene overrepresentation in cellular_component category:
| Log-likelihood per target | Total log-likelihood | Term | Description |
|---|---|---|---|
| 0.2 | 0.6 | GO:0070762 | nuclear pore transmembrane ring(GO:0070762) |
| 0.2 | 1.3 | GO:0031415 | NatA complex(GO:0031415) |
| 0.1 | 0.7 | GO:0017102 | methionyl glutamyl tRNA synthetase complex(GO:0017102) |
| 0.1 | 0.5 | GO:0044611 | nuclear pore inner ring(GO:0044611) |
| 0.1 | 1.7 | GO:0005642 | annulate lamellae(GO:0005642) |
| 0.1 | 0.5 | GO:0032449 | CBM complex(GO:0032449) |
| 0.1 | 1.0 | GO:0031465 | Cul4B-RING E3 ubiquitin ligase complex(GO:0031465) |
| 0.1 | 0.5 | GO:0070826 | paraferritin complex(GO:0070826) |
| 0.1 | 0.3 | GO:0005879 | axonemal microtubule(GO:0005879) |
| 0.1 | 0.2 | GO:0097135 | cyclin E2-CDK2 complex(GO:0097135) |
| 0.0 | 0.4 | GO:0035976 | AP1 complex(GO:0035976) |
| 0.0 | 0.4 | GO:0005971 | ribonucleoside-diphosphate reductase complex(GO:0005971) |
| 0.0 | 1.0 | GO:0012510 | trans-Golgi network transport vesicle membrane(GO:0012510) |
| 0.0 | 0.4 | GO:0000836 | Hrd1p ubiquitin ligase complex(GO:0000836) |
| 0.0 | 0.1 | GO:0048179 | activin receptor complex(GO:0048179) |
| 0.0 | 0.2 | GO:0044391 | ribosomal subunit(GO:0044391) |
| 0.0 | 0.2 | GO:0032389 | MutLalpha complex(GO:0032389) |
| 0.0 | 0.8 | GO:0032045 | guanyl-nucleotide exchange factor complex(GO:0032045) |
| 0.0 | 0.2 | GO:0071817 | MMXD complex(GO:0071817) |
| 0.0 | 0.4 | GO:0000940 | condensed chromosome outer kinetochore(GO:0000940) |
| 0.0 | 0.2 | GO:0005899 | insulin receptor complex(GO:0005899) |
| 0.0 | 0.1 | GO:0034388 | Pwp2p-containing subcomplex of 90S preribosome(GO:0034388) |
| 0.0 | 0.3 | GO:0060091 | kinocilium(GO:0060091) |
| 0.0 | 0.1 | GO:0000221 | vacuolar proton-transporting V-type ATPase, V1 domain(GO:0000221) |
| 0.0 | 0.3 | GO:0031462 | Cul2-RING ubiquitin ligase complex(GO:0031462) |
| 0.0 | 0.3 | GO:0033391 | chromatoid body(GO:0033391) |
| 0.0 | 0.2 | GO:0097443 | sorting endosome(GO:0097443) |
| 0.0 | 0.1 | GO:0098575 | lumenal side of lysosomal membrane(GO:0098575) |
| 0.0 | 0.1 | GO:0031232 | extrinsic component of external side of plasma membrane(GO:0031232) |
| 0.0 | 0.1 | GO:1990452 | Parkin-FBXW7-Cul1 ubiquitin ligase complex(GO:1990452) |
| 0.0 | 0.2 | GO:0005828 | kinetochore microtubule(GO:0005828) |
| 0.0 | 0.1 | GO:0008282 | ATP-sensitive potassium channel complex(GO:0008282) |
| 0.0 | 0.2 | GO:0000137 | Golgi cis cisterna(GO:0000137) |
| 0.0 | 0.4 | GO:0044232 | organelle membrane contact site(GO:0044232) |
| 0.0 | 1.3 | GO:0070469 | respiratory chain(GO:0070469) |
| 0.0 | 0.4 | GO:0080008 | Cul4-RING E3 ubiquitin ligase complex(GO:0080008) |
Gene overrepresentation in molecular_function category:
| Log-likelihood per target | Total log-likelihood | Term | Description |
|---|---|---|---|
| 0.2 | 0.7 | GO:0047389 | glycerophosphocholine phosphodiesterase activity(GO:0047389) |
| 0.2 | 0.8 | GO:0015616 | DNA translocase activity(GO:0015616) |
| 0.2 | 0.9 | GO:0044378 | non-sequence-specific DNA binding, bending(GO:0044378) |
| 0.2 | 0.5 | GO:0004994 | somatostatin receptor activity(GO:0004994) |
| 0.1 | 0.4 | GO:0004947 | bradykinin receptor activity(GO:0004947) |
| 0.1 | 0.7 | GO:0008073 | ornithine decarboxylase inhibitor activity(GO:0008073) |
| 0.1 | 0.6 | GO:0015173 | aromatic amino acid transmembrane transporter activity(GO:0015173) |
| 0.1 | 0.8 | GO:0004873 | asialoglycoprotein receptor activity(GO:0004873) |
| 0.1 | 2.0 | GO:0005049 | nuclear export signal receptor activity(GO:0005049) |
| 0.1 | 1.2 | GO:0070915 | lysophosphatidic acid receptor activity(GO:0070915) |
| 0.1 | 1.1 | GO:0004865 | protein serine/threonine phosphatase inhibitor activity(GO:0004865) |
| 0.1 | 0.9 | GO:0048039 | ubiquinone binding(GO:0048039) |
| 0.1 | 0.5 | GO:0015087 | cadmium ion transmembrane transporter activity(GO:0015086) cobalt ion transmembrane transporter activity(GO:0015087) lead ion transmembrane transporter activity(GO:0015094) ferrous iron uptake transmembrane transporter activity(GO:0015639) |
| 0.1 | 0.3 | GO:0000026 | alpha-1,2-mannosyltransferase activity(GO:0000026) |
| 0.1 | 1.9 | GO:0042813 | Wnt-activated receptor activity(GO:0042813) |
| 0.1 | 1.3 | GO:0004596 | peptide alpha-N-acetyltransferase activity(GO:0004596) |
| 0.1 | 1.3 | GO:0005149 | interleukin-1 receptor binding(GO:0005149) |
| 0.1 | 0.6 | GO:0042296 | ISG15 transferase activity(GO:0042296) |
| 0.1 | 0.3 | GO:0005006 | epidermal growth factor-activated receptor activity(GO:0005006) |
| 0.1 | 0.4 | GO:0003854 | 3-beta-hydroxy-delta5-steroid dehydrogenase activity(GO:0003854) |
| 0.1 | 0.2 | GO:0052810 | 1-phosphatidylinositol-5-kinase activity(GO:0052810) |
| 0.1 | 0.3 | GO:0035662 | Toll-like receptor 4 binding(GO:0035662) |
| 0.1 | 0.2 | GO:1990404 | protein ADP-ribosylase activity(GO:1990404) |
| 0.0 | 0.6 | GO:0032407 | MutSalpha complex binding(GO:0032407) |
| 0.0 | 0.4 | GO:0004359 | glutaminase activity(GO:0004359) |
| 0.0 | 0.3 | GO:0008172 | S-methyltransferase activity(GO:0008172) |
| 0.0 | 0.4 | GO:0004748 | ribonucleoside-diphosphate reductase activity, thioredoxin disulfide as acceptor(GO:0004748) oxidoreductase activity, acting on CH or CH2 groups, disulfide as acceptor(GO:0016728) ribonucleoside-diphosphate reductase activity(GO:0061731) |
| 0.0 | 0.2 | GO:0004040 | amidase activity(GO:0004040) |
| 0.0 | 0.3 | GO:0070891 | lipoteichoic acid binding(GO:0070891) |
| 0.0 | 0.2 | GO:0004088 | carbamoyl-phosphate synthase (ammonia) activity(GO:0004087) carbamoyl-phosphate synthase (glutamine-hydrolyzing) activity(GO:0004088) |
| 0.0 | 0.0 | GO:0004618 | phosphoglycerate kinase activity(GO:0004618) |
| 0.0 | 0.9 | GO:0000014 | single-stranded DNA endodeoxyribonuclease activity(GO:0000014) |
| 0.0 | 0.1 | GO:0017095 | heparan sulfate 6-O-sulfotransferase activity(GO:0017095) |
| 0.0 | 1.3 | GO:0017056 | structural constituent of nuclear pore(GO:0017056) |
| 0.0 | 0.2 | GO:0015207 | ATP:ADP antiporter activity(GO:0005471) adenine transmembrane transporter activity(GO:0015207) |
| 0.0 | 0.2 | GO:0038085 | vascular endothelial growth factor binding(GO:0038085) |
| 0.0 | 0.1 | GO:0015361 | low-affinity sodium:dicarboxylate symporter activity(GO:0015361) |
| 0.0 | 0.4 | GO:0047134 | protein-disulfide reductase activity(GO:0047134) |
| 0.0 | 0.2 | GO:0050508 | glucuronosyl-N-acetylglucosaminyl-proteoglycan 4-alpha-N-acetylglucosaminyltransferase activity(GO:0050508) |
| 0.0 | 0.1 | GO:0030107 | HLA-A specific inhibitory MHC class I receptor activity(GO:0030107) HLA-B specific inhibitory MHC class I receptor activity(GO:0030109) inhibitory MHC class I receptor activity(GO:0032396) |
| 0.0 | 0.2 | GO:0072320 | volume-sensitive chloride channel activity(GO:0072320) |
| 0.0 | 0.2 | GO:0046870 | cadmium ion binding(GO:0046870) |
| 0.0 | 0.3 | GO:0005005 | transmembrane-ephrin receptor activity(GO:0005005) |
| 0.0 | 0.2 | GO:0004609 | phosphatidylserine decarboxylase activity(GO:0004609) |
| 0.0 | 1.4 | GO:0031492 | nucleosomal DNA binding(GO:0031492) |
| 0.0 | 0.1 | GO:0016361 | activin receptor activity, type I(GO:0016361) |
| 0.0 | 0.5 | GO:0015467 | G-protein activated inward rectifier potassium channel activity(GO:0015467) |
| 0.0 | 0.4 | GO:0047499 | calcium-independent phospholipase A2 activity(GO:0047499) |
| 0.0 | 1.1 | GO:0044183 | protein binding involved in protein folding(GO:0044183) |
| 0.0 | 0.1 | GO:0008260 | 3-oxoacid CoA-transferase activity(GO:0008260) |
| 0.0 | 0.1 | GO:0017098 | sulfonylurea receptor binding(GO:0017098) |
| 0.0 | 0.7 | GO:0005161 | platelet-derived growth factor receptor binding(GO:0005161) |
| 0.0 | 0.4 | GO:1904264 | ubiquitin protein ligase activity involved in ERAD pathway(GO:1904264) |
| 0.0 | 0.1 | GO:0055131 | C3HC4-type RING finger domain binding(GO:0055131) |
| 0.0 | 0.3 | GO:0004568 | chitinase activity(GO:0004568) |
| 0.0 | 0.2 | GO:0004459 | L-lactate dehydrogenase activity(GO:0004459) |
| 0.0 | 0.5 | GO:0004622 | lysophospholipase activity(GO:0004622) |
| 0.0 | 1.4 | GO:0030374 | ligand-dependent nuclear receptor transcription coactivator activity(GO:0030374) |
| 0.0 | 0.1 | GO:0008273 | calcium, potassium:sodium antiporter activity(GO:0008273) |
| 0.0 | 0.1 | GO:0071253 | connexin binding(GO:0071253) |
| 0.0 | 0.2 | GO:0008607 | phosphorylase kinase regulator activity(GO:0008607) |
| 0.0 | 1.4 | GO:0097110 | scaffold protein binding(GO:0097110) |
| 0.0 | 0.1 | GO:0050816 | phosphothreonine binding(GO:0050816) |
| 0.0 | 1.0 | GO:0000049 | tRNA binding(GO:0000049) |
| 0.0 | 0.1 | GO:0090554 | phosphatidylcholine-translocating ATPase activity(GO:0090554) |
| 0.0 | 0.4 | GO:0000030 | mannosyltransferase activity(GO:0000030) |
| 0.0 | 0.0 | GO:0047066 | phospholipid-hydroperoxide glutathione peroxidase activity(GO:0047066) |
| 0.0 | 0.3 | GO:0045499 | chemorepellent activity(GO:0045499) |
| 0.0 | 0.3 | GO:0004602 | glutathione peroxidase activity(GO:0004602) |
| 0.0 | 0.1 | GO:0019834 | phospholipase A2 inhibitor activity(GO:0019834) |
| 0.0 | 0.8 | GO:0008138 | protein tyrosine/serine/threonine phosphatase activity(GO:0008138) |
| 0.0 | 1.4 | GO:0003707 | steroid hormone receptor activity(GO:0003707) |
Gene overrepresentation in C2:CP category:
| Log-likelihood per target | Total log-likelihood | Term | Description |
|---|---|---|---|
| 0.1 | 2.0 | PID RANBP2 PATHWAY | Sumoylation by RanBP2 regulates transcriptional repression |
| 0.0 | 1.2 | PID BARD1 PATHWAY | BARD1 signaling events |
| 0.0 | 0.4 | PID TCR RAS PATHWAY | Ras signaling in the CD4+ TCR pathway |
| 0.0 | 0.2 | SA REG CASCADE OF CYCLIN EXPR | Expression of cyclins regulates progression through the cell cycle by activating cyclin-dependent kinases. |
| 0.0 | 1.4 | PID DELTA NP63 PATHWAY | Validated transcriptional targets of deltaNp63 isoforms |
| 0.0 | 0.7 | PID PRL SIGNALING EVENTS PATHWAY | Signaling events mediated by PRL |
| 0.0 | 0.9 | PID SYNDECAN 4 PATHWAY | Syndecan-4-mediated signaling events |
| 0.0 | 0.7 | PID IL8 CXCR2 PATHWAY | IL8- and CXCR2-mediated signaling events |
| 0.0 | 0.5 | PID NFKAPPAB CANONICAL PATHWAY | Canonical NF-kappaB pathway |
| 0.0 | 1.3 | PID LYSOPHOSPHOLIPID PATHWAY | LPA receptor mediated events |
| 0.0 | 0.3 | PID TOLL ENDOGENOUS PATHWAY | Endogenous TLR signaling |
Gene overrepresentation in C2:CP:REACTOME category:
| Log-likelihood per target | Total log-likelihood | Term | Description |
|---|---|---|---|
| 0.1 | 2.0 | REACTOME CYCLIN A B1 ASSOCIATED EVENTS DURING G2 M TRANSITION | Genes involved in Cyclin A/B1 associated events during G2/M transition |
| 0.0 | 0.9 | REACTOME APOPTOSIS INDUCED DNA FRAGMENTATION | Genes involved in Apoptosis induced DNA fragmentation |
| 0.0 | 0.9 | REACTOME VEGF LIGAND RECEPTOR INTERACTIONS | Genes involved in VEGF ligand-receptor interactions |
| 0.0 | 0.4 | REACTOME G2 M DNA DAMAGE CHECKPOINT | Genes involved in G2/M DNA damage checkpoint |
| 0.0 | 1.6 | REACTOME TRANSPORT OF MATURE MRNA DERIVED FROM AN INTRONLESS TRANSCRIPT | Genes involved in Transport of Mature mRNA Derived from an Intronless Transcript |
| 0.0 | 0.6 | REACTOME DOWNSTREAM TCR SIGNALING | Genes involved in Downstream TCR signaling |
| 0.0 | 0.8 | REACTOME CYTOSOLIC TRNA AMINOACYLATION | Genes involved in Cytosolic tRNA aminoacylation |
| 0.0 | 1.0 | REACTOME ACTIVATED NOTCH1 TRANSMITS SIGNAL TO THE NUCLEUS | Genes involved in Activated NOTCH1 Transmits Signal to the Nucleus |
| 0.0 | 0.8 | REACTOME GENERATION OF SECOND MESSENGER MOLECULES | Genes involved in Generation of second messenger molecules |
| 0.0 | 1.3 | REACTOME IL1 SIGNALING | Genes involved in Interleukin-1 signaling |
| 0.0 | 0.4 | REACTOME ACYL CHAIN REMODELLING OF PE | Genes involved in Acyl chain remodelling of PE |
| 0.0 | 0.4 | REACTOME ACTIVATION OF THE AP1 FAMILY OF TRANSCRIPTION FACTORS | Genes involved in Activation of the AP-1 family of transcription factors |
| 0.0 | 0.2 | REACTOME INTERACTIONS OF VPR WITH HOST CELLULAR PROTEINS | Genes involved in Interactions of Vpr with host cellular proteins |
| 0.0 | 0.4 | REACTOME GLUTAMATE NEUROTRANSMITTER RELEASE CYCLE | Genes involved in Glutamate Neurotransmitter Release Cycle |
| 0.0 | 0.4 | REACTOME REGULATION OF AMPK ACTIVITY VIA LKB1 | Genes involved in Regulation of AMPK activity via LKB1 |
| 0.0 | 0.7 | REACTOME THE ROLE OF NEF IN HIV1 REPLICATION AND DISEASE PATHOGENESIS | Genes involved in The role of Nef in HIV-1 replication and disease pathogenesis |
| 0.0 | 0.4 | REACTOME FORMATION OF FIBRIN CLOT CLOTTING CASCADE | Genes involved in Formation of Fibrin Clot (Clotting Cascade) |
| 0.0 | 0.5 | REACTOME INHIBITION OF VOLTAGE GATED CA2 CHANNELS VIA GBETA GAMMA SUBUNITS | Genes involved in Inhibition of voltage gated Ca2+ channels via Gbeta/gamma subunits |