Project
A549 cells infected with SARS-CoV-2 Analysis Results (GEO series: GSE147507)
Navigation
Downloads
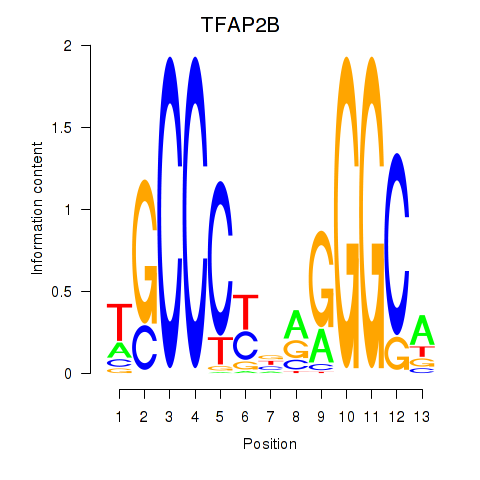
Results for TFAP2B
Z-value: 0.97
Motif logo
Transcription factors associated with TFAP2B
| Gene Symbol | Gene ID | Gene Info |
|---|---|---|
|
TFAP2B
|
ENSG00000008196.8 | transcription factor AP-2 beta |
Activity profile of TFAP2B motif
Sorted Z-values of TFAP2B motif
| Promoter | Log-likelihood | Transcript | Gene | Gene Info |
|---|---|---|---|---|
| chr9_+_108424738 | 0.62 |
ENST00000334077.3
|
TAL2
|
T-cell acute lymphocytic leukemia 2 |
| chr7_-_100065686 | 0.52 |
ENST00000423266.1
ENST00000456330.1 |
TSC22D4
|
TSC22 domain family, member 4 |
| chr17_+_47448102 | 0.52 |
ENST00000576461.1
|
RP11-81K2.1
|
Uncharacterized protein |
| chr2_+_232575168 | 0.52 |
ENST00000440384.1
|
PTMA
|
prothymosin, alpha |
| chr19_-_18717627 | 0.47 |
ENST00000392386.3
|
CRLF1
|
cytokine receptor-like factor 1 |
| chr9_-_34523027 | 0.39 |
ENST00000399775.2
|
ENHO
|
energy homeostasis associated |
| chr4_+_8271471 | 0.37 |
ENST00000307358.2
ENST00000382512.3 |
HTRA3
|
HtrA serine peptidase 3 |
| chr11_+_73000449 | 0.36 |
ENST00000535931.1
|
P2RY6
|
pyrimidinergic receptor P2Y, G-protein coupled, 6 |
| chr19_+_50338234 | 0.35 |
ENST00000593767.1
|
MED25
|
mediator complex subunit 25 |
| chr17_+_27052892 | 0.33 |
ENST00000579671.1
ENST00000579060.1 |
NEK8
|
NIMA-related kinase 8 |
| chr11_+_63974135 | 0.33 |
ENST00000544997.1
ENST00000345728.5 ENST00000279227.5 |
FERMT3
|
fermitin family member 3 |
| chr11_+_62379194 | 0.33 |
ENST00000525801.1
ENST00000534093.1 |
ROM1
|
retinal outer segment membrane protein 1 |
| chr15_+_23810853 | 0.33 |
ENST00000568252.1
|
MKRN3
|
makorin ring finger protein 3 |
| chr17_-_17399701 | 0.30 |
ENST00000225688.3
ENST00000579152.1 |
RASD1
|
RAS, dexamethasone-induced 1 |
| chrX_-_154033686 | 0.30 |
ENST00000453245.1
ENST00000428488.1 ENST00000369531.1 |
MPP1
|
membrane protein, palmitoylated 1, 55kDa |
| chr1_+_46269248 | 0.29 |
ENST00000361297.2
ENST00000372009.2 |
MAST2
|
microtubule associated serine/threonine kinase 2 |
| chr2_+_74741569 | 0.29 |
ENST00000233638.7
|
TLX2
|
T-cell leukemia homeobox 2 |
| chr6_+_30294186 | 0.29 |
ENST00000458516.1
|
TRIM39
|
tripartite motif containing 39 |
| chr7_-_86849836 | 0.28 |
ENST00000455575.1
|
TMEM243
|
transmembrane protein 243, mitochondrial |
| chr1_-_21948906 | 0.28 |
ENST00000374761.2
ENST00000599760.1 |
RAP1GAP
|
RAP1 GTPase activating protein |
| chrX_+_53449805 | 0.28 |
ENST00000414955.2
|
RIBC1
|
RIB43A domain with coiled-coils 1 |
| chr6_+_43139037 | 0.28 |
ENST00000265354.4
|
SRF
|
serum response factor (c-fos serum response element-binding transcription factor) |
| chr1_+_160370344 | 0.27 |
ENST00000368061.2
|
VANGL2
|
VANGL planar cell polarity protein 2 |
| chr12_-_89746264 | 0.27 |
ENST00000548755.1
|
DUSP6
|
dual specificity phosphatase 6 |
| chr13_-_107187462 | 0.27 |
ENST00000245323.4
|
EFNB2
|
ephrin-B2 |
| chr19_-_42724261 | 0.25 |
ENST00000595337.1
|
DEDD2
|
death effector domain containing 2 |
| chr5_+_148521046 | 0.25 |
ENST00000326685.7
ENST00000356541.3 ENST00000309868.7 |
ABLIM3
|
actin binding LIM protein family, member 3 |
| chr5_+_177540444 | 0.25 |
ENST00000274605.5
|
N4BP3
|
NEDD4 binding protein 3 |
| chr19_+_10541462 | 0.25 |
ENST00000293683.5
|
PDE4A
|
phosphodiesterase 4A, cAMP-specific |
| chr4_+_1723197 | 0.25 |
ENST00000485989.2
ENST00000313288.4 |
TACC3
|
transforming, acidic coiled-coil containing protein 3 |
| chr16_+_24857309 | 0.25 |
ENST00000565769.1
ENST00000449109.2 ENST00000424767.2 ENST00000545376.1 ENST00000569520.1 |
SLC5A11
|
solute carrier family 5 (sodium/inositol cotransporter), member 11 |
| chr3_+_158450143 | 0.24 |
ENST00000491804.1
|
MFSD1
|
major facilitator superfamily domain containing 1 |
| chr19_+_1354930 | 0.24 |
ENST00000591337.1
|
MUM1
|
melanoma associated antigen (mutated) 1 |
| chr11_-_64660916 | 0.24 |
ENST00000413053.1
|
MIR194-2
|
microRNA 194-2 |
| chr17_+_36508826 | 0.24 |
ENST00000580660.1
|
SOCS7
|
suppressor of cytokine signaling 7 |
| chr16_-_88772761 | 0.24 |
ENST00000567844.1
ENST00000312838.4 |
RNF166
|
ring finger protein 166 |
| chr9_-_131534188 | 0.23 |
ENST00000414921.1
|
ZER1
|
zyg-11 related, cell cycle regulator |
| chr17_-_17726907 | 0.23 |
ENST00000423161.3
|
SREBF1
|
sterol regulatory element binding transcription factor 1 |
| chr6_-_35888858 | 0.23 |
ENST00000507909.1
|
SRPK1
|
SRSF protein kinase 1 |
| chr17_+_12692774 | 0.23 |
ENST00000379672.5
ENST00000340825.3 |
ARHGAP44
|
Rho GTPase activating protein 44 |
| chr6_-_34664612 | 0.23 |
ENST00000374023.3
ENST00000374026.3 |
C6orf106
|
chromosome 6 open reading frame 106 |
| chr1_+_154377669 | 0.22 |
ENST00000368485.3
ENST00000344086.4 |
IL6R
|
interleukin 6 receptor |
| chr19_+_38397839 | 0.22 |
ENST00000222345.6
|
SIPA1L3
|
signal-induced proliferation-associated 1 like 3 |
| chr10_-_135238076 | 0.22 |
ENST00000414069.2
|
SPRN
|
shadow of prion protein homolog (zebrafish) |
| chr16_+_57126428 | 0.22 |
ENST00000290776.8
|
CPNE2
|
copine II |
| chr20_+_44746939 | 0.22 |
ENST00000372276.3
|
CD40
|
CD40 molecule, TNF receptor superfamily member 5 |
| chr4_-_190948409 | 0.22 |
ENST00000504750.1
ENST00000378763.1 |
FRG2
|
FSHD region gene 2 |
| chrX_+_53449887 | 0.22 |
ENST00000375327.3
|
RIBC1
|
RIB43A domain with coiled-coils 1 |
| chr22_+_31199037 | 0.22 |
ENST00000424224.1
|
OSBP2
|
oxysterol binding protein 2 |
| chr22_-_39639021 | 0.22 |
ENST00000455790.1
|
PDGFB
|
platelet-derived growth factor beta polypeptide |
| chr17_-_8093471 | 0.22 |
ENST00000389017.4
|
C17orf59
|
chromosome 17 open reading frame 59 |
| chr17_-_48133054 | 0.21 |
ENST00000499842.1
|
RP11-1094H24.4
|
RP11-1094H24.4 |
| chr16_+_24857552 | 0.21 |
ENST00000568579.1
ENST00000567758.1 ENST00000569071.1 ENST00000539472.1 |
SLC5A11
|
solute carrier family 5 (sodium/inositol cotransporter), member 11 |
| chr19_-_1650666 | 0.21 |
ENST00000588136.1
|
TCF3
|
transcription factor 3 |
| chr2_-_135476552 | 0.21 |
ENST00000281924.6
|
TMEM163
|
transmembrane protein 163 |
| chr11_+_64002292 | 0.21 |
ENST00000426086.2
|
VEGFB
|
vascular endothelial growth factor B |
| chr5_-_176730733 | 0.21 |
ENST00000504395.1
|
RAB24
|
RAB24, member RAS oncogene family |
| chr11_+_64001962 | 0.21 |
ENST00000309422.2
|
VEGFB
|
vascular endothelial growth factor B |
| chr17_+_79953310 | 0.21 |
ENST00000582355.2
|
ASPSCR1
|
alveolar soft part sarcoma chromosome region, candidate 1 |
| chr16_-_31085514 | 0.21 |
ENST00000300849.4
|
ZNF668
|
zinc finger protein 668 |
| chr12_+_53693466 | 0.20 |
ENST00000267103.5
ENST00000548632.1 |
C12orf10
|
chromosome 12 open reading frame 10 |
| chrX_+_53449839 | 0.20 |
ENST00000457095.1
|
RIBC1
|
RIB43A domain with coiled-coils 1 |
| chr12_+_49212261 | 0.20 |
ENST00000547818.1
ENST00000547392.1 |
CACNB3
|
calcium channel, voltage-dependent, beta 3 subunit |
| chr1_-_1677358 | 0.20 |
ENST00000355439.2
ENST00000400924.1 ENST00000246421.4 |
SLC35E2
|
solute carrier family 35, member E2 |
| chr20_+_60174827 | 0.20 |
ENST00000543233.1
|
CDH4
|
cadherin 4, type 1, R-cadherin (retinal) |
| chr8_-_143867946 | 0.20 |
ENST00000301263.4
|
LY6D
|
lymphocyte antigen 6 complex, locus D |
| chr14_+_23340822 | 0.20 |
ENST00000359591.4
|
LRP10
|
low density lipoprotein receptor-related protein 10 |
| chr19_+_19144384 | 0.20 |
ENST00000392335.2
ENST00000535612.1 ENST00000537263.1 ENST00000540707.1 ENST00000541725.1 ENST00000269932.6 ENST00000546344.1 ENST00000540792.1 ENST00000536098.1 ENST00000541898.1 ENST00000543877.1 |
ARMC6
|
armadillo repeat containing 6 |
| chr12_+_110011571 | 0.19 |
ENST00000539696.1
ENST00000228510.3 ENST00000392727.3 |
MVK
|
mevalonate kinase |
| chr17_+_12693001 | 0.19 |
ENST00000262444.9
|
ARHGAP44
|
Rho GTPase activating protein 44 |
| chr3_-_183145765 | 0.19 |
ENST00000473233.1
|
MCF2L2
|
MCF.2 cell line derived transforming sequence-like 2 |
| chr1_+_155006300 | 0.19 |
ENST00000295542.1
ENST00000392480.1 ENST00000423025.2 ENST00000368419.2 |
DCST1
|
DC-STAMP domain containing 1 |
| chr19_-_19144243 | 0.19 |
ENST00000594445.1
ENST00000452918.2 ENST00000600377.1 ENST00000337018.6 |
SUGP2
|
SURP and G patch domain containing 2 |
| chr1_+_45792541 | 0.19 |
ENST00000334815.3
|
HPDL
|
4-hydroxyphenylpyruvate dioxygenase-like |
| chr16_+_30907927 | 0.19 |
ENST00000279804.2
ENST00000395019.3 |
CTF1
|
cardiotrophin 1 |
| chr5_-_176981417 | 0.19 |
ENST00000514747.1
ENST00000443375.2 ENST00000329540.5 |
FAM193B
|
family with sequence similarity 193, member B |
| chr19_+_14544099 | 0.19 |
ENST00000242783.6
ENST00000586557.1 ENST00000590097.1 |
PKN1
|
protein kinase N1 |
| chr9_+_116917807 | 0.19 |
ENST00000356083.3
|
COL27A1
|
collagen, type XXVII, alpha 1 |
| chr19_-_19774473 | 0.18 |
ENST00000357324.6
|
ATP13A1
|
ATPase type 13A1 |
| chr2_-_220408430 | 0.18 |
ENST00000243776.6
|
CHPF
|
chondroitin polymerizing factor |
| chr6_+_43112037 | 0.18 |
ENST00000473339.1
|
PTK7
|
protein tyrosine kinase 7 |
| chr1_-_156399184 | 0.18 |
ENST00000368243.1
ENST00000357975.4 ENST00000310027.5 ENST00000400991.2 |
C1orf61
|
chromosome 1 open reading frame 61 |
| chr3_-_10052849 | 0.18 |
ENST00000437616.1
ENST00000429065.2 |
AC022007.5
|
AC022007.5 |
| chr8_+_22462532 | 0.18 |
ENST00000389279.3
|
CCAR2
|
cell cycle and apoptosis regulator 2 |
| chr7_-_27213893 | 0.18 |
ENST00000283921.4
|
HOXA10
|
homeobox A10 |
| chr19_-_39832563 | 0.18 |
ENST00000599274.1
|
CTC-246B18.10
|
CTC-246B18.10 |
| chr19_+_13229126 | 0.18 |
ENST00000292431.4
|
NACC1
|
nucleus accumbens associated 1, BEN and BTB (POZ) domain containing |
| chr12_+_6493406 | 0.18 |
ENST00000543190.1
|
LTBR
|
lymphotoxin beta receptor (TNFR superfamily, member 3) |
| chr20_-_49639631 | 0.17 |
ENST00000424171.1
ENST00000439216.1 ENST00000371571.4 |
KCNG1
|
potassium voltage-gated channel, subfamily G, member 1 |
| chr17_-_41856305 | 0.17 |
ENST00000397937.2
ENST00000226004.3 |
DUSP3
|
dual specificity phosphatase 3 |
| chr21_+_44394742 | 0.17 |
ENST00000432907.2
|
PKNOX1
|
PBX/knotted 1 homeobox 1 |
| chr6_+_33378738 | 0.17 |
ENST00000374512.3
ENST00000374516.3 |
PHF1
|
PHD finger protein 1 |
| chr2_-_128408105 | 0.17 |
ENST00000409254.1
|
LIMS2
|
LIM and senescent cell antigen-like domains 2 |
| chr22_+_50781723 | 0.17 |
ENST00000359139.3
ENST00000395741.3 ENST00000395744.3 |
PPP6R2
|
protein phosphatase 6, regulatory subunit 2 |
| chr3_+_138068051 | 0.17 |
ENST00000474559.1
|
MRAS
|
muscle RAS oncogene homolog |
| chr17_+_4901199 | 0.17 |
ENST00000320785.5
ENST00000574165.1 |
KIF1C
|
kinesin family member 1C |
| chr8_+_22462145 | 0.17 |
ENST00000308511.4
ENST00000523801.1 ENST00000521301.1 |
CCAR2
|
cell cycle and apoptosis regulator 2 |
| chr16_+_57126482 | 0.17 |
ENST00000537605.1
ENST00000535318.2 |
CPNE2
|
copine II |
| chr16_-_66959429 | 0.17 |
ENST00000420652.1
ENST00000299759.6 |
RRAD
|
Ras-related associated with diabetes |
| chr7_-_150864635 | 0.17 |
ENST00000297537.4
|
GBX1
|
gastrulation brain homeobox 1 |
| chr14_+_65171099 | 0.17 |
ENST00000247226.7
|
PLEKHG3
|
pleckstrin homology domain containing, family G (with RhoGef domain) member 3 |
| chr6_-_30654977 | 0.17 |
ENST00000399199.3
|
PPP1R18
|
protein phosphatase 1, regulatory subunit 18 |
| chr17_-_72869086 | 0.16 |
ENST00000581530.1
ENST00000420580.2 ENST00000455107.2 ENST00000413947.2 ENST00000581219.1 ENST00000582944.1 |
FDXR
|
ferredoxin reductase |
| chr12_+_49212514 | 0.16 |
ENST00000301050.2
ENST00000548279.1 ENST00000547230.1 |
CACNB3
|
calcium channel, voltage-dependent, beta 3 subunit |
| chr17_-_72869140 | 0.16 |
ENST00000583917.1
ENST00000293195.5 ENST00000442102.2 |
FDXR
|
ferredoxin reductase |
| chr16_+_88772866 | 0.16 |
ENST00000453996.2
ENST00000312060.5 ENST00000378384.3 ENST00000567949.1 ENST00000564921.1 |
CTU2
|
cytosolic thiouridylase subunit 2 homolog (S. pombe) |
| chr17_-_4463856 | 0.16 |
ENST00000574584.1
ENST00000381550.3 ENST00000301395.3 |
GGT6
|
gamma-glutamyltransferase 6 |
| chr22_-_51017084 | 0.16 |
ENST00000360719.2
ENST00000457250.1 ENST00000440709.1 |
CPT1B
|
carnitine palmitoyltransferase 1B (muscle) |
| chr16_+_67465016 | 0.16 |
ENST00000326152.5
|
HSD11B2
|
hydroxysteroid (11-beta) dehydrogenase 2 |
| chr2_-_191399073 | 0.16 |
ENST00000421038.1
|
TMEM194B
|
transmembrane protein 194B |
| chr11_+_10326612 | 0.16 |
ENST00000534464.1
ENST00000530439.1 ENST00000524948.1 ENST00000528655.1 ENST00000526492.1 ENST00000525063.1 |
ADM
|
adrenomedullin |
| chr1_-_44497118 | 0.16 |
ENST00000537678.1
ENST00000466926.1 |
SLC6A9
|
solute carrier family 6 (neurotransmitter transporter, glycine), member 9 |
| chr19_-_37329254 | 0.16 |
ENST00000356725.4
|
ZNF790
|
zinc finger protein 790 |
| chr5_+_148521136 | 0.16 |
ENST00000506113.1
|
ABLIM3
|
actin binding LIM protein family, member 3 |
| chr16_-_67970990 | 0.16 |
ENST00000358514.4
|
PSMB10
|
proteasome (prosome, macropain) subunit, beta type, 10 |
| chr8_+_21906433 | 0.16 |
ENST00000522148.1
|
DMTN
|
dematin actin binding protein |
| chr1_-_25291475 | 0.16 |
ENST00000338888.3
ENST00000399916.1 |
RUNX3
|
runt-related transcription factor 3 |
| chr14_+_65171315 | 0.16 |
ENST00000394691.1
|
PLEKHG3
|
pleckstrin homology domain containing, family G (with RhoGef domain) member 3 |
| chr17_+_1627834 | 0.16 |
ENST00000419248.1
ENST00000418841.1 |
WDR81
|
WD repeat domain 81 |
| chr14_-_94254821 | 0.16 |
ENST00000393140.1
|
PRIMA1
|
proline rich membrane anchor 1 |
| chr12_-_123380610 | 0.16 |
ENST00000535765.1
|
VPS37B
|
vacuolar protein sorting 37 homolog B (S. cerevisiae) |
| chr19_+_42724423 | 0.16 |
ENST00000301215.3
ENST00000597945.1 |
ZNF526
|
zinc finger protein 526 |
| chr16_+_30960375 | 0.16 |
ENST00000318663.4
ENST00000566237.1 ENST00000562699.1 |
ORAI3
|
ORAI calcium release-activated calcium modulator 3 |
| chr5_+_148521381 | 0.16 |
ENST00000504238.1
|
ABLIM3
|
actin binding LIM protein family, member 3 |
| chr15_+_85144217 | 0.16 |
ENST00000540936.1
ENST00000448803.2 ENST00000546275.1 ENST00000546148.1 ENST00000442073.3 ENST00000334141.3 ENST00000358472.3 ENST00000502939.2 ENST00000379358.3 ENST00000327179.6 |
ZSCAN2
|
zinc finger and SCAN domain containing 2 |
| chr12_+_6493319 | 0.15 |
ENST00000536876.1
|
LTBR
|
lymphotoxin beta receptor (TNFR superfamily, member 3) |
| chr5_-_176730676 | 0.15 |
ENST00000393611.2
ENST00000303251.6 ENST00000303270.6 |
RAB24
|
RAB24, member RAS oncogene family |
| chr5_+_149737202 | 0.15 |
ENST00000451292.1
ENST00000377797.3 ENST00000445265.2 ENST00000323668.7 ENST00000439160.2 ENST00000394269.3 ENST00000427724.2 ENST00000504761.2 ENST00000513346.1 ENST00000515516.1 |
TCOF1
|
Treacher Collins-Franceschetti syndrome 1 |
| chr17_+_4613918 | 0.15 |
ENST00000574954.1
ENST00000346341.2 ENST00000572457.1 ENST00000381488.6 ENST00000412477.3 ENST00000571428.1 ENST00000575877.1 |
ARRB2
|
arrestin, beta 2 |
| chr1_+_221054584 | 0.15 |
ENST00000549319.1
|
HLX
|
H2.0-like homeobox |
| chr5_-_157002775 | 0.15 |
ENST00000257527.4
|
ADAM19
|
ADAM metallopeptidase domain 19 |
| chr21_+_17566643 | 0.15 |
ENST00000419952.1
ENST00000445461.2 |
LINC00478
|
long intergenic non-protein coding RNA 478 |
| chr9_-_131534160 | 0.15 |
ENST00000291900.2
|
ZER1
|
zyg-11 related, cell cycle regulator |
| chr5_+_149980622 | 0.15 |
ENST00000394243.1
|
SYNPO
|
synaptopodin |
| chr11_+_65082289 | 0.15 |
ENST00000279249.2
|
CDC42EP2
|
CDC42 effector protein (Rho GTPase binding) 2 |
| chr22_-_29663690 | 0.15 |
ENST00000406335.1
|
RHBDD3
|
rhomboid domain containing 3 |
| chr19_-_16738984 | 0.15 |
ENST00000600060.1
ENST00000263390.3 |
MED26
|
mediator complex subunit 26 |
| chr8_+_38758845 | 0.15 |
ENST00000519640.1
|
PLEKHA2
|
pleckstrin homology domain containing, family A (phosphoinositide binding specific) member 2 |
| chr17_-_78450398 | 0.15 |
ENST00000306773.4
|
NPTX1
|
neuronal pentraxin I |
| chr7_-_25219667 | 0.15 |
ENST00000444434.1
|
C7orf31
|
chromosome 7 open reading frame 31 |
| chr11_+_117198545 | 0.14 |
ENST00000533153.1
ENST00000278935.3 ENST00000525416.1 |
CEP164
|
centrosomal protein 164kDa |
| chr20_-_44937124 | 0.14 |
ENST00000537909.1
|
CDH22
|
cadherin 22, type 2 |
| chr16_+_30772913 | 0.14 |
ENST00000563909.1
|
RNF40
|
ring finger protein 40, E3 ubiquitin protein ligase |
| chr14_+_102786063 | 0.14 |
ENST00000442396.2
ENST00000262236.5 |
ZNF839
|
zinc finger protein 839 |
| chr22_-_36424458 | 0.14 |
ENST00000438146.2
|
RBFOX2
|
RNA binding protein, fox-1 homolog (C. elegans) 2 |
| chr19_+_37742773 | 0.14 |
ENST00000438770.2
ENST00000591116.1 ENST00000592712.1 |
AC012309.5
|
AC012309.5 |
| chr1_+_221054411 | 0.14 |
ENST00000427693.1
|
HLX
|
H2.0-like homeobox |
| chr3_+_75713481 | 0.14 |
ENST00000308062.3
ENST00000464571.1 |
FRG2C
|
FSHD region gene 2 family, member C |
| chr3_+_39424828 | 0.14 |
ENST00000273158.4
ENST00000431510.1 |
SLC25A38
|
solute carrier family 25, member 38 |
| chr17_+_46985823 | 0.14 |
ENST00000508468.2
|
UBE2Z
|
ubiquitin-conjugating enzyme E2Z |
| chr5_+_172068232 | 0.14 |
ENST00000520919.1
ENST00000522853.1 ENST00000369800.5 |
NEURL1B
|
neuralized E3 ubiquitin protein ligase 1B |
| chr19_+_42387228 | 0.14 |
ENST00000354532.3
ENST00000599846.1 ENST00000347545.4 |
ARHGEF1
|
Rho guanine nucleotide exchange factor (GEF) 1 |
| chr1_-_11741155 | 0.14 |
ENST00000445656.1
ENST00000376669.5 ENST00000456915.1 ENST00000376692.4 |
MAD2L2
|
MAD2 mitotic arrest deficient-like 2 (yeast) |
| chr20_-_56285595 | 0.14 |
ENST00000395816.3
ENST00000347215.4 |
PMEPA1
|
prostate transmembrane protein, androgen induced 1 |
| chr3_-_50360165 | 0.14 |
ENST00000428028.1
|
HYAL2
|
hyaluronoglucosaminidase 2 |
| chr14_+_24458123 | 0.14 |
ENST00000545240.1
ENST00000382755.4 |
DHRS4L2
|
dehydrogenase/reductase (SDR family) member 4 like 2 |
| chr19_+_7459998 | 0.14 |
ENST00000319670.9
ENST00000599752.1 |
ARHGEF18
|
Rho/Rac guanine nucleotide exchange factor (GEF) 18 |
| chr17_-_36906058 | 0.14 |
ENST00000580830.1
|
PCGF2
|
polycomb group ring finger 2 |
| chr1_-_23886285 | 0.14 |
ENST00000374561.5
|
ID3
|
inhibitor of DNA binding 3, dominant negative helix-loop-helix protein |
| chr6_-_31763276 | 0.14 |
ENST00000440048.1
|
VARS
|
valyl-tRNA synthetase |
| chr22_-_31742218 | 0.14 |
ENST00000266269.5
ENST00000405309.3 ENST00000351933.4 |
PATZ1
|
POZ (BTB) and AT hook containing zinc finger 1 |
| chr16_-_30381580 | 0.14 |
ENST00000409939.3
|
TBC1D10B
|
TBC1 domain family, member 10B |
| chr17_-_42767092 | 0.14 |
ENST00000588687.1
|
CCDC43
|
coiled-coil domain containing 43 |
| chr17_-_73874654 | 0.14 |
ENST00000254816.2
|
TRIM47
|
tripartite motif containing 47 |
| chr14_+_23341513 | 0.14 |
ENST00000546834.1
|
LRP10
|
low density lipoprotein receptor-related protein 10 |
| chr1_+_9299895 | 0.14 |
ENST00000602477.1
|
H6PD
|
hexose-6-phosphate dehydrogenase (glucose 1-dehydrogenase) |
| chr2_-_43453734 | 0.13 |
ENST00000282388.3
|
ZFP36L2
|
ZFP36 ring finger protein-like 2 |
| chr8_-_8751068 | 0.13 |
ENST00000276282.6
|
MFHAS1
|
malignant fibrous histiocytoma amplified sequence 1 |
| chr17_+_36858694 | 0.13 |
ENST00000563897.1
|
CTB-58E17.1
|
CTB-58E17.1 |
| chr8_-_145018905 | 0.13 |
ENST00000398774.2
|
PLEC
|
plectin |
| chr5_+_148521454 | 0.13 |
ENST00000508983.1
|
ABLIM3
|
actin binding LIM protein family, member 3 |
| chr10_+_103825080 | 0.13 |
ENST00000299238.5
|
HPS6
|
Hermansky-Pudlak syndrome 6 |
| chr16_-_28503080 | 0.13 |
ENST00000565316.1
ENST00000565778.1 ENST00000357857.9 ENST00000568558.1 ENST00000357806.7 |
CLN3
|
ceroid-lipofuscinosis, neuronal 3 |
| chr1_+_26437631 | 0.13 |
ENST00000444713.1
|
PDIK1L
|
PDLIM1 interacting kinase 1 like |
| chr1_-_40782938 | 0.13 |
ENST00000372736.3
ENST00000372748.3 |
COL9A2
|
collagen, type IX, alpha 2 |
| chr18_-_21242833 | 0.13 |
ENST00000586087.1
ENST00000592179.1 |
ANKRD29
|
ankyrin repeat domain 29 |
| chr13_+_52158610 | 0.13 |
ENST00000298125.5
|
WDFY2
|
WD repeat and FYVE domain containing 2 |
| chr22_+_31892373 | 0.13 |
ENST00000443011.1
ENST00000400289.1 ENST00000444859.1 ENST00000400288.2 |
SFI1
|
Sfi1 homolog, spindle assembly associated (yeast) |
| chr20_+_44746885 | 0.13 |
ENST00000372285.3
|
CD40
|
CD40 molecule, TNF receptor superfamily member 5 |
| chr5_+_176730769 | 0.13 |
ENST00000303204.4
ENST00000503216.1 |
PRELID1
|
PRELI domain containing 1 |
| chr6_+_33378517 | 0.13 |
ENST00000428274.1
|
PHF1
|
PHD finger protein 1 |
| chr5_+_141016969 | 0.13 |
ENST00000518856.1
|
RELL2
|
RELT-like 2 |
| chr4_-_2010562 | 0.13 |
ENST00000411649.1
ENST00000542778.1 ENST00000411638.2 ENST00000431323.1 |
NELFA
|
negative elongation factor complex member A |
| chr8_-_21988558 | 0.13 |
ENST00000312841.8
|
HR
|
hair growth associated |
| chr1_+_156084461 | 0.13 |
ENST00000347559.2
ENST00000361308.4 ENST00000368300.4 ENST00000368299.3 |
LMNA
|
lamin A/C |
| chr22_-_38484922 | 0.13 |
ENST00000428572.1
|
BAIAP2L2
|
BAI1-associated protein 2-like 2 |
| chr7_+_101460882 | 0.13 |
ENST00000292535.7
ENST00000549414.2 ENST00000550008.2 ENST00000546411.2 ENST00000556210.1 |
CUX1
|
cut-like homeobox 1 |
| chr11_-_6502534 | 0.13 |
ENST00000254584.2
ENST00000525235.1 ENST00000445086.2 |
ARFIP2
|
ADP-ribosylation factor interacting protein 2 |
| chr7_+_75932863 | 0.13 |
ENST00000429938.1
|
HSPB1
|
heat shock 27kDa protein 1 |
| chr14_+_102430855 | 0.13 |
ENST00000360184.4
|
DYNC1H1
|
dynein, cytoplasmic 1, heavy chain 1 |
| chr17_+_18163848 | 0.13 |
ENST00000323019.4
ENST00000578174.1 ENST00000395704.4 ENST00000395703.4 ENST00000578621.1 ENST00000579341.1 |
MIEF2
|
mitochondrial elongation factor 2 |
| chr10_+_104154229 | 0.13 |
ENST00000428099.1
ENST00000369966.3 |
NFKB2
|
nuclear factor of kappa light polypeptide gene enhancer in B-cells 2 (p49/p100) |
| chr16_+_2255841 | 0.12 |
ENST00000301725.7
|
MLST8
|
MTOR associated protein, LST8 homolog (S. cerevisiae) |
| chr12_-_52585765 | 0.12 |
ENST00000313234.5
ENST00000394815.2 |
KRT80
|
keratin 80 |
| chr15_+_96873921 | 0.12 |
ENST00000394166.3
|
NR2F2
|
nuclear receptor subfamily 2, group F, member 2 |
| chr8_-_144655141 | 0.12 |
ENST00000398882.3
|
MROH6
|
maestro heat-like repeat family member 6 |
| chr22_-_46933067 | 0.12 |
ENST00000262738.3
ENST00000395964.1 |
CELSR1
|
cadherin, EGF LAG seven-pass G-type receptor 1 |
| chr8_+_142138711 | 0.12 |
ENST00000518347.1
ENST00000262585.2 ENST00000424248.1 ENST00000519811.1 ENST00000520986.1 ENST00000523058.1 |
DENND3
|
DENN/MADD domain containing 3 |
| chr1_+_11994715 | 0.12 |
ENST00000449038.1
ENST00000376369.3 ENST00000429000.2 ENST00000196061.4 |
PLOD1
|
procollagen-lysine, 2-oxoglutarate 5-dioxygenase 1 |
| chr2_-_132249955 | 0.12 |
ENST00000309451.6
|
MZT2A
|
mitotic spindle organizing protein 2A |
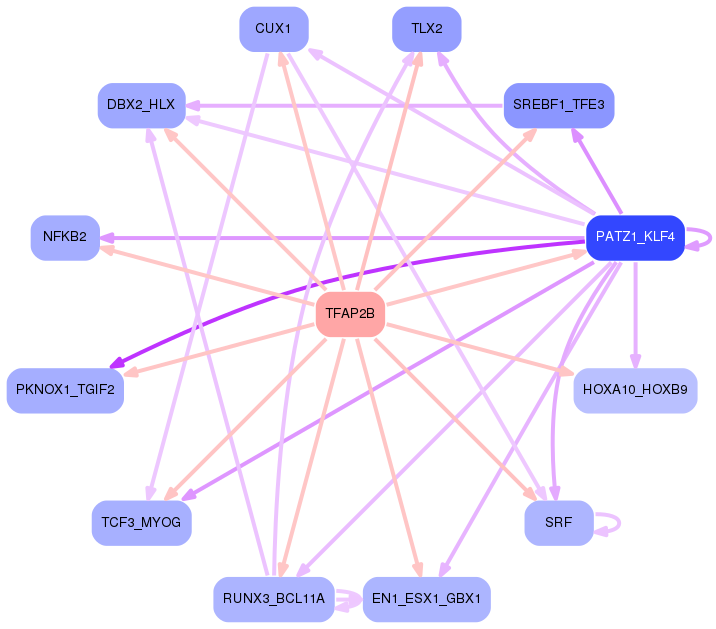
Network of associatons between targets according to the STRING database.

First level regulatory network of TFAP2B
Gene Ontology Analysis
Gene overrepresentation in biological_process category:
| Log-likelihood per target | Total log-likelihood | Term | Description |
|---|---|---|---|
| 0.1 | 0.4 | GO:0060489 | orthogonal dichotomous subdivision of terminal units involved in lung branching morphogenesis(GO:0060488) planar dichotomous subdivision of terminal units involved in lung branching morphogenesis(GO:0060489) lateral sprouting involved in lung morphogenesis(GO:0060490) |
| 0.1 | 0.6 | GO:0098886 | modification of dendritic spine(GO:0098886) |
| 0.1 | 0.5 | GO:2000672 | negative regulation of motor neuron apoptotic process(GO:2000672) |
| 0.1 | 0.3 | GO:1903697 | negative regulation of microvillus assembly(GO:1903697) |
| 0.1 | 0.3 | GO:0060532 | bronchus cartilage development(GO:0060532) lung smooth muscle development(GO:0061145) |
| 0.1 | 0.3 | GO:0061537 | glycine secretion(GO:0061536) glycine secretion, neurotransmission(GO:0061537) |
| 0.1 | 0.3 | GO:2001178 | mediator complex assembly(GO:0036034) regulation of mediator complex assembly(GO:2001176) positive regulation of mediator complex assembly(GO:2001178) |
| 0.1 | 0.2 | GO:1903526 | negative regulation of membrane tubulation(GO:1903526) |
| 0.1 | 0.5 | GO:0015798 | myo-inositol transport(GO:0015798) |
| 0.1 | 0.2 | GO:0019287 | isopentenyl diphosphate biosynthetic process, mevalonate pathway(GO:0019287) |
| 0.1 | 0.3 | GO:0042663 | regulation of endodermal cell fate specification(GO:0042663) |
| 0.1 | 0.2 | GO:0046586 | regulation of calcium-dependent cell-cell adhesion(GO:0046586) |
| 0.1 | 0.5 | GO:0070236 | regulation of activation-induced cell death of T cells(GO:0070235) negative regulation of activation-induced cell death of T cells(GO:0070236) |
| 0.1 | 0.2 | GO:1901842 | negative regulation of high voltage-gated calcium channel activity(GO:1901842) |
| 0.1 | 0.2 | GO:0090677 | metanephric glomerular mesangial cell development(GO:0072255) reversible differentiation(GO:0090677) cell dedifferentiation involved in phenotypic switching(GO:0090678) positive regulation of phenotypic switching(GO:1900241) regulation of vascular smooth muscle cell dedifferentiation(GO:1905174) positive regulation of vascular smooth muscle cell dedifferentiation(GO:1905176) vascular smooth muscle cell dedifferentiation(GO:1990936) |
| 0.1 | 0.2 | GO:1903774 | positive regulation of viral budding via host ESCRT complex(GO:1903774) |
| 0.0 | 0.6 | GO:0048484 | enteric nervous system development(GO:0048484) |
| 0.0 | 0.3 | GO:0033632 | regulation of cell-cell adhesion mediated by integrin(GO:0033632) |
| 0.0 | 0.4 | GO:0060754 | positive regulation of mast cell chemotaxis(GO:0060754) |
| 0.0 | 0.1 | GO:0019732 | antifungal humoral response(GO:0019732) |
| 0.0 | 0.3 | GO:0033590 | response to cobalamin(GO:0033590) response to erythropoietin(GO:0036017) cellular response to erythropoietin(GO:0036018) |
| 0.0 | 0.3 | GO:0033277 | abortive mitotic cell cycle(GO:0033277) |
| 0.0 | 0.3 | GO:0061086 | negative regulation of histone H3-K27 methylation(GO:0061086) |
| 0.0 | 0.2 | GO:0072312 | metanephric glomerular epithelium development(GO:0072244) metanephric glomerular visceral epithelial cell differentiation(GO:0072248) metanephric glomerular visceral epithelial cell development(GO:0072249) metanephric glomerular epithelial cell differentiation(GO:0072312) metanephric glomerular epithelial cell development(GO:0072313) |
| 0.0 | 0.2 | GO:0002143 | tRNA wobble position uridine thiolation(GO:0002143) |
| 0.0 | 0.1 | GO:0014707 | branchiomeric skeletal muscle development(GO:0014707) |
| 0.0 | 0.2 | GO:0019087 | transformation of host cell by virus(GO:0019087) renal water absorption(GO:0070295) |
| 0.0 | 0.7 | GO:0021794 | thalamus development(GO:0021794) |
| 0.0 | 0.2 | GO:0006540 | glutamate decarboxylation to succinate(GO:0006540) |
| 0.0 | 0.1 | GO:0002384 | hepatic immune response(GO:0002384) |
| 0.0 | 0.2 | GO:0019230 | proprioception(GO:0019230) |
| 0.0 | 0.1 | GO:0035752 | lysosomal lumen pH elevation(GO:0035752) |
| 0.0 | 0.1 | GO:0090370 | negative regulation of cholesterol efflux(GO:0090370) |
| 0.0 | 0.1 | GO:0071879 | UDP-glucose catabolic process(GO:0006258) positive regulation of adrenergic receptor signaling pathway(GO:0071879) |
| 0.0 | 0.1 | GO:0099640 | axo-dendritic protein transport(GO:0099640) |
| 0.0 | 0.1 | GO:0009956 | radial pattern formation(GO:0009956) |
| 0.0 | 0.1 | GO:0046947 | hydroxylysine metabolic process(GO:0046946) hydroxylysine biosynthetic process(GO:0046947) |
| 0.0 | 0.2 | GO:0035407 | histone H3-T11 phosphorylation(GO:0035407) |
| 0.0 | 0.2 | GO:0002032 | desensitization of G-protein coupled receptor protein signaling pathway by arrestin(GO:0002032) |
| 0.0 | 0.3 | GO:0045075 | interleukin-12 biosynthetic process(GO:0042090) regulation of interleukin-12 biosynthetic process(GO:0045075) |
| 0.0 | 0.1 | GO:0060139 | positive regulation by symbiont of host apoptotic process(GO:0052151) positive regulation of apoptotic process by virus(GO:0060139) |
| 0.0 | 0.1 | GO:1903377 | negative regulation of oxidative stress-induced neuron intrinsic apoptotic signaling pathway(GO:1903377) |
| 0.0 | 0.3 | GO:0070560 | protein secretion by platelet(GO:0070560) |
| 0.0 | 0.1 | GO:0070086 | ubiquitin-dependent endocytosis(GO:0070086) |
| 0.0 | 0.1 | GO:0003335 | corneocyte development(GO:0003335) |
| 0.0 | 0.4 | GO:0021942 | radial glia guided migration of Purkinje cell(GO:0021942) |
| 0.0 | 0.1 | GO:0034059 | response to anoxia(GO:0034059) |
| 0.0 | 0.2 | GO:0048861 | leukemia inhibitory factor signaling pathway(GO:0048861) |
| 0.0 | 0.2 | GO:0000720 | pyrimidine dimer repair by nucleotide-excision repair(GO:0000720) |
| 0.0 | 0.2 | GO:0002326 | B cell lineage commitment(GO:0002326) immunoglobulin V(D)J recombination(GO:0033152) |
| 0.0 | 0.2 | GO:0003431 | growth plate cartilage chondrocyte development(GO:0003431) |
| 0.0 | 0.1 | GO:0035105 | sterol regulatory element binding protein import into nucleus(GO:0035105) |
| 0.0 | 0.1 | GO:0072356 | chromosome passenger complex localization to kinetochore(GO:0072356) |
| 0.0 | 0.2 | GO:0003084 | positive regulation of systemic arterial blood pressure(GO:0003084) |
| 0.0 | 0.1 | GO:0002725 | negative regulation of T cell cytokine production(GO:0002725) |
| 0.0 | 0.1 | GO:0050916 | sensory perception of sweet taste(GO:0050916) |
| 0.0 | 0.2 | GO:0097646 | calcitonin family receptor signaling pathway(GO:0097646) amylin receptor signaling pathway(GO:0097647) |
| 0.0 | 0.2 | GO:0000707 | meiotic DNA recombinase assembly(GO:0000707) |
| 0.0 | 0.1 | GO:0006438 | valyl-tRNA aminoacylation(GO:0006438) |
| 0.0 | 0.4 | GO:0030321 | transepithelial chloride transport(GO:0030321) |
| 0.0 | 0.1 | GO:0001560 | regulation of cell growth by extracellular stimulus(GO:0001560) |
| 0.0 | 0.2 | GO:0035634 | response to stilbenoid(GO:0035634) |
| 0.0 | 0.1 | GO:0046726 | positive regulation by virus of viral protein levels in host cell(GO:0046726) |
| 0.0 | 0.4 | GO:1901978 | positive regulation of cell cycle checkpoint(GO:1901978) |
| 0.0 | 0.4 | GO:0035330 | regulation of hippo signaling(GO:0035330) |
| 0.0 | 0.1 | GO:1901911 | diadenosine polyphosphate catabolic process(GO:0015961) diphosphoinositol polyphosphate metabolic process(GO:0071543) diadenosine pentaphosphate metabolic process(GO:1901906) diadenosine pentaphosphate catabolic process(GO:1901907) diadenosine hexaphosphate metabolic process(GO:1901908) diadenosine hexaphosphate catabolic process(GO:1901909) adenosine 5'-(hexahydrogen pentaphosphate) metabolic process(GO:1901910) adenosine 5'-(hexahydrogen pentaphosphate) catabolic process(GO:1901911) |
| 0.0 | 0.1 | GO:0014734 | skeletal muscle hypertrophy(GO:0014734) regulation of skeletal muscle hypertrophy(GO:1904204) |
| 0.0 | 0.2 | GO:0006572 | tyrosine catabolic process(GO:0006572) |
| 0.0 | 0.1 | GO:0015742 | alpha-ketoglutarate transport(GO:0015742) |
| 0.0 | 0.1 | GO:2000048 | negative regulation of cell-cell adhesion mediated by cadherin(GO:2000048) |
| 0.0 | 0.1 | GO:0019303 | D-ribose catabolic process(GO:0019303) |
| 0.0 | 0.1 | GO:0018101 | protein citrullination(GO:0018101) histone citrullination(GO:0036414) |
| 0.0 | 0.3 | GO:0048845 | venous blood vessel morphogenesis(GO:0048845) |
| 0.0 | 0.1 | GO:0032815 | negative regulation of natural killer cell activation(GO:0032815) |
| 0.0 | 0.1 | GO:1901857 | positive regulation of cellular respiration(GO:1901857) |
| 0.0 | 0.0 | GO:0035106 | operant conditioning(GO:0035106) |
| 0.0 | 0.1 | GO:0072385 | minus-end-directed organelle transport along microtubule(GO:0072385) |
| 0.0 | 0.3 | GO:0031274 | positive regulation of pseudopodium assembly(GO:0031274) |
| 0.0 | 0.1 | GO:0030505 | inorganic diphosphate transport(GO:0030505) |
| 0.0 | 0.3 | GO:0060219 | camera-type eye photoreceptor cell differentiation(GO:0060219) |
| 0.0 | 0.2 | GO:0061087 | positive regulation of histone H3-K27 methylation(GO:0061087) |
| 0.0 | 0.0 | GO:0070384 | Harderian gland development(GO:0070384) |
| 0.0 | 0.1 | GO:0055059 | asymmetric neuroblast division(GO:0055059) |
| 0.0 | 0.1 | GO:0039019 | pronephric nephron development(GO:0039019) |
| 0.0 | 0.0 | GO:0001544 | initiation of primordial ovarian follicle growth(GO:0001544) |
| 0.0 | 0.0 | GO:0035283 | rhombomere 3 development(GO:0021569) central nervous system segmentation(GO:0035283) brain segmentation(GO:0035284) |
| 0.0 | 0.2 | GO:0045542 | positive regulation of cholesterol biosynthetic process(GO:0045542) |
| 0.0 | 0.1 | GO:0046092 | deoxycytidine metabolic process(GO:0046092) |
| 0.0 | 0.4 | GO:0098903 | regulation of membrane repolarization during action potential(GO:0098903) |
| 0.0 | 0.2 | GO:2000346 | negative regulation of hepatocyte proliferation(GO:2000346) |
| 0.0 | 0.1 | GO:2001166 | regulation of histone H2B ubiquitination(GO:2001166) positive regulation of histone H2B ubiquitination(GO:2001168) |
| 0.0 | 0.1 | GO:0060154 | cellular process regulating host cell cycle in response to virus(GO:0060154) |
| 0.0 | 0.2 | GO:0045198 | establishment of epithelial cell apical/basal polarity(GO:0045198) |
| 0.0 | 0.0 | GO:0010716 | negative regulation of extracellular matrix disassembly(GO:0010716) |
| 0.0 | 0.1 | GO:0070141 | response to UV-A(GO:0070141) |
| 0.0 | 0.0 | GO:2000630 | positive regulation of miRNA metabolic process(GO:2000630) |
| 0.0 | 0.1 | GO:0060313 | negative regulation of neutrophil degranulation(GO:0043314) negative regulation of blood vessel remodeling(GO:0060313) |
| 0.0 | 0.0 | GO:0071205 | protein localization to juxtaparanode region of axon(GO:0071205) |
| 0.0 | 0.0 | GO:0007418 | ventral midline development(GO:0007418) smoothened signaling pathway involved in regulation of cerebellar granule cell precursor cell proliferation(GO:0021938) notochord regression(GO:0060032) |
| 0.0 | 0.1 | GO:1902035 | positive regulation of hematopoietic stem cell proliferation(GO:1902035) |
| 0.0 | 0.3 | GO:0006744 | ubiquinone biosynthetic process(GO:0006744) quinone biosynthetic process(GO:1901663) |
| 0.0 | 0.1 | GO:0050915 | sensory perception of sour taste(GO:0050915) |
| 0.0 | 0.0 | GO:0061181 | regulation of chondrocyte development(GO:0061181) |
| 0.0 | 0.0 | GO:0035521 | monoubiquitinated histone deubiquitination(GO:0035521) monoubiquitinated histone H2A deubiquitination(GO:0035522) |
| 0.0 | 0.1 | GO:0015816 | glycine transport(GO:0015816) |
| 0.0 | 0.1 | GO:1903301 | positive regulation of glucokinase activity(GO:0033133) positive regulation of hexokinase activity(GO:1903301) |
| 0.0 | 0.1 | GO:0044856 | plasma membrane raft distribution(GO:0044855) plasma membrane raft localization(GO:0044856) plasma membrane raft polarization(GO:0044858) regulation of plasma membrane raft polarization(GO:1903906) |
| 0.0 | 0.0 | GO:0097535 | lymphoid lineage cell migration(GO:0097534) lymphoid lineage cell migration into thymus(GO:0097535) regulation of positive thymic T cell selection(GO:1902232) |
| 0.0 | 0.1 | GO:0060385 | axonogenesis involved in innervation(GO:0060385) |
| 0.0 | 0.0 | GO:0032747 | positive regulation of interleukin-23 production(GO:0032747) |
| 0.0 | 0.1 | GO:0070317 | negative regulation of G0 to G1 transition(GO:0070317) |
| 0.0 | 0.1 | GO:2000622 | regulation of nuclear-transcribed mRNA catabolic process, nonsense-mediated decay(GO:2000622) negative regulation of nuclear-transcribed mRNA catabolic process, nonsense-mediated decay(GO:2000623) |
| 0.0 | 0.1 | GO:0060024 | rhythmic synaptic transmission(GO:0060024) |
| 0.0 | 0.3 | GO:0016075 | rRNA catabolic process(GO:0016075) |
| 0.0 | 0.2 | GO:0014029 | neural crest formation(GO:0014029) |
| 0.0 | 0.1 | GO:0048096 | chromatin-mediated maintenance of transcription(GO:0048096) |
| 0.0 | 0.2 | GO:2000059 | negative regulation of protein ubiquitination involved in ubiquitin-dependent protein catabolic process(GO:2000059) |
Gene overrepresentation in cellular_component category:
| Log-likelihood per target | Total log-likelihood | Term | Description |
|---|---|---|---|
| 0.1 | 0.4 | GO:0044609 | DBIRD complex(GO:0044609) |
| 0.1 | 0.3 | GO:0097543 | ciliary inversin compartment(GO:0097543) |
| 0.1 | 0.5 | GO:0097058 | CRLF-CLCF1 complex(GO:0097058) |
| 0.1 | 0.3 | GO:0060187 | cell pole(GO:0060187) |
| 0.1 | 0.2 | GO:0005608 | laminin-3 complex(GO:0005608) |
| 0.0 | 0.1 | GO:0097444 | spine apparatus(GO:0097444) |
| 0.0 | 0.3 | GO:0043196 | varicosity(GO:0043196) |
| 0.0 | 0.1 | GO:0031084 | BLOC-2 complex(GO:0031084) |
| 0.0 | 0.1 | GO:0005594 | collagen type IX trimer(GO:0005594) |
| 0.0 | 0.3 | GO:0042105 | alpha-beta T cell receptor complex(GO:0042105) |
| 0.0 | 0.1 | GO:0005896 | interleukin-6 receptor complex(GO:0005896) |
| 0.0 | 0.2 | GO:0033063 | Rad51B-Rad51C-Rad51D-XRCC2 complex(GO:0033063) |
| 0.0 | 0.1 | GO:0032937 | SREBP-SCAP-Insig complex(GO:0032937) |
| 0.0 | 0.4 | GO:0031462 | Cul2-RING ubiquitin ligase complex(GO:0031462) |
| 0.0 | 0.4 | GO:0031931 | TORC1 complex(GO:0031931) |
| 0.0 | 0.1 | GO:0016035 | zeta DNA polymerase complex(GO:0016035) |
| 0.0 | 0.2 | GO:0000110 | nucleotide-excision repair factor 1 complex(GO:0000110) |
| 0.0 | 0.1 | GO:0070931 | Golgi-associated vesicle lumen(GO:0070931) |
| 0.0 | 0.1 | GO:0032021 | NELF complex(GO:0032021) |
| 0.0 | 0.2 | GO:0000931 | gamma-tubulin large complex(GO:0000931) gamma-tubulin ring complex(GO:0008274) |
| 0.0 | 0.2 | GO:0001739 | sex chromatin(GO:0001739) |
| 0.0 | 0.2 | GO:1990111 | spermatoproteasome complex(GO:1990111) |
| 0.0 | 0.3 | GO:1990454 | L-type voltage-gated calcium channel complex(GO:1990454) |
| 0.0 | 0.2 | GO:0061689 | tricellular tight junction(GO:0061689) |
| 0.0 | 0.1 | GO:0019867 | outer membrane(GO:0019867) |
| 0.0 | 0.1 | GO:1990851 | Wnt-Frizzled-LRP5/6 complex(GO:1990851) |
| 0.0 | 0.1 | GO:0097513 | myosin II filament(GO:0097513) |
| 0.0 | 0.1 | GO:0043625 | delta DNA polymerase complex(GO:0043625) |
| 0.0 | 0.1 | GO:0097129 | cyclin D2-CDK4 complex(GO:0097129) |
| 0.0 | 0.1 | GO:0033503 | HULC complex(GO:0033503) |
| 0.0 | 0.3 | GO:0042622 | photoreceptor outer segment membrane(GO:0042622) |
| 0.0 | 0.2 | GO:0005583 | fibrillar collagen trimer(GO:0005583) banded collagen fibril(GO:0098643) |
| 0.0 | 0.1 | GO:0042382 | paraspeckles(GO:0042382) |
| 0.0 | 0.1 | GO:0005638 | lamin filament(GO:0005638) |
| 0.0 | 0.1 | GO:0044194 | cytolytic granule(GO:0044194) |
| 0.0 | 0.3 | GO:0031095 | platelet dense tubular network membrane(GO:0031095) |
| 0.0 | 0.3 | GO:0097539 | ciliary transition fiber(GO:0097539) |
| 0.0 | 0.4 | GO:0035098 | ESC/E(Z) complex(GO:0035098) |
| 0.0 | 0.1 | GO:0034045 | pre-autophagosomal structure membrane(GO:0034045) |
Gene overrepresentation in molecular_function category:
| Log-likelihood per target | Total log-likelihood | Term | Description |
|---|---|---|---|
| 0.1 | 0.3 | GO:0004324 | ferredoxin-NADP+ reductase activity(GO:0004324) NADPH-adrenodoxin reductase activity(GO:0015039) oxidoreductase activity, acting on iron-sulfur proteins as donors(GO:0016730) oxidoreductase activity, acting on iron-sulfur proteins as donors, NAD or NADP as acceptor(GO:0016731) |
| 0.1 | 0.3 | GO:0015375 | glycine:sodium symporter activity(GO:0015375) |
| 0.1 | 0.4 | GO:0043183 | vascular endothelial growth factor receptor 1 binding(GO:0043183) |
| 0.1 | 0.2 | GO:0005146 | leukemia inhibitory factor receptor binding(GO:0005146) |
| 0.1 | 0.3 | GO:0010736 | serum response element binding(GO:0010736) |
| 0.1 | 0.3 | GO:0050510 | N-acetylgalactosaminyl-proteoglycan 3-beta-glucuronosyltransferase activity(GO:0050510) |
| 0.1 | 0.2 | GO:0003845 | 11-beta-hydroxysteroid dehydrogenase [NAD(P)] activity(GO:0003845) |
| 0.1 | 0.5 | GO:0005127 | ciliary neurotrophic factor receptor binding(GO:0005127) |
| 0.1 | 0.5 | GO:0005412 | glucose:sodium symporter activity(GO:0005412) |
| 0.1 | 0.2 | GO:0031859 | platelet activating factor receptor binding(GO:0031859) |
| 0.0 | 0.1 | GO:0019981 | interleukin-6 receptor activity(GO:0004915) interleukin-6 binding(GO:0019981) ciliary neurotrophic factor binding(GO:0070119) |
| 0.0 | 0.2 | GO:0033906 | protein tyrosine kinase inhibitor activity(GO:0030292) hyaluronoglucuronidase activity(GO:0033906) |
| 0.0 | 0.1 | GO:0017057 | 6-phosphogluconolactonase activity(GO:0017057) |
| 0.0 | 0.2 | GO:0004306 | ethanolamine-phosphate cytidylyltransferase activity(GO:0004306) |
| 0.0 | 0.4 | GO:0045029 | UDP-activated nucleotide receptor activity(GO:0045029) |
| 0.0 | 0.1 | GO:0090541 | MIT domain binding(GO:0090541) |
| 0.0 | 0.2 | GO:0070644 | vitamin D response element binding(GO:0070644) |
| 0.0 | 0.1 | GO:0005010 | insulin-like growth factor-activated receptor activity(GO:0005010) |
| 0.0 | 0.1 | GO:0008426 | protein kinase C inhibitor activity(GO:0008426) |
| 0.0 | 0.1 | GO:0030617 | transforming growth factor beta receptor, inhibitory cytoplasmic mediator activity(GO:0030617) |
| 0.0 | 0.1 | GO:0008475 | procollagen-lysine 5-dioxygenase activity(GO:0008475) procollagen glucosyltransferase activity(GO:0033823) |
| 0.0 | 0.2 | GO:0035402 | histone kinase activity (H3-T11 specific)(GO:0035402) |
| 0.0 | 0.6 | GO:0033549 | MAP kinase phosphatase activity(GO:0033549) |
| 0.0 | 0.1 | GO:0070095 | fructose-6-phosphate binding(GO:0070095) |
| 0.0 | 0.3 | GO:0032810 | sterol response element binding(GO:0032810) |
| 0.0 | 0.1 | GO:0000253 | 3-keto sterol reductase activity(GO:0000253) |
| 0.0 | 0.1 | GO:1990050 | phosphatidic acid transporter activity(GO:1990050) |
| 0.0 | 0.1 | GO:0036313 | phosphatidylinositol 3-kinase catalytic subunit binding(GO:0036313) |
| 0.0 | 0.2 | GO:0004095 | carnitine O-palmitoyltransferase activity(GO:0004095) |
| 0.0 | 0.1 | GO:0000822 | inositol hexakisphosphate binding(GO:0000822) inositol 1,4,5-trisphosphate-sensitive calcium-release channel activity(GO:0005220) |
| 0.0 | 0.1 | GO:0004832 | valine-tRNA ligase activity(GO:0004832) |
| 0.0 | 0.1 | GO:0052848 | endopolyphosphatase activity(GO:0000298) diphosphoinositol-polyphosphate diphosphatase activity(GO:0008486) bis(5'-adenosyl)-hexaphosphatase activity(GO:0034431) bis(5'-adenosyl)-pentaphosphatase activity(GO:0034432) inositol diphosphate tetrakisphosphate diphosphatase activity(GO:0052840) inositol bisdiphosphate tetrakisphosphate diphosphatase activity(GO:0052841) inositol diphosphate pentakisphosphate diphosphatase activity(GO:0052842) inositol-1-diphosphate-2,3,4,5,6-pentakisphosphate diphosphatase activity(GO:0052843) inositol-3-diphosphate-1,2,4,5,6-pentakisphosphate diphosphatase activity(GO:0052844) inositol-5-diphosphate-1,2,3,4,6-pentakisphosphate diphosphatase activity(GO:0052845) inositol-1,5-bisdiphosphate-2,3,4,6-tetrakisphosphate 1-diphosphatase activity(GO:0052846) inositol-1,5-bisdiphosphate-2,3,4,6-tetrakisphosphate 5-diphosphatase activity(GO:0052847) inositol-3,5-bisdiphosphate-2,3,4,6-tetrakisphosphate 5-diphosphatase activity(GO:0052848) |
| 0.0 | 0.1 | GO:0001156 | TFIIIC-class transcription factor binding(GO:0001156) |
| 0.0 | 0.2 | GO:1904929 | coreceptor activity involved in Wnt signaling pathway, planar cell polarity pathway(GO:1904929) |
| 0.0 | 0.2 | GO:1990599 | 3' overhang single-stranded DNA endodeoxyribonuclease activity(GO:1990599) |
| 0.0 | 0.8 | GO:0005031 | tumor necrosis factor-activated receptor activity(GO:0005031) death receptor activity(GO:0005035) |
| 0.0 | 0.1 | GO:0036033 | mediator complex binding(GO:0036033) |
| 0.0 | 0.1 | GO:0004668 | protein-arginine deiminase activity(GO:0004668) |
| 0.0 | 0.1 | GO:0008798 | beta-aspartyl-peptidase activity(GO:0008798) |
| 0.0 | 0.1 | GO:0017099 | very-long-chain-acyl-CoA dehydrogenase activity(GO:0017099) |
| 0.0 | 0.1 | GO:0015187 | glycine transmembrane transporter activity(GO:0015187) |
| 0.0 | 0.1 | GO:0030020 | extracellular matrix structural constituent conferring tensile strength(GO:0030020) |
| 0.0 | 0.2 | GO:0004861 | cyclin-dependent protein serine/threonine kinase inhibitor activity(GO:0004861) |
| 0.0 | 0.2 | GO:0001042 | RNA polymerase I core binding(GO:0001042) |
| 0.0 | 0.1 | GO:0030348 | syntaxin-3 binding(GO:0030348) |
| 0.0 | 0.3 | GO:0008331 | high voltage-gated calcium channel activity(GO:0008331) |
| 0.0 | 0.2 | GO:0035612 | AP-2 adaptor complex binding(GO:0035612) |
| 0.0 | 0.6 | GO:0030742 | GTP-dependent protein binding(GO:0030742) |
| 0.0 | 0.1 | GO:0004137 | deoxycytidine kinase activity(GO:0004137) thymidine kinase activity(GO:0004797) |
| 0.0 | 0.2 | GO:0016176 | superoxide-generating NADPH oxidase activator activity(GO:0016176) |
| 0.0 | 0.1 | GO:0044736 | acid-sensing ion channel activity(GO:0044736) |
| 0.0 | 0.0 | GO:0004803 | transposase activity(GO:0004803) |
| 0.0 | 0.0 | GO:0038131 | neuregulin receptor activity(GO:0038131) |
| 0.0 | 0.2 | GO:0000150 | recombinase activity(GO:0000150) |
| 0.0 | 0.3 | GO:0017049 | GTP-Rho binding(GO:0017049) |
Gene overrepresentation in C2:CP category:
| Log-likelihood per target | Total log-likelihood | Term | Description |
|---|---|---|---|
| 0.0 | 0.4 | PID VEGF VEGFR PATHWAY | VEGF and VEGFR signaling network |
| 0.0 | 0.5 | PID P38 MK2 PATHWAY | p38 signaling mediated by MAPKAP kinases |
| 0.0 | 0.4 | PID ARF 3PATHWAY | Arf1 pathway |
| 0.0 | 0.2 | PID ALK2 PATHWAY | ALK2 signaling events |
| 0.0 | 0.8 | PID PI3KCI AKT PATHWAY | Class I PI3K signaling events mediated by Akt |
Gene overrepresentation in C2:CP:REACTOME category:
| Log-likelihood per target | Total log-likelihood | Term | Description |
|---|---|---|---|
| 0.0 | 0.4 | REACTOME VEGF LIGAND RECEPTOR INTERACTIONS | Genes involved in VEGF ligand-receptor interactions |
| 0.0 | 0.7 | REACTOME DCC MEDIATED ATTRACTIVE SIGNALING | Genes involved in DCC mediated attractive signaling |
| 0.0 | 0.4 | REACTOME P2Y RECEPTORS | Genes involved in P2Y receptors |
| 0.0 | 0.3 | REACTOME ERKS ARE INACTIVATED | Genes involved in ERKs are inactivated |
| 0.0 | 0.2 | REACTOME MEMBRANE BINDING AND TARGETTING OF GAG PROTEINS | Genes involved in Membrane binding and targetting of GAG proteins |
| 0.0 | 0.4 | REACTOME MTORC1 MEDIATED SIGNALLING | Genes involved in mTORC1-mediated signalling |
| 0.0 | 0.1 | REACTOME IL 6 SIGNALING | Genes involved in Interleukin-6 signaling |
| 0.0 | 0.2 | REACTOME ELEVATION OF CYTOSOLIC CA2 LEVELS | Genes involved in Elevation of cytosolic Ca2+ levels |
| 0.0 | 0.3 | REACTOME NA CL DEPENDENT NEUROTRANSMITTER TRANSPORTERS | Genes involved in Na+/Cl- dependent neurotransmitter transporters |
| 0.0 | 0.2 | REACTOME HYALURONAN UPTAKE AND DEGRADATION | Genes involved in Hyaluronan uptake and degradation |
| 0.0 | 0.3 | REACTOME REGULATION OF IFNA SIGNALING | Genes involved in Regulation of IFNA signaling |