Project
A549 cells infected with SARS-CoV-2 Analysis Results (GEO series: GSE147507)
Navigation
Downloads
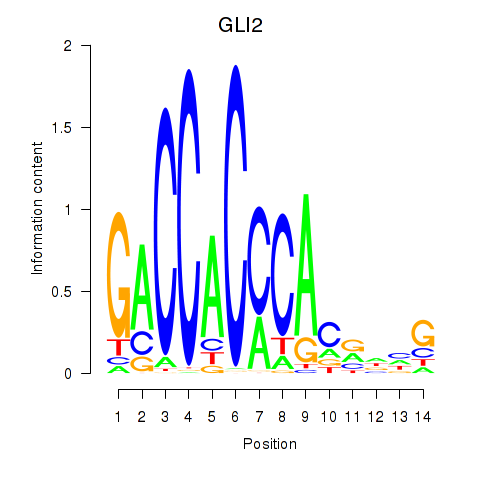
Results for GLI2
Z-value: 1.13
Motif logo
Transcription factors associated with GLI2
| Gene Symbol | Gene ID | Gene Info |
|---|---|---|
|
GLI2
|
ENSG00000074047.16 | GLI family zinc finger 2 |
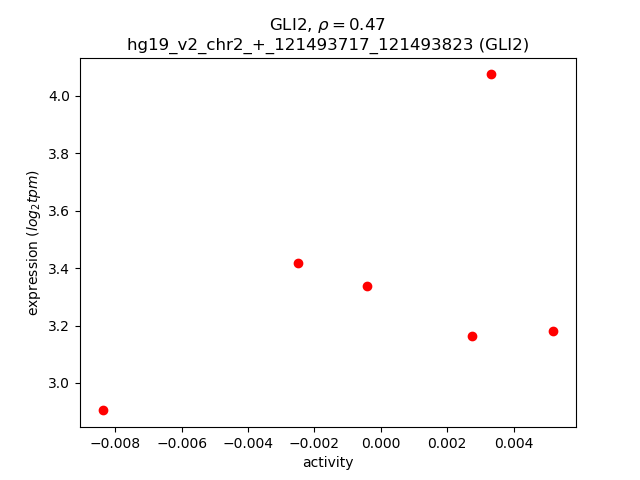
Activity-expression correlation:
| Gene | Promoter | Pearson corr. coef. | P-value | Plot |
|---|---|---|---|---|
| GLI2 | hg19_v2_chr2_+_121493717_121493823 | 0.47 | 3.5e-01 | Click! |
Activity profile of GLI2 motif
Sorted Z-values of GLI2 motif
| Promoter | Log-likelihood | Transcript | Gene | Gene Info |
|---|---|---|---|---|
| chr19_-_48673465 | 0.90 |
ENST00000598938.1
|
LIG1
|
ligase I, DNA, ATP-dependent |
| chr3_+_184279566 | 0.60 |
ENST00000330394.2
|
EPHB3
|
EPH receptor B3 |
| chr19_-_49522727 | 0.56 |
ENST00000600007.1
|
CTB-60B18.10
|
CTB-60B18.10 |
| chr7_-_92465868 | 0.55 |
ENST00000424848.2
|
CDK6
|
cyclin-dependent kinase 6 |
| chr12_+_116985896 | 0.52 |
ENST00000547114.1
|
RP11-809C9.2
|
RP11-809C9.2 |
| chr3_-_10052869 | 0.44 |
ENST00000454232.1
|
AC022007.5
|
AC022007.5 |
| chr9_-_99329098 | 0.42 |
ENST00000452280.1
|
CDC14B
|
cell division cycle 14B |
| chr2_+_85646054 | 0.40 |
ENST00000389938.2
|
SH2D6
|
SH2 domain containing 6 |
| chr7_-_127032114 | 0.40 |
ENST00000436992.1
|
ZNF800
|
zinc finger protein 800 |
| chr17_-_80059726 | 0.39 |
ENST00000583053.1
|
CCDC57
|
coiled-coil domain containing 57 |
| chr1_-_16563641 | 0.39 |
ENST00000375599.3
|
RSG1
|
REM2 and RAB-like small GTPase 1 |
| chr8_+_94752349 | 0.38 |
ENST00000391680.1
|
RBM12B-AS1
|
RBM12B antisense RNA 1 |
| chr11_+_68451943 | 0.38 |
ENST00000265643.3
|
GAL
|
galanin/GMAP prepropeptide |
| chr16_+_2521500 | 0.37 |
ENST00000293973.1
|
NTN3
|
netrin 3 |
| chr20_+_34679725 | 0.36 |
ENST00000432589.1
|
EPB41L1
|
erythrocyte membrane protein band 4.1-like 1 |
| chrX_-_135056106 | 0.36 |
ENST00000433339.2
|
MMGT1
|
membrane magnesium transporter 1 |
| chr8_-_128960591 | 0.35 |
ENST00000539634.1
|
TMEM75
|
transmembrane protein 75 |
| chr3_-_88108192 | 0.35 |
ENST00000309534.6
|
CGGBP1
|
CGG triplet repeat binding protein 1 |
| chr3_-_10052763 | 0.35 |
ENST00000383808.2
ENST00000426698.1 ENST00000470827.2 |
AC022007.5
EMC3
|
AC022007.5 ER membrane protein complex subunit 3 |
| chr12_+_50101500 | 0.35 |
ENST00000548809.1
ENST00000551154.1 |
TMBIM6
|
transmembrane BAX inhibitor motif containing 6 |
| chr22_-_41258074 | 0.33 |
ENST00000307221.4
|
DNAJB7
|
DnaJ (Hsp40) homolog, subfamily B, member 7 |
| chr16_-_850723 | 0.32 |
ENST00000248150.4
|
GNG13
|
guanine nucleotide binding protein (G protein), gamma 13 |
| chr20_-_58508702 | 0.31 |
ENST00000357552.3
ENST00000425931.1 |
SYCP2
|
synaptonemal complex protein 2 |
| chr3_-_135915146 | 0.31 |
ENST00000473093.1
|
MSL2
|
male-specific lethal 2 homolog (Drosophila) |
| chr11_-_73720122 | 0.30 |
ENST00000426995.2
|
UCP3
|
uncoupling protein 3 (mitochondrial, proton carrier) |
| chr16_+_25078208 | 0.30 |
ENST00000571219.1
|
RP11-266L9.5
|
RP11-266L9.5 |
| chr11_-_128775930 | 0.30 |
ENST00000524878.1
|
C11orf45
|
chromosome 11 open reading frame 45 |
| chr22_+_20905422 | 0.30 |
ENST00000424287.1
ENST00000423862.1 |
MED15
|
mediator complex subunit 15 |
| chr10_-_5638048 | 0.29 |
ENST00000478294.1
|
RP13-463N16.6
|
RP13-463N16.6 |
| chr6_-_121655593 | 0.28 |
ENST00000398212.2
|
TBC1D32
|
TBC1 domain family, member 32 |
| chr3_-_10334585 | 0.28 |
ENST00000430179.1
ENST00000449238.2 ENST00000437422.2 ENST00000287656.7 ENST00000457360.1 ENST00000439975.2 ENST00000446937.2 |
GHRL
|
ghrelin/obestatin prepropeptide |
| chr14_-_51297360 | 0.27 |
ENST00000496749.1
|
NIN
|
ninein (GSK3B interacting protein) |
| chr17_+_50939459 | 0.27 |
ENST00000412360.1
|
AC102948.2
|
Uncharacterized protein |
| chr19_-_35981358 | 0.27 |
ENST00000484218.2
ENST00000338897.3 |
KRTDAP
|
keratinocyte differentiation-associated protein |
| chr22_+_23248512 | 0.27 |
ENST00000390325.2
|
IGLC3
|
immunoglobulin lambda constant 3 (Kern-Oz+ marker) |
| chr19_+_56989485 | 0.27 |
ENST00000585445.1
ENST00000586091.1 ENST00000594783.1 ENST00000592146.1 ENST00000588158.1 ENST00000299997.4 ENST00000591797.1 |
ZNF667-AS1
|
ZNF667 antisense RNA 1 (head to head) |
| chr12_-_10022735 | 0.27 |
ENST00000228438.2
|
CLEC2B
|
C-type lectin domain family 2, member B |
| chr10_+_89124746 | 0.26 |
ENST00000465545.1
|
NUTM2D
|
NUT family member 2D |
| chr2_-_201936302 | 0.26 |
ENST00000453765.1
ENST00000452799.1 ENST00000446678.1 ENST00000418596.3 |
FAM126B
|
family with sequence similarity 126, member B |
| chr2_+_241564655 | 0.26 |
ENST00000407714.1
|
GPR35
|
G protein-coupled receptor 35 |
| chr2_-_112237835 | 0.26 |
ENST00000442293.1
ENST00000439494.1 |
MIR4435-1HG
|
MIR4435-1 host gene (non-protein coding) |
| chr14_+_96342729 | 0.25 |
ENST00000504119.1
|
LINC00617
|
long intergenic non-protein coding RNA 617 |
| chr5_-_102455801 | 0.25 |
ENST00000508629.1
ENST00000399004.2 |
GIN1
|
gypsy retrotransposon integrase 1 |
| chr17_+_73629500 | 0.25 |
ENST00000375215.3
|
SMIM5
|
small integral membrane protein 5 |
| chr17_-_4710288 | 0.25 |
ENST00000571067.1
|
RP11-81A22.5
|
RP11-81A22.5 |
| chr1_-_46089718 | 0.25 |
ENST00000421127.2
ENST00000343901.2 ENST00000528266.1 |
CCDC17
|
coiled-coil domain containing 17 |
| chr8_-_90993869 | 0.25 |
ENST00000517772.1
|
NBN
|
nibrin |
| chr12_+_133707570 | 0.25 |
ENST00000416488.1
ENST00000540096.2 |
ZNF268
CTD-2140B24.4
|
zinc finger protein 268 Zinc finger protein 268 |
| chr6_+_116892641 | 0.25 |
ENST00000487832.2
ENST00000518117.1 |
RWDD1
|
RWD domain containing 1 |
| chr10_-_105238997 | 0.25 |
ENST00000369783.4
|
CALHM3
|
calcium homeostasis modulator 3 |
| chr15_-_43882140 | 0.24 |
ENST00000429176.1
|
PPIP5K1
|
diphosphoinositol pentakisphosphate kinase 1 |
| chr7_-_994302 | 0.24 |
ENST00000265846.5
|
ADAP1
|
ArfGAP with dual PH domains 1 |
| chr16_+_67063262 | 0.24 |
ENST00000565389.1
|
CBFB
|
core-binding factor, beta subunit |
| chr3_-_38071122 | 0.23 |
ENST00000334661.4
|
PLCD1
|
phospholipase C, delta 1 |
| chr8_+_96145974 | 0.23 |
ENST00000315367.3
|
PLEKHF2
|
pleckstrin homology domain containing, family F (with FYVE domain) member 2 |
| chr5_-_89705537 | 0.23 |
ENST00000522864.1
ENST00000522083.1 ENST00000522565.1 ENST00000522842.1 ENST00000283122.3 |
CETN3
|
centrin, EF-hand protein, 3 |
| chr22_-_21482352 | 0.23 |
ENST00000329949.3
|
POM121L7
|
POM121 transmembrane nucleoporin-like 7 |
| chr1_-_21948906 | 0.23 |
ENST00000374761.2
ENST00000599760.1 |
RAP1GAP
|
RAP1 GTPase activating protein |
| chr2_+_121493717 | 0.22 |
ENST00000418323.1
|
GLI2
|
GLI family zinc finger 2 |
| chr3_-_24536453 | 0.22 |
ENST00000453729.2
ENST00000413780.1 |
THRB
|
thyroid hormone receptor, beta |
| chr11_+_117103333 | 0.22 |
ENST00000534428.1
|
RNF214
|
ring finger protein 214 |
| chr21_-_38445470 | 0.22 |
ENST00000399098.1
|
PIGP
|
phosphatidylinositol glycan anchor biosynthesis, class P |
| chr11_-_2906979 | 0.21 |
ENST00000380725.1
ENST00000313407.6 ENST00000430149.2 ENST00000440480.2 ENST00000414822.3 |
CDKN1C
|
cyclin-dependent kinase inhibitor 1C (p57, Kip2) |
| chr1_+_153600869 | 0.21 |
ENST00000292169.1
ENST00000368696.3 ENST00000436839.1 |
S100A1
|
S100 calcium binding protein A1 |
| chr13_-_52026730 | 0.21 |
ENST00000420668.2
|
INTS6
|
integrator complex subunit 6 |
| chr17_+_74723031 | 0.21 |
ENST00000586200.1
|
METTL23
|
methyltransferase like 23 |
| chr5_-_43412418 | 0.21 |
ENST00000537013.1
ENST00000361115.4 |
CCL28
|
chemokine (C-C motif) ligand 28 |
| chr8_+_7705398 | 0.21 |
ENST00000400125.2
ENST00000434307.2 ENST00000326558.5 ENST00000351436.4 ENST00000528033.1 |
SPAG11A
|
sperm associated antigen 11A |
| chr16_+_56691606 | 0.21 |
ENST00000334350.6
|
MT1F
|
metallothionein 1F |
| chr4_+_95129061 | 0.21 |
ENST00000354268.4
|
SMARCAD1
|
SWI/SNF-related, matrix-associated actin-dependent regulator of chromatin, subfamily a, containing DEAD/H box 1 |
| chr21_+_38888740 | 0.21 |
ENST00000597817.1
|
AP001421.1
|
Uncharacterized protein |
| chr8_-_7320974 | 0.21 |
ENST00000528943.1
ENST00000359758.5 ENST00000361111.2 ENST00000398462.2 ENST00000297498.2 ENST00000317900.5 |
SPAG11B
|
sperm associated antigen 11B |
| chr6_+_26273144 | 0.21 |
ENST00000377733.2
|
HIST1H2BI
|
histone cluster 1, H2bi |
| chr21_-_35340759 | 0.20 |
ENST00000607953.1
|
AP000569.9
|
AP000569.9 |
| chr8_-_61880248 | 0.20 |
ENST00000525556.1
|
AC022182.3
|
AC022182.3 |
| chr1_+_3385085 | 0.20 |
ENST00000445297.1
|
ARHGEF16
|
Rho guanine nucleotide exchange factor (GEF) 16 |
| chr17_+_6544328 | 0.20 |
ENST00000570330.1
|
TXNDC17
|
thioredoxin domain containing 17 |
| chr17_+_73996987 | 0.20 |
ENST00000588812.1
ENST00000448471.1 |
CDK3
|
cyclin-dependent kinase 3 |
| chr10_-_105156198 | 0.20 |
ENST00000369815.1
ENST00000309579.3 ENST00000337003.4 |
USMG5
|
up-regulated during skeletal muscle growth 5 homolog (mouse) |
| chr19_+_17638059 | 0.20 |
ENST00000599164.1
ENST00000449408.2 ENST00000600871.1 ENST00000599124.1 |
FAM129C
|
family with sequence similarity 129, member C |
| chr11_-_73720276 | 0.20 |
ENST00000348534.4
|
UCP3
|
uncoupling protein 3 (mitochondrial, proton carrier) |
| chr15_+_29211570 | 0.20 |
ENST00000558804.1
|
APBA2
|
amyloid beta (A4) precursor protein-binding, family A, member 2 |
| chr7_-_127032363 | 0.20 |
ENST00000393312.1
|
ZNF800
|
zinc finger protein 800 |
| chr1_-_32403370 | 0.20 |
ENST00000534796.1
|
PTP4A2
|
protein tyrosine phosphatase type IVA, member 2 |
| chr16_+_67063142 | 0.20 |
ENST00000412916.2
|
CBFB
|
core-binding factor, beta subunit |
| chr1_-_245134273 | 0.20 |
ENST00000607453.1
|
RP11-156E8.1
|
Uncharacterized protein |
| chr1_-_55266865 | 0.20 |
ENST00000371274.4
|
TTC22
|
tetratricopeptide repeat domain 22 |
| chr4_-_187476721 | 0.20 |
ENST00000307161.5
|
MTNR1A
|
melatonin receptor 1A |
| chr7_+_106809406 | 0.20 |
ENST00000468410.1
ENST00000478930.1 ENST00000464009.1 ENST00000222574.4 |
HBP1
|
HMG-box transcription factor 1 |
| chr20_+_30598231 | 0.19 |
ENST00000300415.8
ENST00000262659.8 |
CCM2L
|
cerebral cavernous malformation 2-like |
| chr19_+_35810164 | 0.19 |
ENST00000598537.1
|
CD22
|
CD22 molecule |
| chr5_-_178054105 | 0.19 |
ENST00000316308.4
|
CLK4
|
CDC-like kinase 4 |
| chrX_-_107334790 | 0.19 |
ENST00000217958.3
|
PSMD10
|
proteasome (prosome, macropain) 26S subunit, non-ATPase, 10 |
| chr4_-_156298087 | 0.19 |
ENST00000311277.4
|
MAP9
|
microtubule-associated protein 9 |
| chr5_-_89770171 | 0.19 |
ENST00000514906.1
|
MBLAC2
|
metallo-beta-lactamase domain containing 2 |
| chr21_+_34697258 | 0.19 |
ENST00000442071.1
ENST00000442357.2 |
IFNAR1
|
interferon (alpha, beta and omega) receptor 1 |
| chr17_-_71258019 | 0.19 |
ENST00000344935.4
|
CPSF4L
|
cleavage and polyadenylation specific factor 4-like |
| chr22_+_23243156 | 0.19 |
ENST00000390323.2
|
IGLC2
|
immunoglobulin lambda constant 2 (Kern-Oz- marker) |
| chr22_+_45714672 | 0.19 |
ENST00000424557.1
|
FAM118A
|
family with sequence similarity 118, member A |
| chr7_-_105319536 | 0.19 |
ENST00000477775.1
|
ATXN7L1
|
ataxin 7-like 1 |
| chr7_+_23145884 | 0.19 |
ENST00000409689.1
ENST00000410047.1 |
KLHL7
|
kelch-like family member 7 |
| chr16_-_15736345 | 0.19 |
ENST00000549219.1
|
KIAA0430
|
KIAA0430 |
| chr9_+_108456800 | 0.19 |
ENST00000434214.1
ENST00000374692.3 |
TMEM38B
|
transmembrane protein 38B |
| chr15_+_59063478 | 0.19 |
ENST00000559228.1
ENST00000450403.2 |
FAM63B
|
family with sequence similarity 63, member B |
| chr5_+_118407053 | 0.18 |
ENST00000311085.8
ENST00000539542.1 |
DMXL1
|
Dmx-like 1 |
| chr11_-_118550375 | 0.18 |
ENST00000525958.1
ENST00000264029.4 ENST00000397925.1 ENST00000529101.1 |
TREH
|
trehalase (brush-border membrane glycoprotein) |
| chr22_+_45714361 | 0.18 |
ENST00000452238.1
|
FAM118A
|
family with sequence similarity 118, member A |
| chr9_-_139927462 | 0.18 |
ENST00000314412.6
|
FUT7
|
fucosyltransferase 7 (alpha (1,3) fucosyltransferase) |
| chr4_+_72052964 | 0.18 |
ENST00000264485.5
ENST00000425175.1 |
SLC4A4
|
solute carrier family 4 (sodium bicarbonate cotransporter), member 4 |
| chr2_+_241544834 | 0.18 |
ENST00000319838.5
ENST00000403859.1 ENST00000438013.2 |
GPR35
|
G protein-coupled receptor 35 |
| chr18_+_56807096 | 0.18 |
ENST00000588875.1
|
SEC11C
|
SEC11 homolog C (S. cerevisiae) |
| chr15_-_98417780 | 0.18 |
ENST00000503874.3
|
LINC00923
|
long intergenic non-protein coding RNA 923 |
| chrX_+_17755696 | 0.18 |
ENST00000419185.1
|
SCML1
|
sex comb on midleg-like 1 (Drosophila) |
| chr19_-_17571722 | 0.18 |
ENST00000301944.2
|
NXNL1
|
nucleoredoxin-like 1 |
| chr2_-_197041193 | 0.18 |
ENST00000409228.1
|
STK17B
|
serine/threonine kinase 17b |
| chr5_-_82373260 | 0.18 |
ENST00000502346.1
|
TMEM167A
|
transmembrane protein 167A |
| chr2_-_232395169 | 0.18 |
ENST00000305141.4
|
NMUR1
|
neuromedin U receptor 1 |
| chr5_-_132299313 | 0.18 |
ENST00000265343.5
|
AFF4
|
AF4/FMR2 family, member 4 |
| chr1_-_41487415 | 0.18 |
ENST00000372611.1
|
SLFNL1
|
schlafen-like 1 |
| chr11_+_66045634 | 0.18 |
ENST00000528852.1
ENST00000311445.6 |
CNIH2
|
cornichon family AMPA receptor auxiliary protein 2 |
| chr5_+_140579162 | 0.17 |
ENST00000536699.1
ENST00000354757.3 |
PCDHB11
|
protocadherin beta 11 |
| chr2_+_220379052 | 0.17 |
ENST00000347842.3
ENST00000358078.4 |
ASIC4
|
acid-sensing (proton-gated) ion channel family member 4 |
| chr20_-_18447667 | 0.17 |
ENST00000262547.5
ENST00000329494.5 ENST00000357236.4 |
DZANK1
|
double zinc ribbon and ankyrin repeat domains 1 |
| chr17_-_30185971 | 0.17 |
ENST00000378634.2
|
COPRS
|
coordinator of PRMT5, differentiation stimulator |
| chr11_+_18230685 | 0.17 |
ENST00000340135.3
ENST00000534640.1 |
RP11-113D6.10
|
Putative mitochondrial carrier protein LOC494141 |
| chr2_+_11295624 | 0.17 |
ENST00000402361.1
ENST00000428481.1 |
PQLC3
|
PQ loop repeat containing 3 |
| chr15_-_49447771 | 0.17 |
ENST00000558843.1
ENST00000542928.1 ENST00000561248.1 |
COPS2
|
COP9 signalosome subunit 2 |
| chr11_-_118550346 | 0.17 |
ENST00000530256.1
|
TREH
|
trehalase (brush-border membrane glycoprotein) |
| chr19_+_1908013 | 0.17 |
ENST00000454697.1
|
ADAT3
|
adenosine deaminase, tRNA-specific 3 |
| chr4_+_95128748 | 0.17 |
ENST00000359052.4
|
SMARCAD1
|
SWI/SNF-related, matrix-associated actin-dependent regulator of chromatin, subfamily a, containing DEAD/H box 1 |
| chr1_-_45308616 | 0.17 |
ENST00000447098.2
ENST00000372192.3 |
PTCH2
|
patched 2 |
| chr1_+_46640750 | 0.17 |
ENST00000372003.1
|
TSPAN1
|
tetraspanin 1 |
| chr17_-_74582191 | 0.17 |
ENST00000225276.5
|
ST6GALNAC2
|
ST6 (alpha-N-acetyl-neuraminyl-2,3-beta-galactosyl-1,3)-N-acetylgalactosaminide alpha-2,6-sialyltransferase 2 |
| chr5_+_102455853 | 0.17 |
ENST00000515845.1
ENST00000321521.9 ENST00000507921.1 |
PPIP5K2
|
diphosphoinositol pentakisphosphate kinase 2 |
| chr14_+_106938440 | 0.17 |
ENST00000433371.1
ENST00000449670.1 ENST00000334298.3 |
LINC00221
|
long intergenic non-protein coding RNA 221 |
| chr19_-_58220517 | 0.17 |
ENST00000512439.2
ENST00000426889.1 |
ZNF154
|
zinc finger protein 154 |
| chr6_-_84937314 | 0.17 |
ENST00000257766.4
ENST00000403245.3 |
KIAA1009
|
KIAA1009 |
| chr1_-_47697387 | 0.16 |
ENST00000371884.2
|
TAL1
|
T-cell acute lymphocytic leukemia 1 |
| chr4_-_107237374 | 0.16 |
ENST00000361687.4
ENST00000507696.1 ENST00000394708.2 ENST00000509532.1 |
TBCK
|
TBC1 domain containing kinase |
| chr14_+_105147464 | 0.16 |
ENST00000540171.2
|
RP11-982M15.6
|
RP11-982M15.6 |
| chr19_-_49176264 | 0.16 |
ENST00000270235.4
ENST00000596844.1 |
NTN5
|
netrin 5 |
| chr3_+_88108381 | 0.16 |
ENST00000473136.1
|
RP11-159G9.5
|
Uncharacterized protein |
| chr3_-_138312971 | 0.16 |
ENST00000485115.1
ENST00000484888.1 ENST00000468900.1 ENST00000542237.1 ENST00000481834.1 |
CEP70
|
centrosomal protein 70kDa |
| chr1_-_200379180 | 0.16 |
ENST00000294740.3
|
ZNF281
|
zinc finger protein 281 |
| chr1_-_182573514 | 0.16 |
ENST00000367558.5
|
RGS16
|
regulator of G-protein signaling 16 |
| chr16_-_21452040 | 0.16 |
ENST00000521589.1
|
NPIPB3
|
nuclear pore complex interacting protein family, member B3 |
| chr10_+_70320413 | 0.16 |
ENST00000373644.4
|
TET1
|
tet methylcytosine dioxygenase 1 |
| chr4_-_107237340 | 0.16 |
ENST00000394706.3
|
TBCK
|
TBC1 domain containing kinase |
| chrX_-_30326445 | 0.16 |
ENST00000378963.1
|
NR0B1
|
nuclear receptor subfamily 0, group B, member 1 |
| chr19_+_3539152 | 0.16 |
ENST00000329493.5
|
C19orf71
|
chromosome 19 open reading frame 71 |
| chr5_+_102455968 | 0.16 |
ENST00000358359.3
|
PPIP5K2
|
diphosphoinositol pentakisphosphate kinase 2 |
| chr8_+_31497271 | 0.16 |
ENST00000520407.1
|
NRG1
|
neuregulin 1 |
| chr14_-_24584138 | 0.16 |
ENST00000558280.1
ENST00000561028.1 |
NRL
|
neural retina leucine zipper |
| chr2_-_39348137 | 0.16 |
ENST00000426016.1
|
SOS1
|
son of sevenless homolog 1 (Drosophila) |
| chr1_+_152178320 | 0.16 |
ENST00000429352.1
|
RP11-107M16.2
|
RP11-107M16.2 |
| chrX_+_55744166 | 0.16 |
ENST00000374941.4
ENST00000414239.1 |
RRAGB
|
Ras-related GTP binding B |
| chr2_+_223536428 | 0.16 |
ENST00000446656.3
|
MOGAT1
|
monoacylglycerol O-acyltransferase 1 |
| chr7_+_116593536 | 0.16 |
ENST00000417919.1
|
ST7
|
suppression of tumorigenicity 7 |
| chr9_+_19408919 | 0.16 |
ENST00000380376.1
|
ACER2
|
alkaline ceramidase 2 |
| chr5_-_178054014 | 0.15 |
ENST00000520957.1
|
CLK4
|
CDC-like kinase 4 |
| chr9_-_35042824 | 0.15 |
ENST00000595331.1
|
FLJ00273
|
FLJ00273 |
| chr11_-_111957451 | 0.15 |
ENST00000504148.2
ENST00000541231.1 |
TIMM8B
|
translocase of inner mitochondrial membrane 8 homolog B (yeast) |
| chr8_+_94929168 | 0.15 |
ENST00000518107.1
ENST00000396200.3 |
PDP1
|
pyruvate dehyrogenase phosphatase catalytic subunit 1 |
| chr2_-_169746878 | 0.15 |
ENST00000282074.2
|
SPC25
|
SPC25, NDC80 kinetochore complex component |
| chr16_+_56691838 | 0.15 |
ENST00000394501.2
|
MT1F
|
metallothionein 1F |
| chr3_+_44626446 | 0.15 |
ENST00000441021.1
ENST00000322734.2 |
ZNF660
|
zinc finger protein 660 |
| chrX_+_55744228 | 0.15 |
ENST00000262850.7
|
RRAGB
|
Ras-related GTP binding B |
| chr20_-_58508359 | 0.15 |
ENST00000446834.1
|
SYCP2
|
synaptonemal complex protein 2 |
| chr1_+_152486950 | 0.15 |
ENST00000368790.3
|
CRCT1
|
cysteine-rich C-terminal 1 |
| chr19_+_45418067 | 0.15 |
ENST00000589078.1
ENST00000586638.1 |
APOC1
|
apolipoprotein C-I |
| chr6_-_29648887 | 0.15 |
ENST00000376883.1
|
ZFP57
|
ZFP57 zinc finger protein |
| chr2_+_237476419 | 0.15 |
ENST00000447924.1
|
ACKR3
|
atypical chemokine receptor 3 |
| chr21_-_40555393 | 0.14 |
ENST00000380900.2
|
PSMG1
|
proteasome (prosome, macropain) assembly chaperone 1 |
| chr14_-_75530693 | 0.14 |
ENST00000555135.1
ENST00000357971.3 ENST00000553302.1 ENST00000555694.1 ENST00000238618.3 |
ACYP1
|
acylphosphatase 1, erythrocyte (common) type |
| chr5_+_149340282 | 0.14 |
ENST00000286298.4
|
SLC26A2
|
solute carrier family 26 (anion exchanger), member 2 |
| chr21_-_45079341 | 0.14 |
ENST00000443485.1
ENST00000291560.2 |
HSF2BP
|
heat shock transcription factor 2 binding protein |
| chr1_-_157108266 | 0.14 |
ENST00000326786.4
|
ETV3
|
ets variant 3 |
| chr6_+_26204825 | 0.14 |
ENST00000360441.4
|
HIST1H4E
|
histone cluster 1, H4e |
| chr16_+_31885079 | 0.14 |
ENST00000300870.10
ENST00000394846.3 |
ZNF267
|
zinc finger protein 267 |
| chr8_+_94929077 | 0.14 |
ENST00000297598.4
ENST00000520614.1 |
PDP1
|
pyruvate dehyrogenase phosphatase catalytic subunit 1 |
| chr13_-_36871886 | 0.14 |
ENST00000491049.2
ENST00000503173.1 ENST00000239860.6 ENST00000379862.2 ENST00000239859.7 ENST00000379864.2 ENST00000510088.1 ENST00000554962.1 ENST00000511166.1 |
CCDC169
SOHLH2
CCDC169-SOHLH2
|
coiled-coil domain containing 169 spermatogenesis and oogenesis specific basic helix-loop-helix 2 CCDC169-SOHLH2 readthrough |
| chr9_+_78505581 | 0.14 |
ENST00000376767.3
ENST00000376752.4 |
PCSK5
|
proprotein convertase subtilisin/kexin type 5 |
| chr7_+_64363625 | 0.14 |
ENST00000476120.1
ENST00000319636.5 ENST00000545510.1 |
ZNF273
|
zinc finger protein 273 |
| chr1_+_1217489 | 0.14 |
ENST00000325425.8
ENST00000400928.3 |
SCNN1D
|
sodium channel, non-voltage-gated 1, delta subunit |
| chr2_+_11295498 | 0.14 |
ENST00000295083.3
ENST00000441908.2 |
PQLC3
|
PQ loop repeat containing 3 |
| chr5_-_89825328 | 0.14 |
ENST00000500869.2
ENST00000315948.6 ENST00000509384.1 |
LYSMD3
|
LysM, putative peptidoglycan-binding, domain containing 3 |
| chr10_+_32735177 | 0.14 |
ENST00000545067.1
|
CCDC7
|
coiled-coil domain containing 7 |
| chr17_+_7184986 | 0.14 |
ENST00000317370.8
ENST00000571308.1 |
SLC2A4
|
solute carrier family 2 (facilitated glucose transporter), member 4 |
| chr16_+_56691911 | 0.14 |
ENST00000568475.1
|
MT1F
|
metallothionein 1F |
| chr16_+_9185450 | 0.14 |
ENST00000327827.7
|
C16orf72
|
chromosome 16 open reading frame 72 |
| chrX_-_78622805 | 0.14 |
ENST00000373298.2
|
ITM2A
|
integral membrane protein 2A |
| chr9_-_130742792 | 0.14 |
ENST00000373095.1
|
FAM102A
|
family with sequence similarity 102, member A |
| chr1_-_41487383 | 0.14 |
ENST00000302946.8
ENST00000372613.2 ENST00000439569.2 ENST00000397197.2 |
SLFNL1
|
schlafen-like 1 |
| chr4_+_95128996 | 0.14 |
ENST00000457823.2
|
SMARCAD1
|
SWI/SNF-related, matrix-associated actin-dependent regulator of chromatin, subfamily a, containing DEAD/H box 1 |
| chr6_+_116892530 | 0.14 |
ENST00000466444.2
ENST00000368590.5 ENST00000392526.1 |
RWDD1
|
RWD domain containing 1 |
| chr17_-_34122596 | 0.13 |
ENST00000250144.8
|
MMP28
|
matrix metallopeptidase 28 |
| chr10_-_101989315 | 0.13 |
ENST00000370397.7
|
CHUK
|
conserved helix-loop-helix ubiquitous kinase |
| chr19_-_58874112 | 0.13 |
ENST00000311044.3
ENST00000595763.1 ENST00000425453.3 |
ZNF497
|
zinc finger protein 497 |
| chrX_-_15402498 | 0.13 |
ENST00000297904.3
|
FIGF
|
c-fos induced growth factor (vascular endothelial growth factor D) |
| chr1_+_109102652 | 0.13 |
ENST00000370035.3
ENST00000405454.1 |
FAM102B
|
family with sequence similarity 102, member B |
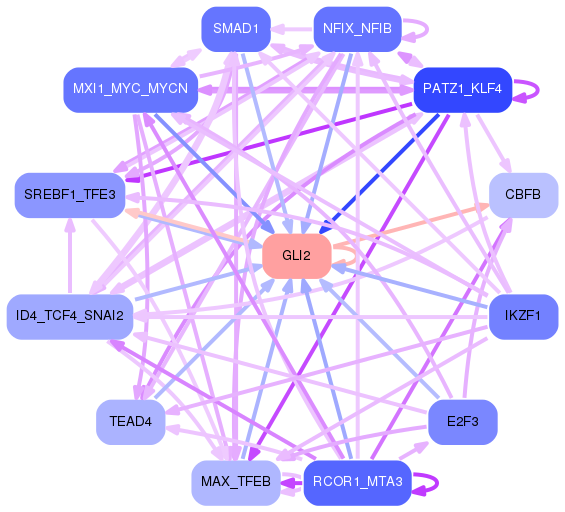
Network of associatons between targets according to the STRING database.

First level regulatory network of GLI2
Gene Ontology Analysis
Gene overrepresentation in biological_process category:
| Log-likelihood per target | Total log-likelihood | Term | Description |
|---|---|---|---|
| 0.3 | 0.8 | GO:1903461 | Okazaki fragment processing involved in mitotic DNA replication(GO:1903461) |
| 0.1 | 0.4 | GO:0051795 | positive regulation of catagen(GO:0051795) |
| 0.1 | 0.3 | GO:1903697 | negative regulation of microvillus assembly(GO:1903697) |
| 0.1 | 0.5 | GO:0090598 | male genitalia morphogenesis(GO:0048808) male anatomical structure morphogenesis(GO:0090598) |
| 0.1 | 0.3 | GO:0090222 | centrosome-templated microtubule nucleation(GO:0090222) |
| 0.1 | 0.4 | GO:0051970 | negative regulation of transmission of nerve impulse(GO:0051970) |
| 0.1 | 0.2 | GO:0046022 | positive regulation of transcription from RNA polymerase II promoter during mitosis(GO:0046022) |
| 0.1 | 0.2 | GO:1904346 | positive regulation of growth rate(GO:0040010) regulation of gastric mucosal blood circulation(GO:1904344) positive regulation of gastric mucosal blood circulation(GO:1904346) gastric mucosal blood circulation(GO:1990768) |
| 0.1 | 0.2 | GO:0021775 | smoothened signaling pathway involved in ventral spinal cord interneuron specification(GO:0021775) smoothened signaling pathway involved in spinal cord motor neuron cell fate specification(GO:0021776) |
| 0.1 | 0.2 | GO:1902746 | regulation of lens fiber cell differentiation(GO:1902746) |
| 0.1 | 0.2 | GO:1903237 | negative regulation of leukocyte tethering or rolling(GO:1903237) |
| 0.1 | 0.2 | GO:0090271 | positive regulation of fibroblast growth factor production(GO:0090271) |
| 0.1 | 0.2 | GO:0002522 | leukocyte migration involved in immune response(GO:0002522) |
| 0.1 | 0.1 | GO:0018171 | peptidyl-cysteine oxidation(GO:0018171) |
| 0.1 | 0.2 | GO:0007621 | negative regulation of female receptivity(GO:0007621) |
| 0.1 | 0.2 | GO:0045799 | positive regulation of chromatin assembly or disassembly(GO:0045799) |
| 0.1 | 0.3 | GO:0031860 | telomeric 3' overhang formation(GO:0031860) |
| 0.1 | 0.3 | GO:0070682 | proteasome regulatory particle assembly(GO:0070682) |
| 0.0 | 0.3 | GO:1904721 | negative regulation of mRNA cleavage(GO:0031438) negative regulation of immunoglobulin secretion(GO:0051025) negative regulation of mRNA endonucleolytic cleavage involved in unfolded protein response(GO:1904721) |
| 0.0 | 0.4 | GO:2000825 | positive regulation of androgen receptor activity(GO:2000825) |
| 0.0 | 0.6 | GO:0043697 | dedifferentiation(GO:0043696) cell dedifferentiation(GO:0043697) |
| 0.0 | 0.2 | GO:1902683 | regulation of receptor localization to synapse(GO:1902683) |
| 0.0 | 0.2 | GO:1904693 | midbrain morphogenesis(GO:1904693) |
| 0.0 | 0.2 | GO:0045872 | regulation of rhodopsin gene expression(GO:0007468) positive regulation of rhodopsin gene expression(GO:0045872) |
| 0.0 | 0.1 | GO:0003095 | pressure natriuresis(GO:0003095) |
| 0.0 | 0.1 | GO:0036369 | transcription factor catabolic process(GO:0036369) cellular response to vitamin B1(GO:0071301) response to formaldehyde(GO:1904404) |
| 0.0 | 0.1 | GO:0002581 | negative regulation of antigen processing and presentation of peptide or polysaccharide antigen via MHC class II(GO:0002581) regulation of antigen processing and presentation of peptide antigen via MHC class II(GO:0002586) |
| 0.0 | 0.2 | GO:0014028 | notochord formation(GO:0014028) |
| 0.0 | 0.1 | GO:2000255 | negative regulation of male germ cell proliferation(GO:2000255) |
| 0.0 | 0.2 | GO:0006651 | diacylglycerol biosynthetic process(GO:0006651) |
| 0.0 | 0.1 | GO:0016237 | lysosomal microautophagy(GO:0016237) piecemeal microautophagy of nucleus(GO:0034727) suppression by virus of host autophagy(GO:0039521) |
| 0.0 | 0.2 | GO:0090285 | negative regulation of protein glycosylation in Golgi(GO:0090285) |
| 0.0 | 0.1 | GO:1903567 | negative regulation of protein localization to cilium(GO:1903565) regulation of protein localization to ciliary membrane(GO:1903567) negative regulation of protein localization to ciliary membrane(GO:1903568) |
| 0.0 | 0.3 | GO:1990253 | cellular response to leucine starvation(GO:1990253) |
| 0.0 | 0.4 | GO:0043985 | histone H4-R3 methylation(GO:0043985) |
| 0.0 | 0.3 | GO:1902412 | regulation of mitotic cytokinesis(GO:1902412) |
| 0.0 | 0.1 | GO:0044209 | AMP salvage(GO:0044209) |
| 0.0 | 0.1 | GO:0042377 | menaquinone catabolic process(GO:0042361) vitamin K catabolic process(GO:0042377) |
| 0.0 | 0.1 | GO:0043323 | regulation of natural killer cell degranulation(GO:0043321) positive regulation of natural killer cell degranulation(GO:0043323) |
| 0.0 | 0.1 | GO:0010760 | negative regulation of macrophage chemotaxis(GO:0010760) |
| 0.0 | 0.2 | GO:0006207 | 'de novo' pyrimidine nucleobase biosynthetic process(GO:0006207) pyrimidine nucleobase biosynthetic process(GO:0019856) |
| 0.0 | 0.1 | GO:0006550 | isoleucine catabolic process(GO:0006550) |
| 0.0 | 0.2 | GO:1904154 | positive regulation of retrograde protein transport, ER to cytosol(GO:1904154) |
| 0.0 | 0.1 | GO:0033615 | mitochondrial proton-transporting ATP synthase complex assembly(GO:0033615) |
| 0.0 | 0.6 | GO:1990845 | adaptive thermogenesis(GO:1990845) |
| 0.0 | 0.1 | GO:0046823 | negative regulation of protein import into nucleus(GO:0042308) negative regulation of nucleocytoplasmic transport(GO:0046823) negative regulation of intracellular protein transport(GO:0090317) negative regulation of protein import(GO:1904590) |
| 0.0 | 0.1 | GO:0050904 | diapedesis(GO:0050904) |
| 0.0 | 0.5 | GO:0006020 | inositol metabolic process(GO:0006020) |
| 0.0 | 0.1 | GO:0001999 | renal response to blood flow involved in circulatory renin-angiotensin regulation of systemic arterial blood pressure(GO:0001999) renin secretion into blood stream(GO:0002001) |
| 0.0 | 0.1 | GO:0006419 | alanyl-tRNA aminoacylation(GO:0006419) |
| 0.0 | 0.1 | GO:0002317 | plasma cell differentiation(GO:0002317) |
| 0.0 | 0.2 | GO:1905098 | negative regulation of guanyl-nucleotide exchange factor activity(GO:1905098) |
| 0.0 | 0.1 | GO:0060032 | notochord regression(GO:0060032) |
| 0.0 | 0.2 | GO:0070236 | regulation of activation-induced cell death of T cells(GO:0070235) negative regulation of activation-induced cell death of T cells(GO:0070236) |
| 0.0 | 0.1 | GO:0002143 | tRNA wobble position uridine thiolation(GO:0002143) |
| 0.0 | 0.4 | GO:0051256 | mitotic spindle midzone assembly(GO:0051256) |
| 0.0 | 0.1 | GO:0060800 | regulation of cell differentiation involved in embryonic placenta development(GO:0060800) |
| 0.0 | 0.1 | GO:0046952 | ketone body catabolic process(GO:0046952) |
| 0.0 | 0.1 | GO:0060040 | retinal bipolar neuron differentiation(GO:0060040) |
| 0.0 | 0.8 | GO:0022038 | corpus callosum development(GO:0022038) |
| 0.0 | 0.2 | GO:1901387 | positive regulation of voltage-gated calcium channel activity(GO:1901387) |
| 0.0 | 0.1 | GO:0045715 | negative regulation of low-density lipoprotein particle receptor biosynthetic process(GO:0045715) |
| 0.0 | 0.1 | GO:0010157 | response to chlorate(GO:0010157) |
| 0.0 | 0.1 | GO:0006121 | mitochondrial electron transport, succinate to ubiquinone(GO:0006121) |
| 0.0 | 0.6 | GO:0016254 | preassembly of GPI anchor in ER membrane(GO:0016254) |
| 0.0 | 0.1 | GO:0002215 | defense response to nematode(GO:0002215) |
| 0.0 | 0.4 | GO:0010510 | regulation of acetyl-CoA biosynthetic process from pyruvate(GO:0010510) |
| 0.0 | 0.0 | GO:0043553 | negative regulation of phosphatidylinositol 3-kinase activity(GO:0043553) |
| 0.0 | 0.1 | GO:0051944 | glial cell-derived neurotrophic factor secretion(GO:0044467) positive regulation of neurotransmitter uptake(GO:0051582) positive regulation of dopamine uptake involved in synaptic transmission(GO:0051586) positive regulation of catecholamine uptake involved in synaptic transmission(GO:0051944) regulation of locomotion involved in locomotory behavior(GO:0090325) regulation of glial cell-derived neurotrophic factor secretion(GO:1900166) positive regulation of glial cell-derived neurotrophic factor secretion(GO:1900168) |
| 0.0 | 0.4 | GO:0005984 | disaccharide metabolic process(GO:0005984) |
| 0.0 | 0.2 | GO:0086047 | Purkinje myocyte action potential(GO:0086017) membrane depolarization during Purkinje myocyte cell action potential(GO:0086047) membrane depolarization during bundle of His cell action potential(GO:0086048) |
| 0.0 | 0.1 | GO:0046504 | ether lipid biosynthetic process(GO:0008611) glycerol ether biosynthetic process(GO:0046504) ether biosynthetic process(GO:1901503) |
| 0.0 | 0.5 | GO:0070933 | histone H4 deacetylation(GO:0070933) |
| 0.0 | 0.1 | GO:1901143 | insulin catabolic process(GO:1901143) |
| 0.0 | 0.0 | GO:0060434 | bronchus morphogenesis(GO:0060434) |
| 0.0 | 0.3 | GO:0015074 | DNA integration(GO:0015074) |
| 0.0 | 0.2 | GO:0038129 | directional guidance of interneurons involved in migration from the subpallium to the cortex(GO:0021840) chemorepulsion involved in interneuron migration from the subpallium to the cortex(GO:0021842) ERBB3 signaling pathway(GO:0038129) |
| 0.0 | 0.3 | GO:0000338 | protein deneddylation(GO:0000338) |
| 0.0 | 0.1 | GO:0045829 | negative regulation of isotype switching(GO:0045829) |
| 0.0 | 0.2 | GO:0035457 | cellular response to interferon-alpha(GO:0035457) |
| 0.0 | 0.1 | GO:0002728 | negative regulation of natural killer cell cytokine production(GO:0002728) |
| 0.0 | 0.2 | GO:0009957 | epidermal cell fate specification(GO:0009957) |
| 0.0 | 0.1 | GO:0061502 | early endosome to recycling endosome transport(GO:0061502) |
| 0.0 | 0.3 | GO:0015693 | magnesium ion transport(GO:0015693) |
| 0.0 | 0.1 | GO:1902741 | interferon-alpha secretion(GO:0072642) regulation of interferon-alpha secretion(GO:1902739) positive regulation of interferon-alpha secretion(GO:1902741) |
| 0.0 | 0.0 | GO:2000502 | negative regulation of natural killer cell chemotaxis(GO:2000502) |
| 0.0 | 0.1 | GO:0045085 | negative regulation of interleukin-2 biosynthetic process(GO:0045085) |
| 0.0 | 0.1 | GO:0060296 | regulation of cilium movement involved in cell motility(GO:0060295) regulation of cilium beat frequency involved in ciliary motility(GO:0060296) regulation of cilium-dependent cell motility(GO:1902019) |
| 0.0 | 0.1 | GO:0002351 | serotonin production involved in inflammatory response(GO:0002351) serotonin secretion involved in inflammatory response(GO:0002442) serotonin secretion by platelet(GO:0002554) |
| 0.0 | 0.2 | GO:0050703 | interleukin-1 alpha secretion(GO:0050703) |
| 0.0 | 0.5 | GO:0071294 | cellular response to zinc ion(GO:0071294) |
| 0.0 | 0.1 | GO:0002949 | tRNA threonylcarbamoyladenosine modification(GO:0002949) |
| 0.0 | 0.2 | GO:0003406 | retinal pigment epithelium development(GO:0003406) |
| 0.0 | 0.2 | GO:0035826 | rubidium ion transport(GO:0035826) regulation of rubidium ion transport(GO:2000680) |
| 0.0 | 0.1 | GO:0003335 | corneocyte development(GO:0003335) |
| 0.0 | 0.3 | GO:0034975 | protein folding in endoplasmic reticulum(GO:0034975) |
| 0.0 | 0.2 | GO:0001826 | inner cell mass cell differentiation(GO:0001826) |
| 0.0 | 0.1 | GO:1902896 | terminal web assembly(GO:1902896) |
| 0.0 | 0.1 | GO:0035752 | lysosomal lumen pH elevation(GO:0035752) |
| 0.0 | 0.1 | GO:0070358 | actin polymerization-dependent cell motility(GO:0070358) |
| 0.0 | 0.0 | GO:0051102 | DNA ligation involved in DNA recombination(GO:0051102) |
| 0.0 | 0.2 | GO:2000580 | positive regulation of microtubule motor activity(GO:2000576) regulation of ATP-dependent microtubule motor activity, plus-end-directed(GO:2000580) positive regulation of ATP-dependent microtubule motor activity, plus-end-directed(GO:2000582) |
| 0.0 | 0.2 | GO:2000271 | positive regulation of fibroblast apoptotic process(GO:2000271) |
| 0.0 | 0.0 | GO:0043366 | beta selection(GO:0043366) |
| 0.0 | 0.1 | GO:0044800 | fusion of virus membrane with host plasma membrane(GO:0019064) membrane fusion involved in viral entry into host cell(GO:0039663) multi-organism membrane fusion(GO:0044800) |
| 0.0 | 0.1 | GO:0010693 | negative regulation of alkaline phosphatase activity(GO:0010693) |
| 0.0 | 0.1 | GO:0097012 | cellular response to granulocyte macrophage colony-stimulating factor stimulus(GO:0097011) response to granulocyte macrophage colony-stimulating factor(GO:0097012) |
| 0.0 | 0.1 | GO:0061343 | cell adhesion involved in heart morphogenesis(GO:0061343) |
| 0.0 | 0.1 | GO:0035720 | intraciliary anterograde transport(GO:0035720) ciliary receptor clustering involved in smoothened signaling pathway(GO:0060830) |
| 0.0 | 0.2 | GO:0030238 | male sex determination(GO:0030238) |
| 0.0 | 0.2 | GO:0070070 | proton-transporting V-type ATPase complex assembly(GO:0070070) vacuolar proton-transporting V-type ATPase complex assembly(GO:0070072) |
| 0.0 | 0.1 | GO:0075713 | establishment of integrated proviral latency(GO:0075713) |
| 0.0 | 0.0 | GO:0007341 | penetration of zona pellucida(GO:0007341) |
| 0.0 | 0.1 | GO:0019556 | histidine catabolic process to glutamate and formamide(GO:0019556) histidine catabolic process to glutamate and formate(GO:0019557) formamide metabolic process(GO:0043606) |
| 0.0 | 0.0 | GO:0042732 | D-xylose metabolic process(GO:0042732) |
| 0.0 | 0.1 | GO:0007498 | mesoderm development(GO:0007498) |
| 0.0 | 0.2 | GO:0045023 | G0 to G1 transition(GO:0045023) |
| 0.0 | 0.0 | GO:0097205 | glomerular filtration(GO:0003094) renal filtration(GO:0097205) |
| 0.0 | 0.0 | GO:2000506 | negative regulation of energy homeostasis(GO:2000506) |
| 0.0 | 0.3 | GO:0006488 | dolichol-linked oligosaccharide biosynthetic process(GO:0006488) |
| 0.0 | 0.0 | GO:0046684 | response to pyrethroid(GO:0046684) |
| 0.0 | 0.3 | GO:0016180 | snRNA processing(GO:0016180) |
| 0.0 | 0.1 | GO:0071043 | CUT catabolic process(GO:0071034) CUT metabolic process(GO:0071043) polyadenylation-dependent snoRNA 3'-end processing(GO:0071051) |
| 0.0 | 0.2 | GO:0098789 | pre-mRNA cleavage required for polyadenylation(GO:0098789) |
| 0.0 | 0.1 | GO:0043248 | proteasome assembly(GO:0043248) |
| 0.0 | 0.0 | GO:0034970 | histone H3-R2 methylation(GO:0034970) |
| 0.0 | 0.0 | GO:0010901 | regulation of very-low-density lipoprotein particle remodeling(GO:0010901) |
| 0.0 | 0.1 | GO:0070863 | positive regulation of protein exit from endoplasmic reticulum(GO:0070863) |
| 0.0 | 0.1 | GO:0051549 | positive regulation of keratinocyte migration(GO:0051549) |
| 0.0 | 0.0 | GO:2000824 | negative regulation of androgen receptor activity(GO:2000824) |
| 0.0 | 0.1 | GO:0051725 | protein de-ADP-ribosylation(GO:0051725) |
| 0.0 | 0.1 | GO:0006701 | progesterone biosynthetic process(GO:0006701) |
| 0.0 | 0.0 | GO:0021849 | neuroblast division in subventricular zone(GO:0021849) |
| 0.0 | 0.1 | GO:1902617 | response to fluoride(GO:1902617) |
| 0.0 | 0.2 | GO:1904896 | ESCRT complex disassembly(GO:1904896) ESCRT III complex disassembly(GO:1904903) |
| 0.0 | 0.1 | GO:0032661 | regulation of interleukin-18 production(GO:0032661) |
| 0.0 | 0.1 | GO:1904751 | positive regulation of protein localization to nucleolus(GO:1904751) |
| 0.0 | 0.1 | GO:0098704 | fructose import(GO:0032445) carbohydrate import into cell(GO:0097319) carbohydrate import across plasma membrane(GO:0098704) fructose import across plasma membrane(GO:1990539) |
| 0.0 | 0.1 | GO:1900625 | regulation of monocyte aggregation(GO:1900623) positive regulation of monocyte aggregation(GO:1900625) |
Gene overrepresentation in cellular_component category:
| Log-likelihood per target | Total log-likelihood | Term | Description |
|---|---|---|---|
| 0.1 | 0.3 | GO:1990131 | Gtr1-Gtr2 GTPase complex(GO:1990131) |
| 0.0 | 0.2 | GO:0043291 | RAVE complex(GO:0043291) |
| 0.0 | 0.3 | GO:0036449 | microtubule minus-end(GO:0036449) |
| 0.0 | 0.7 | GO:0072546 | ER membrane protein complex(GO:0072546) |
| 0.0 | 0.1 | GO:0031838 | haptoglobin-hemoglobin complex(GO:0031838) |
| 0.0 | 0.5 | GO:0000506 | glycosylphosphatidylinositol-N-acetylglucosaminyltransferase (GPI-GnT) complex(GO:0000506) |
| 0.0 | 0.2 | GO:0090571 | RNA polymerase II transcription repressor complex(GO:0090571) |
| 0.0 | 0.2 | GO:0005958 | DNA-dependent protein kinase-DNA ligase 4 complex(GO:0005958) |
| 0.0 | 0.1 | GO:0097636 | intrinsic component of autophagosome membrane(GO:0097636) integral component of autophagosome membrane(GO:0097637) |
| 0.0 | 0.1 | GO:0045283 | mitochondrial respiratory chain complex II, succinate dehydrogenase complex (ubiquinone)(GO:0005749) succinate dehydrogenase complex (ubiquinone)(GO:0045257) respiratory chain complex II(GO:0045273) succinate dehydrogenase complex(GO:0045281) fumarate reductase complex(GO:0045283) |
| 0.0 | 0.5 | GO:0000235 | astral microtubule(GO:0000235) aster(GO:0005818) |
| 0.0 | 0.3 | GO:0072487 | MSL complex(GO:0072487) |
| 0.0 | 0.3 | GO:0030870 | Mre11 complex(GO:0030870) |
| 0.0 | 0.2 | GO:0005784 | Sec61 translocon complex(GO:0005784) translocon complex(GO:0071256) |
| 0.0 | 0.1 | GO:0000801 | central element(GO:0000801) |
| 0.0 | 0.1 | GO:0031262 | Ndc80 complex(GO:0031262) |
| 0.0 | 0.1 | GO:0071062 | alphav-beta3 integrin-vitronectin complex(GO:0071062) |
| 0.0 | 0.1 | GO:0031372 | UBC13-MMS2 complex(GO:0031372) |
| 0.0 | 0.1 | GO:0031501 | mannosyltransferase complex(GO:0031501) |
| 0.0 | 0.2 | GO:0005787 | signal peptidase complex(GO:0005787) |
| 0.0 | 0.1 | GO:1990604 | IRE1-TRAF2-ASK1 complex(GO:1990604) |
| 0.0 | 0.5 | GO:0000800 | lateral element(GO:0000800) |
| 0.0 | 0.3 | GO:0032039 | integrator complex(GO:0032039) |
| 0.0 | 0.2 | GO:0097255 | R2TP complex(GO:0097255) |
| 0.0 | 0.2 | GO:0042788 | polysomal ribosome(GO:0042788) |
| 0.0 | 0.2 | GO:0042719 | mitochondrial intermembrane space protein transporter complex(GO:0042719) |
| 0.0 | 0.2 | GO:0005793 | endoplasmic reticulum-Golgi intermediate compartment(GO:0005793) |
| 0.0 | 0.1 | GO:0032593 | insulin-responsive compartment(GO:0032593) |
| 0.0 | 0.1 | GO:0031466 | Cul5-RING ubiquitin ligase complex(GO:0031466) |
| 0.0 | 0.1 | GO:0034688 | integrin alphaM-beta2 complex(GO:0034688) |
| 0.0 | 0.1 | GO:0031417 | NatC complex(GO:0031417) |
| 0.0 | 0.1 | GO:0034669 | integrin alpha4-beta7 complex(GO:0034669) |
| 0.0 | 0.3 | GO:0008540 | proteasome regulatory particle, base subcomplex(GO:0008540) |
| 0.0 | 0.0 | GO:0098800 | inner mitochondrial membrane protein complex(GO:0098800) |
| 0.0 | 0.2 | GO:0097487 | platelet dense granule membrane(GO:0031088) multivesicular body, internal vesicle(GO:0097487) |
| 0.0 | 0.6 | GO:0046658 | anchored component of plasma membrane(GO:0046658) |
| 0.0 | 0.1 | GO:0044294 | dendritic growth cone(GO:0044294) |
| 0.0 | 0.3 | GO:0042599 | lamellar body(GO:0042599) |
| 0.0 | 0.3 | GO:0008385 | IkappaB kinase complex(GO:0008385) |
| 0.0 | 0.1 | GO:0035692 | macrophage migration inhibitory factor receptor complex(GO:0035692) |
| 0.0 | 0.2 | GO:0032433 | filopodium tip(GO:0032433) |
| 0.0 | 0.1 | GO:0036157 | outer dynein arm(GO:0036157) |
| 0.0 | 0.1 | GO:0001405 | presequence translocase-associated import motor(GO:0001405) |
| 0.0 | 0.1 | GO:1990031 | pinceau fiber(GO:1990031) |
| 0.0 | 0.1 | GO:0030666 | endocytic vesicle membrane(GO:0030666) |
| 0.0 | 0.1 | GO:0097165 | nuclear stress granule(GO:0097165) |
Gene overrepresentation in molecular_function category:
| Log-likelihood per target | Total log-likelihood | Term | Description |
|---|---|---|---|
| 0.2 | 0.6 | GO:0098770 | FBXO family protein binding(GO:0098770) |
| 0.1 | 0.1 | GO:0032454 | histone demethylase activity (H3-K9 specific)(GO:0032454) |
| 0.1 | 0.2 | GO:0031768 | growth hormone-releasing hormone activity(GO:0016608) ghrelin receptor binding(GO:0031768) |
| 0.1 | 0.4 | GO:0004966 | galanin receptor activity(GO:0004966) |
| 0.1 | 0.5 | GO:0017077 | oxidative phosphorylation uncoupler activity(GO:0017077) |
| 0.1 | 0.9 | GO:0003910 | DNA ligase (ATP) activity(GO:0003910) |
| 0.1 | 0.7 | GO:0016494 | C-X-C chemokine receptor activity(GO:0016494) |
| 0.1 | 0.5 | GO:0033857 | diphosphoinositol-pentakisphosphate kinase activity(GO:0033857) |
| 0.1 | 0.2 | GO:0019961 | interferon binding(GO:0019961) |
| 0.1 | 0.2 | GO:0009041 | uridylate kinase activity(GO:0009041) |
| 0.1 | 0.2 | GO:0071633 | dihydroceramidase activity(GO:0071633) |
| 0.1 | 0.4 | GO:0004741 | [pyruvate dehydrogenase (lipoamide)] phosphatase activity(GO:0004741) |
| 0.0 | 0.2 | GO:0004727 | prenylated protein tyrosine phosphatase activity(GO:0004727) |
| 0.0 | 0.3 | GO:0060698 | endoribonuclease inhibitor activity(GO:0060698) |
| 0.0 | 0.1 | GO:0038131 | neuregulin receptor activity(GO:0038131) |
| 0.0 | 0.1 | GO:0004584 | dolichyl-phosphate-mannose-glycolipid alpha-mannosyltransferase activity(GO:0004584) |
| 0.0 | 0.4 | GO:0043533 | inositol 1,3,4,5 tetrakisphosphate binding(GO:0043533) |
| 0.0 | 0.2 | GO:0070579 | methylcytosine dioxygenase activity(GO:0070579) |
| 0.0 | 0.1 | GO:0030492 | hemoglobin binding(GO:0030492) |
| 0.0 | 0.3 | GO:0005119 | smoothened binding(GO:0005119) |
| 0.0 | 0.5 | GO:0017176 | phosphatidylinositol N-acetylglucosaminyltransferase activity(GO:0017176) |
| 0.0 | 0.1 | GO:0061663 | NEDD8 ligase activity(GO:0061663) |
| 0.0 | 0.1 | GO:0070052 | collagen V binding(GO:0070052) |
| 0.0 | 0.1 | GO:0008177 | succinate dehydrogenase (ubiquinone) activity(GO:0008177) |
| 0.0 | 0.1 | GO:0003858 | 3-hydroxybutyrate dehydrogenase activity(GO:0003858) |
| 0.0 | 0.4 | GO:0047134 | protein-disulfide reductase activity(GO:0047134) |
| 0.0 | 0.1 | GO:0019778 | Atg12 activating enzyme activity(GO:0019778) Atg8 activating enzyme activity(GO:0019779) |
| 0.0 | 0.2 | GO:0019828 | aspartic-type endopeptidase inhibitor activity(GO:0019828) |
| 0.0 | 0.4 | GO:0031681 | G-protein beta-subunit binding(GO:0031681) |
| 0.0 | 0.1 | GO:0008384 | IkappaB kinase activity(GO:0008384) |
| 0.0 | 0.2 | GO:0004144 | diacylglycerol O-acyltransferase activity(GO:0004144) |
| 0.0 | 0.1 | GO:0018685 | alkane 1-monooxygenase activity(GO:0018685) |
| 0.0 | 0.1 | GO:0031626 | beta-endorphin binding(GO:0031626) |
| 0.0 | 0.3 | GO:0008379 | thioredoxin peroxidase activity(GO:0008379) |
| 0.0 | 0.1 | GO:0003998 | acylphosphatase activity(GO:0003998) |
| 0.0 | 0.1 | GO:0086062 | voltage-gated sodium channel activity involved in Purkinje myocyte action potential(GO:0086062) |
| 0.0 | 0.1 | GO:0033858 | N-acetylgalactosamine kinase activity(GO:0033858) |
| 0.0 | 0.1 | GO:0004813 | alanine-tRNA ligase activity(GO:0004813) |
| 0.0 | 0.1 | GO:0051500 | D-aminoacyl-tRNA deacylase activity(GO:0051499) D-tyrosyl-tRNA(Tyr) deacylase activity(GO:0051500) |
| 0.0 | 0.2 | GO:0004614 | phosphoglucomutase activity(GO:0004614) |
| 0.0 | 0.1 | GO:0046573 | lactonohydrolase activity(GO:0046573) acyl-L-homoserine-lactone lactonohydrolase activity(GO:0102007) |
| 0.0 | 0.6 | GO:0005003 | ephrin receptor activity(GO:0005003) |
| 0.0 | 0.1 | GO:0008184 | glycogen phosphorylase activity(GO:0008184) |
| 0.0 | 0.1 | GO:0001591 | dopamine neurotransmitter receptor activity, coupled via Gi/Go(GO:0001591) |
| 0.0 | 0.2 | GO:0004791 | thioredoxin-disulfide reductase activity(GO:0004791) |
| 0.0 | 0.1 | GO:0080019 | fatty-acyl-CoA reductase (alcohol-forming) activity(GO:0080019) |
| 0.0 | 0.2 | GO:0046920 | alpha-(1->3)-fucosyltransferase activity(GO:0046920) |
| 0.0 | 0.1 | GO:0061575 | cyclin-dependent protein serine/threonine kinase activator activity(GO:0061575) |
| 0.0 | 0.1 | GO:0052654 | branched-chain-amino-acid transaminase activity(GO:0004084) L-leucine transaminase activity(GO:0052654) L-valine transaminase activity(GO:0052655) L-isoleucine transaminase activity(GO:0052656) |
| 0.0 | 0.1 | GO:0003875 | ADP-ribosylarginine hydrolase activity(GO:0003875) |
| 0.0 | 0.2 | GO:0005176 | ErbB-2 class receptor binding(GO:0005176) |
| 0.0 | 0.2 | GO:0043426 | MRF binding(GO:0043426) |
| 0.0 | 0.2 | GO:0001665 | alpha-N-acetylgalactosaminide alpha-2,6-sialyltransferase activity(GO:0001665) |
| 0.0 | 0.2 | GO:0035727 | lysophosphatidic acid binding(GO:0035727) |
| 0.0 | 0.1 | GO:1990932 | 5.8S rRNA binding(GO:1990932) |
| 0.0 | 0.4 | GO:0005068 | transmembrane receptor protein tyrosine kinase adaptor activity(GO:0005068) |
| 0.0 | 0.2 | GO:0019960 | C-X3-C chemokine binding(GO:0019960) |
| 0.0 | 0.1 | GO:0004127 | cytidylate kinase activity(GO:0004127) |
| 0.0 | 0.2 | GO:0070324 | thyroid hormone binding(GO:0070324) |
| 0.0 | 0.0 | GO:0004366 | glycerol-3-phosphate O-acyltransferase activity(GO:0004366) |
| 0.0 | 0.1 | GO:0042289 | MHC class II protein binding(GO:0042289) |
| 0.0 | 0.1 | GO:0000035 | acyl binding(GO:0000035) |
| 0.0 | 0.0 | GO:0036313 | phosphatidylinositol 3-kinase catalytic subunit binding(GO:0036313) |
| 0.0 | 0.3 | GO:0015095 | magnesium ion transmembrane transporter activity(GO:0015095) |
| 0.0 | 0.1 | GO:0005502 | 11-cis retinal binding(GO:0005502) |
| 0.0 | 0.0 | GO:0034736 | sterol O-acyltransferase activity(GO:0004772) cholesterol O-acyltransferase activity(GO:0034736) |
| 0.0 | 0.1 | GO:0017159 | pantetheine hydrolase activity(GO:0017159) |
| 0.0 | 0.1 | GO:0032395 | MHC class II receptor activity(GO:0032395) |
| 0.0 | 0.1 | GO:0030369 | ICAM-3 receptor activity(GO:0030369) |
| 0.0 | 0.2 | GO:0050786 | RAGE receptor binding(GO:0050786) |
| 0.0 | 0.0 | GO:0051377 | mannose-ethanolamine phosphotransferase activity(GO:0051377) |
| 0.0 | 0.1 | GO:0047493 | sphingomyelin synthase activity(GO:0033188) ceramide cholinephosphotransferase activity(GO:0047493) |
| 0.0 | 0.2 | GO:0055056 | D-glucose transmembrane transporter activity(GO:0055056) |
| 0.0 | 0.1 | GO:0005124 | scavenger receptor binding(GO:0005124) |
| 0.0 | 0.1 | GO:0005353 | fructose transmembrane transporter activity(GO:0005353) |
Gene overrepresentation in C2:CP category:
| Log-likelihood per target | Total log-likelihood | Term | Description |
|---|---|---|---|
| 0.0 | 0.1 | PID IL2 PI3K PATHWAY | IL2 signaling events mediated by PI3K |
Gene overrepresentation in C2:CP:REACTOME category:
| Log-likelihood per target | Total log-likelihood | Term | Description |
|---|---|---|---|
| 0.0 | 1.1 | REACTOME EARLY PHASE OF HIV LIFE CYCLE | Genes involved in Early Phase of HIV Life Cycle |
| 0.0 | 0.4 | REACTOME DIGESTION OF DIETARY CARBOHYDRATE | Genes involved in Digestion of dietary carbohydrate |
| 0.0 | 0.4 | REACTOME SYNTHESIS SECRETION AND DEACYLATION OF GHRELIN | Genes involved in Synthesis, Secretion, and Deacylation of Ghrelin |
| 0.0 | 0.4 | REACTOME REGULATION OF PYRUVATE DEHYDROGENASE PDH COMPLEX | Genes involved in Regulation of pyruvate dehydrogenase (PDH) complex |
| 0.0 | 0.6 | REACTOME SYNTHESIS OF GLYCOSYLPHOSPHATIDYLINOSITOL GPI | Genes involved in Synthesis of glycosylphosphatidylinositol (GPI) |
| 0.0 | 0.3 | REACTOME SYNTHESIS SECRETION AND INACTIVATION OF GLP1 | Genes involved in Synthesis, Secretion, and Inactivation of Glucagon-like Peptide-1 (GLP-1) |
| 0.0 | 0.1 | REACTOME HORMONE LIGAND BINDING RECEPTORS | Genes involved in Hormone ligand-binding receptors |
| 0.0 | 0.3 | REACTOME FACILITATIVE NA INDEPENDENT GLUCOSE TRANSPORTERS | Genes involved in Facilitative Na+-independent glucose transporters |