Project
A549 cells infected with SARS-CoV-2 Analysis Results (GEO series: GSE147507)
Navigation
Downloads
Results for GCAGCAU
Z-value: 0.88
Motif logo

miRNA associated with seed GCAGCAU
| Name | miRBASE accession |
|---|---|
|
hsa-miR-103a-3p
|
MIMAT0000101 |
|
hsa-miR-107
|
MIMAT0000104 |
Activity profile of GCAGCAU motif
Sorted Z-values of GCAGCAU motif
| Promoter | Log-likelihood | Transcript | Gene | Gene Info |
|---|---|---|---|---|
| chr15_-_49447835 | 0.55 |
ENST00000388901.5
ENST00000299259.6 |
COPS2
|
COP9 signalosome subunit 2 |
| chr12_+_105501487 | 0.54 |
ENST00000332180.5
|
KIAA1033
|
KIAA1033 |
| chr14_+_32546485 | 0.51 |
ENST00000345122.3
ENST00000432921.1 ENST00000433497.1 |
ARHGAP5
|
Rho GTPase activating protein 5 |
| chr3_-_167452614 | 0.48 |
ENST00000392750.2
ENST00000464360.1 ENST00000492139.1 ENST00000471885.1 ENST00000470131.1 |
PDCD10
|
programmed cell death 10 |
| chr3_+_88188254 | 0.47 |
ENST00000309495.5
|
ZNF654
|
zinc finger protein 654 |
| chr7_-_95225768 | 0.47 |
ENST00000005178.5
|
PDK4
|
pyruvate dehydrogenase kinase, isozyme 4 |
| chr11_+_109964087 | 0.46 |
ENST00000278590.3
|
ZC3H12C
|
zinc finger CCCH-type containing 12C |
| chr8_-_66546439 | 0.45 |
ENST00000276569.3
|
ARMC1
|
armadillo repeat containing 1 |
| chr1_-_108507631 | 0.45 |
ENST00000527011.1
ENST00000370056.4 |
VAV3
|
vav 3 guanine nucleotide exchange factor |
| chr4_+_174089904 | 0.45 |
ENST00000265000.4
|
GALNT7
|
UDP-N-acetyl-alpha-D-galactosamine:polypeptide N-acetylgalactosaminyltransferase 7 (GalNAc-T7) |
| chr5_+_102455853 | 0.44 |
ENST00000515845.1
ENST00000321521.9 ENST00000507921.1 |
PPIP5K2
|
diphosphoinositol pentakisphosphate kinase 2 |
| chr4_+_52709229 | 0.43 |
ENST00000334635.5
ENST00000381441.3 ENST00000381437.4 |
DCUN1D4
|
DCN1, defective in cullin neddylation 1, domain containing 4 |
| chr8_+_87354945 | 0.42 |
ENST00000517970.1
|
WWP1
|
WW domain containing E3 ubiquitin protein ligase 1 |
| chr11_+_76571911 | 0.40 |
ENST00000534206.1
ENST00000532485.1 ENST00000526597.1 ENST00000533873.1 ENST00000538157.1 |
ACER3
|
alkaline ceramidase 3 |
| chr14_+_96829814 | 0.39 |
ENST00000555181.1
ENST00000553699.1 ENST00000554182.1 |
GSKIP
|
GSK3B interacting protein |
| chr4_-_76598296 | 0.39 |
ENST00000395719.3
|
G3BP2
|
GTPase activating protein (SH3 domain) binding protein 2 |
| chr12_+_104359576 | 0.38 |
ENST00000392872.3
ENST00000436021.2 |
TDG
|
thymine-DNA glycosylase |
| chr10_-_119806085 | 0.38 |
ENST00000355624.3
|
RAB11FIP2
|
RAB11 family interacting protein 2 (class I) |
| chrX_+_72783026 | 0.38 |
ENST00000373504.6
ENST00000373502.5 |
CHIC1
|
cysteine-rich hydrophobic domain 1 |
| chr1_-_240775447 | 0.38 |
ENST00000318160.4
|
GREM2
|
gremlin 2, DAN family BMP antagonist |
| chr1_+_78470530 | 0.36 |
ENST00000370763.5
|
DNAJB4
|
DnaJ (Hsp40) homolog, subfamily B, member 4 |
| chr2_-_219925189 | 0.36 |
ENST00000295731.6
|
IHH
|
indian hedgehog |
| chr12_-_22697343 | 0.35 |
ENST00000446597.1
ENST00000536386.1 ENST00000396028.2 ENST00000545552.1 ENST00000544930.1 ENST00000333957.4 |
C2CD5
|
C2 calcium-dependent domain containing 5 |
| chr9_+_91003271 | 0.35 |
ENST00000375859.3
ENST00000541629.1 |
SPIN1
|
spindlin 1 |
| chr17_-_45266542 | 0.35 |
ENST00000531206.1
ENST00000527547.1 ENST00000446365.2 ENST00000575483.1 ENST00000066544.3 |
CDC27
|
cell division cycle 27 |
| chr15_-_34502278 | 0.35 |
ENST00000559515.1
ENST00000256544.3 ENST00000560108.1 ENST00000559462.1 |
KATNBL1
|
katanin p80 subunit B-like 1 |
| chr12_-_120884175 | 0.35 |
ENST00000546954.1
|
TRIAP1
|
TP53 regulated inhibitor of apoptosis 1 |
| chr15_-_65809581 | 0.34 |
ENST00000341861.5
|
DPP8
|
dipeptidyl-peptidase 8 |
| chr7_-_92463210 | 0.34 |
ENST00000265734.4
|
CDK6
|
cyclin-dependent kinase 6 |
| chr20_-_5591626 | 0.33 |
ENST00000379019.4
|
GPCPD1
|
glycerophosphocholine phosphodiesterase GDE1 homolog (S. cerevisiae) |
| chr3_-_88108192 | 0.33 |
ENST00000309534.6
|
CGGBP1
|
CGG triplet repeat binding protein 1 |
| chr4_+_140222609 | 0.33 |
ENST00000296543.5
ENST00000398947.1 |
NAA15
|
N(alpha)-acetyltransferase 15, NatA auxiliary subunit |
| chr5_-_59189545 | 0.32 |
ENST00000340635.6
|
PDE4D
|
phosphodiesterase 4D, cAMP-specific |
| chrX_-_109561294 | 0.31 |
ENST00000372059.2
ENST00000262844.5 |
AMMECR1
|
Alport syndrome, mental retardation, midface hypoplasia and elliptocytosis chromosomal region gene 1 |
| chr14_+_53196872 | 0.31 |
ENST00000442123.2
ENST00000354586.4 |
STYX
|
serine/threonine/tyrosine interacting protein |
| chr9_-_127905736 | 0.31 |
ENST00000336505.6
ENST00000373549.4 |
SCAI
|
suppressor of cancer cell invasion |
| chr12_+_66217911 | 0.31 |
ENST00000403681.2
|
HMGA2
|
high mobility group AT-hook 2 |
| chr12_-_44200052 | 0.31 |
ENST00000548315.1
ENST00000552521.1 ENST00000546662.1 ENST00000548403.1 ENST00000546506.1 |
TWF1
|
twinfilin actin-binding protein 1 |
| chr14_-_57735528 | 0.30 |
ENST00000340918.7
ENST00000413566.2 |
EXOC5
|
exocyst complex component 5 |
| chr4_-_78740511 | 0.30 |
ENST00000504123.1
ENST00000264903.4 ENST00000515441.1 |
CNOT6L
|
CCR4-NOT transcription complex, subunit 6-like |
| chr5_-_111093406 | 0.29 |
ENST00000379671.3
|
NREP
|
neuronal regeneration related protein |
| chr20_-_13765526 | 0.29 |
ENST00000202816.1
|
ESF1
|
ESF1, nucleolar pre-rRNA processing protein, homolog (S. cerevisiae) |
| chr10_+_95653687 | 0.29 |
ENST00000371408.3
ENST00000427197.1 |
SLC35G1
|
solute carrier family 35, member G1 |
| chr17_+_30264014 | 0.29 |
ENST00000322652.5
ENST00000580398.1 |
SUZ12
|
SUZ12 polycomb repressive complex 2 subunit |
| chr18_+_158513 | 0.29 |
ENST00000400266.3
ENST00000580410.1 ENST00000383589.2 ENST00000261601.7 |
USP14
|
ubiquitin specific peptidase 14 (tRNA-guanine transglycosylase) |
| chr8_-_124286735 | 0.29 |
ENST00000395571.3
|
ZHX1
|
zinc fingers and homeoboxes 1 |
| chr1_-_70671216 | 0.28 |
ENST00000370952.3
|
LRRC40
|
leucine rich repeat containing 40 |
| chr11_-_82782861 | 0.28 |
ENST00000524635.1
ENST00000526205.1 ENST00000527633.1 ENST00000533486.1 ENST00000533276.2 |
RAB30
|
RAB30, member RAS oncogene family |
| chr5_-_132299313 | 0.27 |
ENST00000265343.5
|
AFF4
|
AF4/FMR2 family, member 4 |
| chr1_+_26438289 | 0.27 |
ENST00000374271.4
ENST00000374269.1 |
PDIK1L
|
PDLIM1 interacting kinase 1 like |
| chrX_+_95939711 | 0.27 |
ENST00000373049.4
ENST00000324765.8 |
DIAPH2
|
diaphanous-related formin 2 |
| chr11_+_77300669 | 0.27 |
ENST00000313578.3
|
AQP11
|
aquaporin 11 |
| chr12_-_31479045 | 0.27 |
ENST00000539409.1
ENST00000395766.1 |
FAM60A
|
family with sequence similarity 60, member A |
| chr5_+_65440032 | 0.26 |
ENST00000334121.6
|
SREK1
|
splicing regulatory glutamine/lysine-rich protein 1 |
| chr14_-_89259080 | 0.25 |
ENST00000554922.1
ENST00000352093.5 |
EML5
|
echinoderm microtubule associated protein like 5 |
| chr7_-_82073109 | 0.25 |
ENST00000356860.3
|
CACNA2D1
|
calcium channel, voltage-dependent, alpha 2/delta subunit 1 |
| chr3_+_179065474 | 0.25 |
ENST00000471841.1
ENST00000280653.7 |
MFN1
|
mitofusin 1 |
| chr9_-_127952032 | 0.24 |
ENST00000456642.1
ENST00000373546.3 ENST00000373547.4 |
PPP6C
|
protein phosphatase 6, catalytic subunit |
| chrX_-_34675391 | 0.24 |
ENST00000275954.3
|
TMEM47
|
transmembrane protein 47 |
| chr7_+_116502527 | 0.24 |
ENST00000361183.3
|
CAPZA2
|
capping protein (actin filament) muscle Z-line, alpha 2 |
| chr5_-_137368708 | 0.24 |
ENST00000033079.3
|
FAM13B
|
family with sequence similarity 13, member B |
| chr2_-_55844720 | 0.24 |
ENST00000345102.5
ENST00000272313.5 ENST00000407823.3 |
SMEK2
|
SMEK homolog 2, suppressor of mek1 (Dictyostelium) |
| chr4_+_26585538 | 0.23 |
ENST00000264866.4
|
TBC1D19
|
TBC1 domain family, member 19 |
| chr8_+_59465728 | 0.22 |
ENST00000260130.4
ENST00000422546.2 ENST00000447182.2 ENST00000413219.2 ENST00000424270.2 ENST00000523483.1 ENST00000520168.1 |
SDCBP
|
syndecan binding protein (syntenin) |
| chr21_+_35445827 | 0.22 |
ENST00000608209.1
ENST00000381151.3 |
SLC5A3
SLC5A3
|
sodium/myo-inositol cotransporter solute carrier family 5 (sodium/myo-inositol cotransporter), member 3 |
| chr5_+_67511524 | 0.22 |
ENST00000521381.1
ENST00000521657.1 |
PIK3R1
|
phosphoinositide-3-kinase, regulatory subunit 1 (alpha) |
| chr2_-_71454185 | 0.22 |
ENST00000244221.8
|
PAIP2B
|
poly(A) binding protein interacting protein 2B |
| chr5_+_153418466 | 0.22 |
ENST00000522782.1
ENST00000439768.2 ENST00000436816.1 ENST00000322602.5 ENST00000522177.1 ENST00000520899.1 |
MFAP3
|
microfibrillar-associated protein 3 |
| chr11_+_118230287 | 0.21 |
ENST00000252108.3
ENST00000431736.2 |
UBE4A
|
ubiquitination factor E4A |
| chr13_+_20532807 | 0.21 |
ENST00000382869.3
ENST00000382881.3 |
ZMYM2
|
zinc finger, MYM-type 2 |
| chr10_+_54074033 | 0.21 |
ENST00000373970.3
|
DKK1
|
dickkopf WNT signaling pathway inhibitor 1 |
| chr3_-_123304017 | 0.21 |
ENST00000383657.5
|
PTPLB
|
protein tyrosine phosphatase-like (proline instead of catalytic arginine), member b |
| chr1_+_93913713 | 0.21 |
ENST00000604705.1
ENST00000370253.2 |
FNBP1L
|
formin binding protein 1-like |
| chr21_-_16437255 | 0.21 |
ENST00000400199.1
ENST00000400202.1 |
NRIP1
|
nuclear receptor interacting protein 1 |
| chrX_-_20284958 | 0.21 |
ENST00000379565.3
|
RPS6KA3
|
ribosomal protein S6 kinase, 90kDa, polypeptide 3 |
| chr10_+_98592009 | 0.20 |
ENST00000540664.1
ENST00000371103.3 |
LCOR
|
ligand dependent nuclear receptor corepressor |
| chr5_-_98262240 | 0.20 |
ENST00000284049.3
|
CHD1
|
chromodomain helicase DNA binding protein 1 |
| chr12_-_39837192 | 0.20 |
ENST00000361961.3
ENST00000395670.3 |
KIF21A
|
kinesin family member 21A |
| chr2_-_46385 | 0.20 |
ENST00000327669.4
|
FAM110C
|
family with sequence similarity 110, member C |
| chr8_+_96145974 | 0.19 |
ENST00000315367.3
|
PLEKHF2
|
pleckstrin homology domain containing, family F (with FYVE domain) member 2 |
| chr12_-_102513843 | 0.19 |
ENST00000551744.2
ENST00000552283.1 |
NUP37
|
nucleoporin 37kDa |
| chr1_-_171711387 | 0.19 |
ENST00000236192.7
|
VAMP4
|
vesicle-associated membrane protein 4 |
| chr4_+_6784401 | 0.19 |
ENST00000425103.1
ENST00000307659.5 |
KIAA0232
|
KIAA0232 |
| chr8_-_12612962 | 0.19 |
ENST00000398246.3
|
LONRF1
|
LON peptidase N-terminal domain and ring finger 1 |
| chr1_+_78245303 | 0.19 |
ENST00000370791.3
ENST00000443751.2 |
FAM73A
|
family with sequence similarity 73, member A |
| chr3_+_152017181 | 0.19 |
ENST00000498502.1
ENST00000324196.5 ENST00000545754.1 ENST00000357472.3 |
MBNL1
|
muscleblind-like splicing regulator 1 |
| chr2_-_172017343 | 0.19 |
ENST00000431350.2
ENST00000360843.3 |
TLK1
|
tousled-like kinase 1 |
| chr2_+_120517174 | 0.19 |
ENST00000263708.2
|
PTPN4
|
protein tyrosine phosphatase, non-receptor type 4 (megakaryocyte) |
| chr3_+_137906109 | 0.18 |
ENST00000481646.1
ENST00000469044.1 ENST00000491704.1 ENST00000461600.1 |
ARMC8
|
armadillo repeat containing 8 |
| chr1_-_205601064 | 0.18 |
ENST00000357992.4
ENST00000289703.4 |
ELK4
|
ELK4, ETS-domain protein (SRF accessory protein 1) |
| chr1_-_150849208 | 0.18 |
ENST00000358595.5
|
ARNT
|
aryl hydrocarbon receptor nuclear translocator |
| chr13_+_93879085 | 0.18 |
ENST00000377047.4
|
GPC6
|
glypican 6 |
| chr8_-_57123815 | 0.18 |
ENST00000316981.3
ENST00000423799.2 ENST00000429357.2 |
PLAG1
|
pleiomorphic adenoma gene 1 |
| chr14_+_57046500 | 0.18 |
ENST00000261556.6
|
TMEM260
|
transmembrane protein 260 |
| chr18_+_2655692 | 0.17 |
ENST00000320876.6
|
SMCHD1
|
structural maintenance of chromosomes flexible hinge domain containing 1 |
| chr4_-_111119804 | 0.17 |
ENST00000394607.3
ENST00000302274.3 |
ELOVL6
|
ELOVL fatty acid elongase 6 |
| chr3_+_119187785 | 0.17 |
ENST00000295588.4
ENST00000476573.1 |
POGLUT1
|
protein O-glucosyltransferase 1 |
| chr1_+_113615794 | 0.17 |
ENST00000361127.5
|
LRIG2
|
leucine-rich repeats and immunoglobulin-like domains 2 |
| chr10_-_75910789 | 0.17 |
ENST00000355264.4
|
AP3M1
|
adaptor-related protein complex 3, mu 1 subunit |
| chr8_-_74791051 | 0.17 |
ENST00000453587.2
ENST00000602969.1 ENST00000602593.1 ENST00000419880.3 ENST00000517608.1 |
UBE2W
|
ubiquitin-conjugating enzyme E2W (putative) |
| chr2_-_68479614 | 0.17 |
ENST00000234310.3
|
PPP3R1
|
protein phosphatase 3, regulatory subunit B, alpha |
| chr16_+_9185450 | 0.17 |
ENST00000327827.7
|
C16orf72
|
chromosome 16 open reading frame 72 |
| chr1_+_100435315 | 0.17 |
ENST00000370155.3
ENST00000465289.1 |
SLC35A3
|
solute carrier family 35 (UDP-N-acetylglucosamine (UDP-GlcNAc) transporter), member A3 |
| chr9_+_33817461 | 0.16 |
ENST00000263228.3
|
UBE2R2
|
ubiquitin-conjugating enzyme E2R 2 |
| chr16_+_69599861 | 0.16 |
ENST00000354436.2
|
NFAT5
|
nuclear factor of activated T-cells 5, tonicity-responsive |
| chrX_+_70752917 | 0.16 |
ENST00000373719.3
|
OGT
|
O-linked N-acetylglucosamine (GlcNAc) transferase |
| chr12_-_42632016 | 0.16 |
ENST00000442791.3
ENST00000327791.4 ENST00000534854.2 ENST00000380788.3 ENST00000380790.4 |
YAF2
|
YY1 associated factor 2 |
| chr2_-_75788038 | 0.16 |
ENST00000393913.3
ENST00000410113.1 |
EVA1A
|
eva-1 homolog A (C. elegans) |
| chr3_-_24536253 | 0.16 |
ENST00000428492.1
ENST00000396671.2 ENST00000431815.1 ENST00000418247.1 ENST00000416420.1 ENST00000356447.4 |
THRB
|
thyroid hormone receptor, beta |
| chr4_-_129208940 | 0.16 |
ENST00000296425.5
|
PGRMC2
|
progesterone receptor membrane component 2 |
| chr7_-_66460563 | 0.16 |
ENST00000246868.2
|
SBDS
|
Shwachman-Bodian-Diamond syndrome |
| chr14_-_53417732 | 0.15 |
ENST00000399304.3
ENST00000395631.2 ENST00000341590.3 ENST00000343279.4 |
FERMT2
|
fermitin family member 2 |
| chr6_-_117923520 | 0.15 |
ENST00000368498.2
|
GOPC
|
golgi-associated PDZ and coiled-coil motif containing |
| chrX_-_131352152 | 0.15 |
ENST00000342983.2
|
RAP2C
|
RAP2C, member of RAS oncogene family |
| chr6_-_90062543 | 0.15 |
ENST00000435041.2
|
UBE2J1
|
ubiquitin-conjugating enzyme E2, J1 |
| chr1_-_85666688 | 0.15 |
ENST00000341460.5
|
SYDE2
|
synapse defective 1, Rho GTPase, homolog 2 (C. elegans) |
| chr1_+_162467595 | 0.15 |
ENST00000538489.1
ENST00000489294.1 |
UHMK1
|
U2AF homology motif (UHM) kinase 1 |
| chr3_-_72496035 | 0.15 |
ENST00000477973.2
|
RYBP
|
RING1 and YY1 binding protein |
| chr7_+_32535060 | 0.15 |
ENST00000318709.4
ENST00000409301.1 ENST00000404479.1 |
AVL9
|
AVL9 homolog (S. cerevisiase) |
| chr11_+_56949221 | 0.14 |
ENST00000497933.1
|
LRRC55
|
leucine rich repeat containing 55 |
| chr3_-_49907323 | 0.14 |
ENST00000296471.7
ENST00000488336.1 ENST00000467248.1 ENST00000466940.1 ENST00000463537.1 ENST00000480398.2 |
CAMKV
|
CaM kinase-like vesicle-associated |
| chr13_-_50367057 | 0.14 |
ENST00000261667.3
|
KPNA3
|
karyopherin alpha 3 (importin alpha 4) |
| chr12_-_6809958 | 0.14 |
ENST00000320591.5
ENST00000534837.1 |
PIANP
|
PILR alpha associated neural protein |
| chr12_+_68042495 | 0.14 |
ENST00000344096.3
|
DYRK2
|
dual-specificity tyrosine-(Y)-phosphorylation regulated kinase 2 |
| chr18_+_19321281 | 0.14 |
ENST00000261537.6
|
MIB1
|
mindbomb E3 ubiquitin protein ligase 1 |
| chr5_+_82767284 | 0.13 |
ENST00000265077.3
|
VCAN
|
versican |
| chr14_-_53258314 | 0.13 |
ENST00000216410.3
ENST00000557604.1 |
GNPNAT1
|
glucosamine-phosphate N-acetyltransferase 1 |
| chr22_-_42828375 | 0.13 |
ENST00000329021.5
|
NFAM1
|
NFAT activating protein with ITAM motif 1 |
| chr2_+_170440844 | 0.13 |
ENST00000260970.3
ENST00000433207.1 ENST00000409714.3 ENST00000462903.1 |
PPIG
|
peptidylprolyl isomerase G (cyclophilin G) |
| chr2_-_201936302 | 0.13 |
ENST00000453765.1
ENST00000452799.1 ENST00000446678.1 ENST00000418596.3 |
FAM126B
|
family with sequence similarity 126, member B |
| chr6_+_127439749 | 0.13 |
ENST00000356698.4
|
RSPO3
|
R-spondin 3 |
| chr20_+_8112824 | 0.13 |
ENST00000378641.3
|
PLCB1
|
phospholipase C, beta 1 (phosphoinositide-specific) |
| chr9_+_92219919 | 0.13 |
ENST00000252506.6
ENST00000375769.1 |
GADD45G
|
growth arrest and DNA-damage-inducible, gamma |
| chr1_-_146644122 | 0.13 |
ENST00000254101.3
|
PRKAB2
|
protein kinase, AMP-activated, beta 2 non-catalytic subunit |
| chr17_-_7120525 | 0.12 |
ENST00000447163.1
ENST00000399506.2 ENST00000302955.6 |
DLG4
|
discs, large homolog 4 (Drosophila) |
| chr2_+_208576355 | 0.12 |
ENST00000420822.1
ENST00000295414.3 ENST00000339882.5 |
CCNYL1
|
cyclin Y-like 1 |
| chr3_-_122233723 | 0.12 |
ENST00000493510.1
ENST00000344337.6 ENST00000476916.1 ENST00000465882.1 |
KPNA1
|
karyopherin alpha 1 (importin alpha 5) |
| chr5_-_137878887 | 0.12 |
ENST00000507939.1
ENST00000572514.1 ENST00000499810.2 ENST00000360541.5 |
ETF1
|
eukaryotic translation termination factor 1 |
| chrX_-_122866874 | 0.12 |
ENST00000245838.8
ENST00000355725.4 |
THOC2
|
THO complex 2 |
| chr3_+_57261743 | 0.12 |
ENST00000288266.3
|
APPL1
|
adaptor protein, phosphotyrosine interaction, PH domain and leucine zipper containing 1 |
| chr12_+_53399942 | 0.12 |
ENST00000262056.9
|
EIF4B
|
eukaryotic translation initiation factor 4B |
| chr4_+_57774042 | 0.12 |
ENST00000309042.7
|
REST
|
RE1-silencing transcription factor |
| chr13_+_96329381 | 0.11 |
ENST00000602402.1
ENST00000376795.6 |
DNAJC3
|
DnaJ (Hsp40) homolog, subfamily C, member 3 |
| chr1_+_109792641 | 0.11 |
ENST00000271332.3
|
CELSR2
|
cadherin, EGF LAG seven-pass G-type receptor 2 |
| chr12_+_104458235 | 0.11 |
ENST00000229330.4
|
HCFC2
|
host cell factor C2 |
| chr1_-_84464780 | 0.11 |
ENST00000260505.8
|
TTLL7
|
tubulin tyrosine ligase-like family, member 7 |
| chr4_+_124320665 | 0.11 |
ENST00000394339.2
|
SPRY1
|
sprouty homolog 1, antagonist of FGF signaling (Drosophila) |
| chr2_-_16847084 | 0.11 |
ENST00000406434.1
ENST00000381323.3 |
FAM49A
|
family with sequence similarity 49, member A |
| chr2_-_24149977 | 0.11 |
ENST00000238789.5
|
ATAD2B
|
ATPase family, AAA domain containing 2B |
| chr1_+_90286562 | 0.11 |
ENST00000525774.1
ENST00000337338.5 |
LRRC8D
|
leucine rich repeat containing 8 family, member D |
| chr22_+_29279552 | 0.11 |
ENST00000544604.2
|
ZNRF3
|
zinc and ring finger 3 |
| chr2_+_26256938 | 0.11 |
ENST00000264710.4
|
RAB10
|
RAB10, member RAS oncogene family |
| chr10_-_15210666 | 0.11 |
ENST00000378165.4
|
NMT2
|
N-myristoyltransferase 2 |
| chr15_+_49715293 | 0.10 |
ENST00000267843.4
ENST00000560270.1 |
FGF7
|
fibroblast growth factor 7 |
| chr1_+_110091189 | 0.10 |
ENST00000369851.4
|
GNAI3
|
guanine nucleotide binding protein (G protein), alpha inhibiting activity polypeptide 3 |
| chr14_+_102228123 | 0.10 |
ENST00000422945.2
ENST00000554442.1 ENST00000556260.2 ENST00000328724.5 ENST00000557268.1 |
PPP2R5C
|
protein phosphatase 2, regulatory subunit B', gamma |
| chr9_+_4679555 | 0.10 |
ENST00000381858.1
ENST00000381854.3 |
CDC37L1
|
cell division cycle 37-like 1 |
| chr3_-_176914238 | 0.10 |
ENST00000430069.1
ENST00000428970.1 |
TBL1XR1
|
transducin (beta)-like 1 X-linked receptor 1 |
| chr2_+_231577532 | 0.10 |
ENST00000258418.5
|
CAB39
|
calcium binding protein 39 |
| chr6_+_134274322 | 0.10 |
ENST00000367871.1
ENST00000237264.4 |
TBPL1
|
TBP-like 1 |
| chr7_+_91875508 | 0.10 |
ENST00000265742.3
|
ANKIB1
|
ankyrin repeat and IBR domain containing 1 |
| chr12_-_80084862 | 0.10 |
ENST00000328827.4
|
PAWR
|
PRKC, apoptosis, WT1, regulator |
| chr12_-_8088871 | 0.10 |
ENST00000075120.7
|
SLC2A3
|
solute carrier family 2 (facilitated glucose transporter), member 3 |
| chr4_+_123747834 | 0.10 |
ENST00000264498.3
|
FGF2
|
fibroblast growth factor 2 (basic) |
| chr5_-_148930960 | 0.09 |
ENST00000261798.5
ENST00000377843.2 |
CSNK1A1
|
casein kinase 1, alpha 1 |
| chr14_+_92588281 | 0.09 |
ENST00000298875.4
ENST00000553427.1 |
CPSF2
|
cleavage and polyadenylation specific factor 2, 100kDa |
| chr17_+_29421900 | 0.09 |
ENST00000358273.4
ENST00000356175.3 |
NF1
|
neurofibromin 1 |
| chr9_-_72287191 | 0.09 |
ENST00000265381.4
|
APBA1
|
amyloid beta (A4) precursor protein-binding, family A, member 1 |
| chr1_+_109234907 | 0.09 |
ENST00000370025.4
ENST00000370022.5 ENST00000370021.1 |
PRPF38B
|
pre-mRNA processing factor 38B |
| chr17_+_4487294 | 0.09 |
ENST00000338859.4
|
SMTNL2
|
smoothelin-like 2 |
| chr10_-_119134918 | 0.09 |
ENST00000334464.5
|
PDZD8
|
PDZ domain containing 8 |
| chrX_+_30671476 | 0.09 |
ENST00000378946.3
ENST00000378943.3 ENST00000378945.3 ENST00000427190.1 ENST00000378941.3 |
GK
|
glycerol kinase |
| chr8_-_81083731 | 0.09 |
ENST00000379096.5
|
TPD52
|
tumor protein D52 |
| chr11_-_102962929 | 0.09 |
ENST00000260247.5
|
DCUN1D5
|
DCN1, defective in cullin neddylation 1, domain containing 5 |
| chr5_+_34656331 | 0.09 |
ENST00000265109.3
|
RAI14
|
retinoic acid induced 14 |
| chr7_-_139876812 | 0.08 |
ENST00000397560.2
|
JHDM1D
|
lysine (K)-specific demethylase 7A |
| chr4_-_99579733 | 0.08 |
ENST00000305798.3
|
TSPAN5
|
tetraspanin 5 |
| chr1_-_173991434 | 0.08 |
ENST00000367696.2
|
RC3H1
|
ring finger and CCCH-type domains 1 |
| chr5_-_132948216 | 0.08 |
ENST00000265342.7
|
FSTL4
|
follistatin-like 4 |
| chr9_+_17579084 | 0.08 |
ENST00000380607.4
|
SH3GL2
|
SH3-domain GRB2-like 2 |
| chr3_-_12200851 | 0.08 |
ENST00000287814.4
|
TIMP4
|
TIMP metallopeptidase inhibitor 4 |
| chr2_+_170683942 | 0.08 |
ENST00000272793.5
|
UBR3
|
ubiquitin protein ligase E3 component n-recognin 3 (putative) |
| chr3_+_43328004 | 0.08 |
ENST00000454177.1
ENST00000429705.2 ENST00000296088.7 ENST00000437827.1 |
SNRK
|
SNF related kinase |
| chr1_-_41131326 | 0.08 |
ENST00000372684.3
|
RIMS3
|
regulating synaptic membrane exocytosis 3 |
| chr5_+_172483347 | 0.08 |
ENST00000522692.1
ENST00000296953.2 ENST00000540014.1 ENST00000520420.1 |
CREBRF
|
CREB3 regulatory factor |
| chr3_-_98620500 | 0.08 |
ENST00000326840.6
|
DCBLD2
|
discoidin, CUB and LCCL domain containing 2 |
| chr5_+_5422778 | 0.08 |
ENST00000296564.7
|
KIAA0947
|
KIAA0947 |
| chr9_+_112810878 | 0.08 |
ENST00000434623.2
ENST00000374525.1 |
AKAP2
|
A kinase (PRKA) anchor protein 2 |
| chr5_-_100238956 | 0.07 |
ENST00000231461.5
|
ST8SIA4
|
ST8 alpha-N-acetyl-neuraminide alpha-2,8-sialyltransferase 4 |
| chr10_+_72164135 | 0.07 |
ENST00000373218.4
|
EIF4EBP2
|
eukaryotic translation initiation factor 4E binding protein 2 |
| chr3_-_113415441 | 0.07 |
ENST00000491165.1
ENST00000316407.4 |
KIAA2018
|
KIAA2018 |
| chrX_-_19988382 | 0.07 |
ENST00000356980.3
ENST00000379687.3 ENST00000379682.4 |
CXorf23
|
chromosome X open reading frame 23 |
| chr1_+_33005020 | 0.07 |
ENST00000373510.4
ENST00000316459.4 |
ZBTB8A
|
zinc finger and BTB domain containing 8A |
| chr9_+_15553055 | 0.07 |
ENST00000380701.3
|
CCDC171
|
coiled-coil domain containing 171 |
| chr5_-_162887071 | 0.07 |
ENST00000302764.4
|
NUDCD2
|
NudC domain containing 2 |
| chr14_-_91526922 | 0.07 |
ENST00000418736.2
ENST00000261991.3 |
RPS6KA5
|
ribosomal protein S6 kinase, 90kDa, polypeptide 5 |
| chr3_-_58419537 | 0.07 |
ENST00000474765.1
ENST00000485460.1 ENST00000302746.6 ENST00000383714.4 |
PDHB
|
pyruvate dehydrogenase (lipoamide) beta |
| chr2_+_45878790 | 0.07 |
ENST00000306156.3
|
PRKCE
|
protein kinase C, epsilon |
| chr4_+_48343339 | 0.07 |
ENST00000264313.6
|
SLAIN2
|
SLAIN motif family, member 2 |
| chr18_+_60190226 | 0.07 |
ENST00000269499.5
|
ZCCHC2
|
zinc finger, CCHC domain containing 2 |
Network of associatons between targets according to the STRING database.

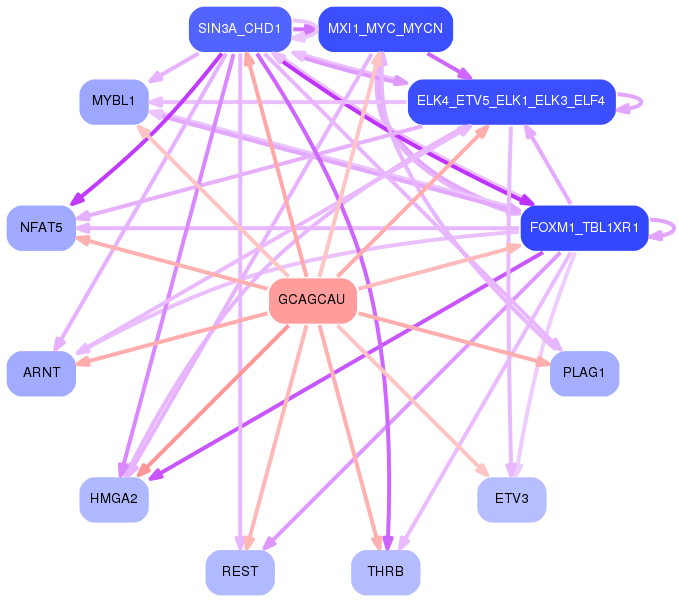
First level regulatory network of GCAGCAU
Gene Ontology Analysis
Gene overrepresentation in biological_process category:
| Log-likelihood per target | Total log-likelihood | Term | Description |
|---|---|---|---|
| 0.1 | 0.4 | GO:0030908 | intein-mediated protein splicing(GO:0016539) protein splicing(GO:0030908) |
| 0.1 | 0.4 | GO:1902544 | regulation of DNA N-glycosylase activity(GO:1902544) |
| 0.1 | 0.3 | GO:0100012 | regulation of heart induction(GO:0090381) regulation of heart induction by canonical Wnt signaling pathway(GO:0100012) |
| 0.1 | 0.5 | GO:1903588 | negative regulation of blood vessel endothelial cell proliferation involved in sprouting angiogenesis(GO:1903588) |
| 0.1 | 0.3 | GO:0031049 | mesodermal-endodermal cell signaling(GO:0003131) programmed DNA elimination(GO:0031049) chromosome breakage(GO:0031052) histone H2A-S139 phosphorylation(GO:0035978) positive regulation of cellular response to X-ray(GO:2000685) |
| 0.1 | 0.4 | GO:0038098 | sequestering of BMP from receptor via BMP binding(GO:0038098) |
| 0.1 | 0.2 | GO:0001543 | ovarian follicle rupture(GO:0001543) |
| 0.1 | 0.3 | GO:1903070 | negative regulation of ER-associated ubiquitin-dependent protein catabolic process(GO:1903070) |
| 0.1 | 0.3 | GO:0030047 | actin modification(GO:0030047) |
| 0.1 | 0.2 | GO:0010360 | negative regulation of anion channel activity(GO:0010360) Golgi to plasma membrane CFTR protein transport(GO:0043000) |
| 0.0 | 0.1 | GO:0042660 | positive regulation of cell fate specification(GO:0042660) |
| 0.0 | 0.2 | GO:1903553 | positive regulation of extracellular exosome assembly(GO:1903553) |
| 0.0 | 0.3 | GO:0048388 | endosomal lumen acidification(GO:0048388) |
| 0.0 | 0.3 | GO:0045204 | MAPK export from nucleus(GO:0045204) |
| 0.0 | 0.1 | GO:2000437 | egg activation(GO:0007343) monocyte extravasation(GO:0035696) regulation of fertilization(GO:0080154) activation of meiosis(GO:0090427) regulation of monocyte extravasation(GO:2000437) |
| 0.0 | 0.4 | GO:0017196 | N-terminal peptidyl-methionine acetylation(GO:0017196) |
| 0.0 | 0.2 | GO:0090526 | regulation of gluconeogenesis involved in cellular glucose homeostasis(GO:0090526) |
| 0.0 | 0.1 | GO:0061110 | dense core granule biogenesis(GO:0061110) regulation of dense core granule biogenesis(GO:2000705) |
| 0.0 | 0.3 | GO:0030643 | cellular phosphate ion homeostasis(GO:0030643) cellular divalent inorganic anion homeostasis(GO:0072501) cellular trivalent inorganic anion homeostasis(GO:0072502) |
| 0.0 | 0.1 | GO:0097051 | establishment of protein localization to endoplasmic reticulum membrane(GO:0097051) |
| 0.0 | 0.1 | GO:1990164 | histone H2A phosphorylation(GO:1990164) |
| 0.0 | 0.1 | GO:0018008 | N-terminal peptidyl-glycine N-myristoylation(GO:0018008) |
| 0.0 | 0.3 | GO:0038028 | insulin receptor signaling pathway via phosphatidylinositol 3-kinase(GO:0038028) |
| 0.0 | 0.1 | GO:2000687 | negative regulation of rubidium ion transport(GO:2000681) negative regulation of rubidium ion transmembrane transporter activity(GO:2000687) |
| 0.0 | 0.2 | GO:0015788 | UDP-N-acetylglucosamine transport(GO:0015788) UDP-N-acetylglucosamine transmembrane transport(GO:1990569) |
| 0.0 | 0.3 | GO:1990034 | calcium ion export from cell(GO:1990034) |
| 0.0 | 0.2 | GO:0015798 | myo-inositol transport(GO:0015798) |
| 0.0 | 0.3 | GO:0086024 | adrenergic receptor signaling pathway involved in positive regulation of heart rate(GO:0086024) |
| 0.0 | 0.3 | GO:0086048 | membrane depolarization during bundle of His cell action potential(GO:0086048) |
| 0.0 | 0.2 | GO:0007621 | negative regulation of female receptivity(GO:0007621) |
| 0.0 | 0.1 | GO:0061534 | gamma-aminobutyric acid secretion, neurotransmission(GO:0061534) |
| 0.0 | 0.1 | GO:0097010 | eukaryotic translation initiation factor 4F complex assembly(GO:0097010) |
| 0.0 | 0.3 | GO:0043696 | dedifferentiation(GO:0043696) cell dedifferentiation(GO:0043697) |
| 0.0 | 0.5 | GO:0010510 | regulation of acetyl-CoA biosynthetic process from pyruvate(GO:0010510) |
| 0.0 | 0.1 | GO:0060940 | epithelial to mesenchymal transition involved in cardiac fibroblast development(GO:0060940) |
| 0.0 | 0.6 | GO:0000338 | protein deneddylation(GO:0000338) |
| 0.0 | 0.1 | GO:0031548 | regulation of brain-derived neurotrophic factor receptor signaling pathway(GO:0031548) |
| 0.0 | 0.3 | GO:0010606 | positive regulation of cytoplasmic mRNA processing body assembly(GO:0010606) |
| 0.0 | 0.1 | GO:2000051 | negative regulation of non-canonical Wnt signaling pathway(GO:2000051) |
| 0.0 | 0.3 | GO:2001140 | regulation of phospholipid transport(GO:2001138) positive regulation of phospholipid transport(GO:2001140) |
| 0.0 | 0.2 | GO:0018242 | protein O-linked glycosylation via serine(GO:0018242) |
| 0.0 | 0.5 | GO:0045116 | protein neddylation(GO:0045116) |
| 0.0 | 0.4 | GO:0034312 | diol biosynthetic process(GO:0034312) sphingosine biosynthetic process(GO:0046512) |
| 0.0 | 0.3 | GO:0051045 | negative regulation of membrane protein ectodomain proteolysis(GO:0051045) |
| 0.0 | 0.2 | GO:0048539 | bone marrow development(GO:0048539) |
| 0.0 | 0.4 | GO:0007253 | cytoplasmic sequestering of NF-kappaB(GO:0007253) |
| 0.0 | 0.1 | GO:0060935 | cardiac fibroblast cell differentiation(GO:0060935) cardiac fibroblast cell development(GO:0060936) epicardium-derived cardiac fibroblast cell differentiation(GO:0060938) epicardium-derived cardiac fibroblast cell development(GO:0060939) |
| 0.0 | 0.1 | GO:0044837 | assembly of actomyosin apparatus involved in cytokinesis(GO:0000912) actomyosin contractile ring assembly(GO:0000915) actomyosin contractile ring organization(GO:0044837) |
| 0.0 | 0.4 | GO:0006020 | inositol metabolic process(GO:0006020) |
| 0.0 | 0.1 | GO:0070837 | dehydroascorbic acid transport(GO:0070837) |
| 0.0 | 0.1 | GO:0048633 | negative regulation of auditory receptor cell differentiation(GO:0045608) negative regulation of mechanoreceptor differentiation(GO:0045632) positive regulation of skeletal muscle tissue growth(GO:0048633) negative regulation of inner ear receptor cell differentiation(GO:2000981) |
| 0.0 | 0.1 | GO:0070417 | positive regulation of translational initiation in response to stress(GO:0032058) positive regulation of translation in response to endoplasmic reticulum stress(GO:0036493) cellular response to cold(GO:0070417) |
| 0.0 | 0.1 | GO:0006041 | glucosamine metabolic process(GO:0006041) |
| 0.0 | 0.1 | GO:0035669 | TRAM-dependent toll-like receptor signaling pathway(GO:0035668) TRAM-dependent toll-like receptor 4 signaling pathway(GO:0035669) |
| 0.0 | 0.1 | GO:0060437 | lung growth(GO:0060437) |
| 0.0 | 0.1 | GO:0042986 | positive regulation of amyloid precursor protein biosynthetic process(GO:0042986) |
| 0.0 | 0.1 | GO:0071596 | ubiquitin-dependent protein catabolic process via the N-end rule pathway(GO:0071596) |
| 0.0 | 0.0 | GO:1903984 | positive regulation of TRAIL-activated apoptotic signaling pathway(GO:1903984) |
| 0.0 | 0.2 | GO:0001672 | regulation of chromatin assembly or disassembly(GO:0001672) |
| 0.0 | 0.1 | GO:0038161 | prolactin signaling pathway(GO:0038161) |
| 0.0 | 0.2 | GO:0043401 | steroid hormone mediated signaling pathway(GO:0043401) |
| 0.0 | 0.1 | GO:0097688 | AMPA glutamate receptor clustering(GO:0097113) glutamate receptor clustering(GO:0097688) |
| 0.0 | 0.1 | GO:1904806 | regulation of protein oxidation(GO:1904806) positive regulation of protein oxidation(GO:1904808) |
| 0.0 | 0.2 | GO:0009048 | dosage compensation by inactivation of X chromosome(GO:0009048) |
| 0.0 | 0.2 | GO:0034626 | fatty acid elongation, saturated fatty acid(GO:0019367) fatty acid elongation, unsaturated fatty acid(GO:0019368) fatty acid elongation, monounsaturated fatty acid(GO:0034625) fatty acid elongation, polyunsaturated fatty acid(GO:0034626) |
| 0.0 | 0.1 | GO:0006428 | isoleucyl-tRNA aminoacylation(GO:0006428) |
| 0.0 | 0.1 | GO:0006597 | spermine biosynthetic process(GO:0006597) |
| 0.0 | 0.1 | GO:0051534 | negative regulation of NFAT protein import into nucleus(GO:0051534) |
| 0.0 | 0.0 | GO:0035426 | extracellular matrix-cell signaling(GO:0035426) cerebellum vasculature development(GO:0061300) retinal blood vessel morphogenesis(GO:0061304) |
| 0.0 | 0.1 | GO:1904153 | negative regulation of protein exit from endoplasmic reticulum(GO:0070862) negative regulation of retrograde protein transport, ER to cytosol(GO:1904153) |
| 0.0 | 0.1 | GO:0072709 | cellular response to sorbitol(GO:0072709) |
| 0.0 | 0.0 | GO:0034147 | regulation of toll-like receptor 5 signaling pathway(GO:0034147) negative regulation of toll-like receptor 5 signaling pathway(GO:0034148) negative regulation of nucleotide-binding oligomerization domain containing signaling pathway(GO:0070425) negative regulation of nucleotide-binding oligomerization domain containing 1 signaling pathway(GO:0070429) negative regulation of nucleotide-binding oligomerization domain containing 2 signaling pathway(GO:0070433) tolerance induction to lipopolysaccharide(GO:0072573) negative regulation of CD40 signaling pathway(GO:2000349) |
| 0.0 | 0.1 | GO:0006072 | glycerol-3-phosphate metabolic process(GO:0006072) |
| 0.0 | 0.1 | GO:0009212 | dTTP biosynthetic process(GO:0006235) pyrimidine deoxyribonucleoside triphosphate biosynthetic process(GO:0009212) |
| 0.0 | 0.2 | GO:0051531 | NFAT protein import into nucleus(GO:0051531) |
| 0.0 | 0.1 | GO:0031291 | Ran protein signal transduction(GO:0031291) |
| 0.0 | 0.2 | GO:0030050 | vesicle transport along actin filament(GO:0030050) |
| 0.0 | 0.1 | GO:1904885 | beta-catenin destruction complex assembly(GO:1904885) |
| 0.0 | 0.1 | GO:0046886 | positive regulation of hormone biosynthetic process(GO:0046886) |
| 0.0 | 0.1 | GO:0021633 | optic nerve structural organization(GO:0021633) |
| 0.0 | 0.0 | GO:0043318 | negative regulation of response to tumor cell(GO:0002835) negative regulation of immune response to tumor cell(GO:0002838) negative regulation of natural killer cell mediated immune response to tumor cell(GO:0002856) negative regulation of natural killer cell mediated cytotoxicity directed against tumor cell target(GO:0002859) regulation of cytotoxic T cell degranulation(GO:0043317) negative regulation of cytotoxic T cell degranulation(GO:0043318) |
| 0.0 | 0.1 | GO:0021999 | neural plate anterior/posterior regionalization(GO:0021999) |
| 0.0 | 0.1 | GO:0014051 | gamma-aminobutyric acid secretion(GO:0014051) |
Gene overrepresentation in cellular_component category:
| Log-likelihood per target | Total log-likelihood | Term | Description |
|---|---|---|---|
| 0.1 | 0.3 | GO:0035985 | senescence-associated heterochromatin focus(GO:0035985) |
| 0.0 | 0.3 | GO:0031415 | NatA complex(GO:0031415) |
| 0.0 | 0.2 | GO:0001740 | Barr body(GO:0001740) |
| 0.0 | 0.3 | GO:0001739 | sex chromatin(GO:0001739) |
| 0.0 | 0.2 | GO:1990578 | perinuclear endoplasmic reticulum membrane(GO:1990578) |
| 0.0 | 0.1 | GO:0071598 | neuronal ribonucleoprotein granule(GO:0071598) |
| 0.0 | 0.1 | GO:0031205 | endoplasmic reticulum Sec complex(GO:0031205) |
| 0.0 | 0.2 | GO:0005955 | calcineurin complex(GO:0005955) |
| 0.0 | 0.2 | GO:0098799 | outer mitochondrial membrane protein complex(GO:0098799) |
| 0.0 | 0.2 | GO:0008290 | F-actin capping protein complex(GO:0008290) |
| 0.0 | 0.1 | GO:0034673 | inhibin-betaglycan-ActRII complex(GO:0034673) |
| 0.0 | 0.2 | GO:1990454 | L-type voltage-gated calcium channel complex(GO:1990454) |
| 0.0 | 0.1 | GO:0098839 | postsynaptic density membrane(GO:0098839) |
| 0.0 | 0.1 | GO:0032593 | insulin-responsive compartment(GO:0032593) |
| 0.0 | 0.1 | GO:0000445 | THO complex(GO:0000347) THO complex part of transcription export complex(GO:0000445) |
| 0.0 | 0.2 | GO:0031080 | nuclear pore outer ring(GO:0031080) |
| 0.0 | 0.1 | GO:0097149 | centralspindlin complex(GO:0097149) |
Gene overrepresentation in molecular_function category:
| Log-likelihood per target | Total log-likelihood | Term | Description |
|---|---|---|---|
| 0.1 | 0.4 | GO:0043739 | G/U mismatch-specific uracil-DNA glycosylase activity(GO:0043739) |
| 0.1 | 0.5 | GO:0004740 | pyruvate dehydrogenase (acetyl-transferring) kinase activity(GO:0004740) |
| 0.1 | 0.3 | GO:0098770 | FBXO family protein binding(GO:0098770) |
| 0.1 | 0.3 | GO:0047389 | glycerophosphocholine phosphodiesterase activity(GO:0047389) |
| 0.1 | 0.3 | GO:0008193 | tRNA guanylyltransferase activity(GO:0008193) |
| 0.1 | 0.3 | GO:0086057 | voltage-gated calcium channel activity involved in bundle of His cell action potential(GO:0086057) |
| 0.1 | 0.3 | GO:0035501 | MH1 domain binding(GO:0035501) |
| 0.1 | 0.2 | GO:0005365 | myo-inositol transmembrane transporter activity(GO:0005365) |
| 0.1 | 0.3 | GO:1990050 | phosphatidic acid transporter activity(GO:1990050) |
| 0.1 | 0.2 | GO:0030158 | protein xylosyltransferase activity(GO:0030158) |
| 0.1 | 0.4 | GO:0033857 | diphosphoinositol-pentakisphosphate kinase activity(GO:0033857) |
| 0.0 | 0.2 | GO:0001069 | regulatory region RNA binding(GO:0001069) |
| 0.0 | 0.2 | GO:0004874 | aryl hydrocarbon receptor activity(GO:0004874) |
| 0.0 | 0.4 | GO:0017040 | ceramidase activity(GO:0017040) |
| 0.0 | 0.2 | GO:0097363 | protein O-GlcNAc transferase activity(GO:0097363) |
| 0.0 | 0.1 | GO:0019107 | glycylpeptide N-tetradecanoyltransferase activity(GO:0004379) myristoyltransferase activity(GO:0019107) |
| 0.0 | 0.2 | GO:0005462 | UDP-N-acetylglucosamine transmembrane transporter activity(GO:0005462) |
| 0.0 | 0.3 | GO:0046976 | histone methyltransferase activity (H3-K27 specific)(GO:0046976) |
| 0.0 | 0.1 | GO:0031812 | G-protein coupled nucleotide receptor binding(GO:0031811) P2Y1 nucleotide receptor binding(GO:0031812) |
| 0.0 | 0.1 | GO:0034057 | RNA strand-exchange activity(GO:0034057) |
| 0.0 | 0.4 | GO:0036122 | BMP binding(GO:0036122) |
| 0.0 | 0.1 | GO:0004739 | pyruvate dehydrogenase (acetyl-transferring) activity(GO:0004739) |
| 0.0 | 0.4 | GO:0005113 | patched binding(GO:0005113) |
| 0.0 | 0.2 | GO:0045545 | syndecan binding(GO:0045545) |
| 0.0 | 0.1 | GO:0070123 | transforming growth factor beta receptor activity, type III(GO:0070123) |
| 0.0 | 0.4 | GO:0004596 | peptide alpha-N-acetyltransferase activity(GO:0004596) |
| 0.0 | 0.1 | GO:0048403 | brain-derived neurotrophic factor binding(GO:0048403) |
| 0.0 | 0.5 | GO:0097602 | cullin family protein binding(GO:0097602) |
| 0.0 | 0.1 | GO:0033300 | dehydroascorbic acid transporter activity(GO:0033300) |
| 0.0 | 0.3 | GO:0016018 | cyclosporin A binding(GO:0016018) |
| 0.0 | 0.1 | GO:0016768 | spermine synthase activity(GO:0016768) |
| 0.0 | 0.2 | GO:0048019 | receptor antagonist activity(GO:0048019) |
| 0.0 | 0.1 | GO:0030628 | pre-mRNA 3'-splice site binding(GO:0030628) |
| 0.0 | 0.2 | GO:0046935 | 1-phosphatidylinositol-3-kinase regulator activity(GO:0046935) |
| 0.0 | 0.3 | GO:0008239 | dipeptidyl-peptidase activity(GO:0008239) |
| 0.0 | 0.1 | GO:0008079 | translation release factor activity(GO:0003747) translation termination factor activity(GO:0008079) |
| 0.0 | 0.3 | GO:0031698 | beta-2 adrenergic receptor binding(GO:0031698) |
| 0.0 | 0.2 | GO:0102338 | fatty acid elongase activity(GO:0009922) 3-oxo-arachidoyl-CoA synthase activity(GO:0102336) 3-oxo-cerotoyl-CoA synthase activity(GO:0102337) 3-oxo-lignoceronyl-CoA synthase activity(GO:0102338) |
| 0.0 | 0.1 | GO:0004822 | isoleucine-tRNA ligase activity(GO:0004822) |
| 0.0 | 0.1 | GO:0035276 | ethanol binding(GO:0035276) |
| 0.0 | 0.1 | GO:0070740 | tubulin-glutamic acid ligase activity(GO:0070740) |
| 0.0 | 0.2 | GO:0004726 | non-membrane spanning protein tyrosine phosphatase activity(GO:0004726) |
| 0.0 | 0.0 | GO:0008427 | calcium-dependent protein kinase inhibitor activity(GO:0008427) |
| 0.0 | 0.0 | GO:0051800 | phosphatidylinositol-3,4-bisphosphate 3-phosphatase activity(GO:0051800) |
| 0.0 | 0.0 | GO:0004119 | cGMP-inhibited cyclic-nucleotide phosphodiesterase activity(GO:0004119) |
| 0.0 | 0.3 | GO:0004535 | poly(A)-specific ribonuclease activity(GO:0004535) |
| 0.0 | 0.4 | GO:0004653 | polypeptide N-acetylgalactosaminyltransferase activity(GO:0004653) |
| 0.0 | 0.1 | GO:1904929 | coreceptor activity involved in Wnt signaling pathway, planar cell polarity pathway(GO:1904929) |
| 0.0 | 0.2 | GO:0034450 | ubiquitin-ubiquitin ligase activity(GO:0034450) |
| 0.0 | 0.5 | GO:0030676 | Rac guanyl-nucleotide exchange factor activity(GO:0030676) |
Gene overrepresentation in C2:CP category:
| Log-likelihood per target | Total log-likelihood | Term | Description |
|---|---|---|---|
| 0.0 | 0.4 | PID IL5 PATHWAY | IL5-mediated signaling events |
| 0.0 | 0.7 | SA B CELL RECEPTOR COMPLEXES | Antigen binding to B cell receptors activates protein tyrosine kinases, such as the Src family, which ultimate activate MAP kinases. |
Gene overrepresentation in C2:CP:REACTOME category:
| Log-likelihood per target | Total log-likelihood | Term | Description |
|---|---|---|---|
| 0.0 | 0.5 | REACTOME REGULATION OF PYRUVATE DEHYDROGENASE PDH COMPLEX | Genes involved in Regulation of pyruvate dehydrogenase (PDH) complex |
| 0.0 | 0.4 | REACTOME BASE FREE SUGAR PHOSPHATE REMOVAL VIA THE SINGLE NUCLEOTIDE REPLACEMENT PATHWAY | Genes involved in Base-free sugar-phosphate removal via the single-nucleotide replacement pathway |
| 0.0 | 0.1 | REACTOME ADP SIGNALLING THROUGH P2RY12 | Genes involved in ADP signalling through P2Y purinoceptor 12 |
| 0.0 | 0.1 | REACTOME REGULATION OF INSULIN SECRETION BY ACETYLCHOLINE | Genes involved in Regulation of Insulin Secretion by Acetylcholine |