Project
A549 cells infected with SARS-CoV-2 Analysis Results (GEO series: GSE147507)
Navigation
Downloads
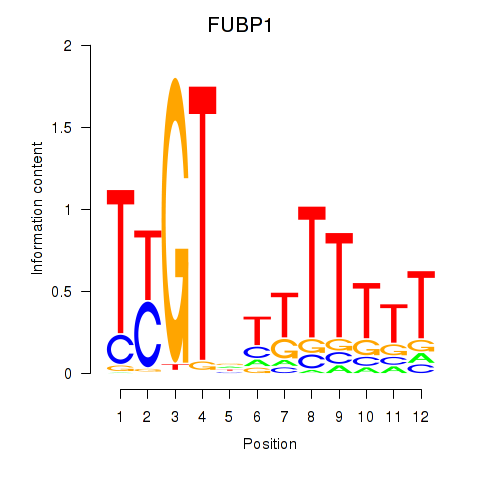
Results for FUBP1
Z-value: 0.67
Motif logo
Transcription factors associated with FUBP1
| Gene Symbol | Gene ID | Gene Info |
|---|---|---|
|
FUBP1
|
ENSG00000162613.12 | far upstream element binding protein 1 |
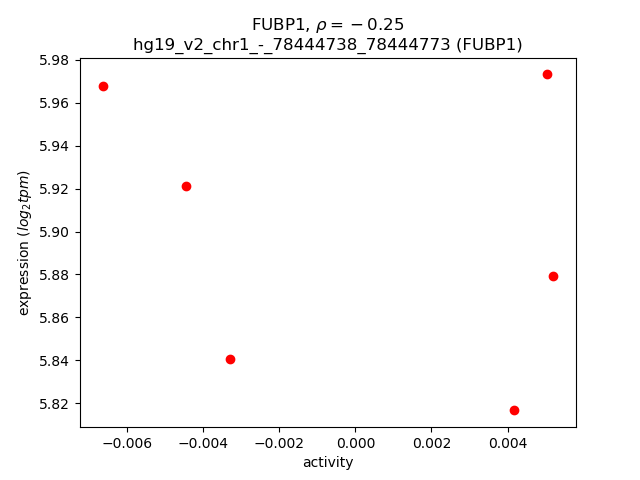
Activity-expression correlation:
| Gene | Promoter | Pearson corr. coef. | P-value | Plot |
|---|---|---|---|---|
| FUBP1 | hg19_v2_chr1_-_78444738_78444773 | -0.25 | 6.3e-01 | Click! |
Activity profile of FUBP1 motif
Sorted Z-values of FUBP1 motif
| Promoter | Log-likelihood | Transcript | Gene | Gene Info |
|---|---|---|---|---|
| chr14_-_38036271 | 0.43 |
ENST00000556024.1
|
RP11-356O9.2
|
RP11-356O9.2 |
| chr17_-_77005813 | 0.38 |
ENST00000590370.1
ENST00000591625.1 |
CANT1
|
calcium activated nucleotidase 1 |
| chr1_-_27701307 | 0.31 |
ENST00000270879.4
ENST00000354982.2 |
FCN3
|
ficolin (collagen/fibrinogen domain containing) 3 |
| chr2_+_177015950 | 0.30 |
ENST00000306324.3
|
HOXD4
|
homeobox D4 |
| chr13_+_44596471 | 0.29 |
ENST00000592085.1
ENST00000591799.1 |
LINC00284
|
long intergenic non-protein coding RNA 284 |
| chr15_-_55657428 | 0.29 |
ENST00000568543.1
|
CCPG1
|
cell cycle progression 1 |
| chr8_+_40018977 | 0.28 |
ENST00000520487.1
|
RP11-470M17.2
|
RP11-470M17.2 |
| chr9_+_97562440 | 0.28 |
ENST00000395357.2
|
C9orf3
|
chromosome 9 open reading frame 3 |
| chr18_-_53255766 | 0.27 |
ENST00000566286.1
ENST00000564999.1 ENST00000566279.1 ENST00000354452.3 ENST00000356073.4 |
TCF4
|
transcription factor 4 |
| chr7_-_75401513 | 0.23 |
ENST00000005180.4
|
CCL26
|
chemokine (C-C motif) ligand 26 |
| chr5_-_157161727 | 0.23 |
ENST00000599823.1
|
AC026407.1
|
Uncharacterized protein |
| chr7_-_124405681 | 0.22 |
ENST00000303921.2
|
GPR37
|
G protein-coupled receptor 37 (endothelin receptor type B-like) |
| chr16_+_28565230 | 0.22 |
ENST00000317058.3
|
CCDC101
|
coiled-coil domain containing 101 |
| chr10_-_105845674 | 0.21 |
ENST00000353479.5
ENST00000369733.3 |
COL17A1
|
collagen, type XVII, alpha 1 |
| chr14_+_75761099 | 0.21 |
ENST00000561000.1
ENST00000558575.1 |
RP11-293M10.5
|
RP11-293M10.5 |
| chr22_-_50970566 | 0.19 |
ENST00000405135.1
ENST00000401779.1 |
ODF3B
|
outer dense fiber of sperm tails 3B |
| chr2_-_25451065 | 0.19 |
ENST00000606328.1
|
RP11-458N5.1
|
RP11-458N5.1 |
| chr16_+_532503 | 0.18 |
ENST00000412256.1
|
RAB11FIP3
|
RAB11 family interacting protein 3 (class II) |
| chr17_+_67498396 | 0.17 |
ENST00000588110.1
|
MAP2K6
|
mitogen-activated protein kinase kinase 6 |
| chr7_-_83824449 | 0.17 |
ENST00000420047.1
|
SEMA3A
|
sema domain, immunoglobulin domain (Ig), short basic domain, secreted, (semaphorin) 3A |
| chr22_-_50970919 | 0.17 |
ENST00000329363.4
ENST00000437588.1 |
ODF3B
|
outer dense fiber of sperm tails 3B |
| chr1_-_245134273 | 0.16 |
ENST00000607453.1
|
RP11-156E8.1
|
Uncharacterized protein |
| chr6_-_27835357 | 0.16 |
ENST00000331442.3
|
HIST1H1B
|
histone cluster 1, H1b |
| chr3_-_182881595 | 0.16 |
ENST00000476015.1
|
LAMP3
|
lysosomal-associated membrane protein 3 |
| chr15_-_31521567 | 0.16 |
ENST00000560812.1
ENST00000559853.1 ENST00000558109.1 |
RP11-16E12.2
|
RP11-16E12.2 |
| chrX_-_73513307 | 0.15 |
ENST00000602420.1
|
FTX
|
FTX transcript, XIST regulator (non-protein coding) |
| chr5_+_72509751 | 0.14 |
ENST00000515556.1
ENST00000513379.1 ENST00000427584.2 |
RP11-60A8.1
|
RP11-60A8.1 |
| chrX_+_49644470 | 0.14 |
ENST00000508866.2
|
USP27X
|
ubiquitin specific peptidase 27, X-linked |
| chr5_-_1882858 | 0.14 |
ENST00000511126.1
ENST00000231357.2 |
IRX4
|
iroquois homeobox 4 |
| chr1_+_45140360 | 0.13 |
ENST00000418644.1
ENST00000458657.2 ENST00000441519.1 ENST00000535358.1 ENST00000445071.1 |
C1orf228
|
chromosome 1 open reading frame 228 |
| chr22_-_50970506 | 0.13 |
ENST00000428989.2
ENST00000403326.1 |
ODF3B
|
outer dense fiber of sperm tails 3B |
| chr18_-_60985914 | 0.13 |
ENST00000589955.1
|
BCL2
|
B-cell CLL/lymphoma 2 |
| chr18_+_18943554 | 0.13 |
ENST00000580732.2
|
GREB1L
|
growth regulation by estrogen in breast cancer-like |
| chr11_-_33891362 | 0.12 |
ENST00000395833.3
|
LMO2
|
LIM domain only 2 (rhombotin-like 1) |
| chr4_-_101439242 | 0.12 |
ENST00000296420.4
|
EMCN
|
endomucin |
| chr4_+_89444961 | 0.12 |
ENST00000513325.1
|
HERC3
|
HECT and RLD domain containing E3 ubiquitin protein ligase 3 |
| chr7_-_127032114 | 0.12 |
ENST00000436992.1
|
ZNF800
|
zinc finger protein 800 |
| chr19_+_48969094 | 0.12 |
ENST00000595676.1
|
CTC-273B12.7
|
Uncharacterized protein |
| chr9_-_119162885 | 0.11 |
ENST00000445861.2
|
PAPPA-AS1
|
PAPPA antisense RNA 1 |
| chr2_-_27435634 | 0.11 |
ENST00000430186.1
|
SLC5A6
|
solute carrier family 5 (sodium/multivitamin and iodide cotransporter), member 6 |
| chr11_+_60681346 | 0.11 |
ENST00000227525.3
|
TMEM109
|
transmembrane protein 109 |
| chr21_+_17792672 | 0.11 |
ENST00000602620.1
|
LINC00478
|
long intergenic non-protein coding RNA 478 |
| chr11_-_107590383 | 0.11 |
ENST00000525934.1
ENST00000531293.1 |
SLN
|
sarcolipin |
| chrX_-_73513353 | 0.11 |
ENST00000430772.1
ENST00000423992.2 ENST00000602812.1 |
FTX
|
FTX transcript, XIST regulator (non-protein coding) |
| chr2_+_181845763 | 0.11 |
ENST00000602499.1
|
UBE2E3
|
ubiquitin-conjugating enzyme E2E 3 |
| chr11_+_18154059 | 0.11 |
ENST00000531264.1
|
MRGPRX3
|
MAS-related GPR, member X3 |
| chr1_+_43855545 | 0.11 |
ENST00000372450.4
ENST00000310739.4 |
SZT2
|
seizure threshold 2 homolog (mouse) |
| chr21_+_17791648 | 0.11 |
ENST00000602892.1
ENST00000418813.2 ENST00000435697.1 |
LINC00478
|
long intergenic non-protein coding RNA 478 |
| chr5_+_125706998 | 0.10 |
ENST00000506445.1
|
GRAMD3
|
GRAM domain containing 3 |
| chr21_-_38445011 | 0.10 |
ENST00000464265.1
ENST00000399102.1 |
PIGP
|
phosphatidylinositol glycan anchor biosynthesis, class P |
| chr2_-_169746878 | 0.10 |
ENST00000282074.2
|
SPC25
|
SPC25, NDC80 kinetochore complex component |
| chr12_+_121088291 | 0.10 |
ENST00000351200.2
|
CABP1
|
calcium binding protein 1 |
| chr11_-_66964638 | 0.10 |
ENST00000444002.2
|
AP001885.1
|
AP001885.1 |
| chr2_-_27435390 | 0.10 |
ENST00000428518.1
|
SLC5A6
|
solute carrier family 5 (sodium/multivitamin and iodide cotransporter), member 6 |
| chr1_-_161207986 | 0.10 |
ENST00000506209.1
ENST00000367980.2 |
NR1I3
|
nuclear receptor subfamily 1, group I, member 3 |
| chr11_+_110001723 | 0.10 |
ENST00000528673.1
|
ZC3H12C
|
zinc finger CCCH-type containing 12C |
| chr7_-_22234381 | 0.10 |
ENST00000458533.1
|
RAPGEF5
|
Rap guanine nucleotide exchange factor (GEF) 5 |
| chr1_-_244006528 | 0.09 |
ENST00000336199.5
ENST00000263826.5 |
AKT3
|
v-akt murine thymoma viral oncogene homolog 3 |
| chr1_+_31886653 | 0.09 |
ENST00000536384.1
|
SERINC2
|
serine incorporator 2 |
| chr12_+_56324933 | 0.09 |
ENST00000549629.1
ENST00000555218.1 |
DGKA
|
diacylglycerol kinase, alpha 80kDa |
| chr17_-_77005860 | 0.09 |
ENST00000591773.1
ENST00000588611.1 ENST00000586916.2 ENST00000592033.1 ENST00000588075.1 ENST00000302345.2 ENST00000591811.1 |
CANT1
|
calcium activated nucleotidase 1 |
| chr4_+_90033968 | 0.09 |
ENST00000317005.2
|
TIGD2
|
tigger transposable element derived 2 |
| chr19_+_10765614 | 0.09 |
ENST00000589283.1
|
ILF3
|
interleukin enhancer binding factor 3, 90kDa |
| chr1_-_161208013 | 0.09 |
ENST00000515452.1
ENST00000367983.4 |
NR1I3
|
nuclear receptor subfamily 1, group I, member 3 |
| chr1_-_11741155 | 0.09 |
ENST00000445656.1
ENST00000376669.5 ENST00000456915.1 ENST00000376692.4 |
MAD2L2
|
MAD2 mitotic arrest deficient-like 2 (yeast) |
| chr5_+_180682720 | 0.09 |
ENST00000599439.1
|
AC008443.1
|
CDNA: FLJ23158 fis, clone LNG09623; Uncharacterized protein |
| chr12_+_48513570 | 0.09 |
ENST00000551804.1
|
PFKM
|
phosphofructokinase, muscle |
| chr9_+_96846740 | 0.08 |
ENST00000288976.3
|
PTPDC1
|
protein tyrosine phosphatase domain containing 1 |
| chr4_-_48136217 | 0.08 |
ENST00000264316.4
|
TXK
|
TXK tyrosine kinase |
| chr2_+_33359687 | 0.08 |
ENST00000402934.1
ENST00000404525.1 ENST00000407925.1 |
LTBP1
|
latent transforming growth factor beta binding protein 1 |
| chr1_+_45140400 | 0.08 |
ENST00000453711.1
|
C1orf228
|
chromosome 1 open reading frame 228 |
| chr18_-_73967160 | 0.07 |
ENST00000579714.1
|
RP11-94B19.7
|
RP11-94B19.7 |
| chr2_-_72375167 | 0.07 |
ENST00000001146.2
|
CYP26B1
|
cytochrome P450, family 26, subfamily B, polypeptide 1 |
| chr4_-_140544386 | 0.07 |
ENST00000561977.1
|
RP11-308D13.3
|
RP11-308D13.3 |
| chr6_-_31509714 | 0.07 |
ENST00000456662.1
ENST00000431908.1 ENST00000456976.1 ENST00000428450.1 ENST00000453105.2 ENST00000418897.1 ENST00000415382.2 ENST00000449074.2 ENST00000419020.1 ENST00000428098.1 |
DDX39B
|
DEAD (Asp-Glu-Ala-Asp) box polypeptide 39B |
| chr7_-_22233442 | 0.07 |
ENST00000401957.2
|
RAPGEF5
|
Rap guanine nucleotide exchange factor (GEF) 5 |
| chr12_+_54366894 | 0.07 |
ENST00000546378.1
ENST00000243082.4 |
HOXC11
|
homeobox C11 |
| chr6_+_121756809 | 0.07 |
ENST00000282561.3
|
GJA1
|
gap junction protein, alpha 1, 43kDa |
| chr14_+_58797974 | 0.07 |
ENST00000417477.2
|
ARID4A
|
AT rich interactive domain 4A (RBP1-like) |
| chr1_+_202317855 | 0.07 |
ENST00000356764.2
|
PPP1R12B
|
protein phosphatase 1, regulatory subunit 12B |
| chr9_-_140142222 | 0.07 |
ENST00000344774.4
ENST00000388932.2 |
FAM166A
|
family with sequence similarity 166, member A |
| chr19_+_10765003 | 0.07 |
ENST00000407004.3
ENST00000589998.1 ENST00000589600.1 |
ILF3
|
interleukin enhancer binding factor 3, 90kDa |
| chr2_+_162087577 | 0.07 |
ENST00000439442.1
|
TANK
|
TRAF family member-associated NFKB activator |
| chr4_+_177796841 | 0.07 |
ENST00000508790.1
|
RP11-765K14.1
|
RP11-765K14.1 |
| chr10_+_17686221 | 0.06 |
ENST00000540523.1
|
STAM
|
signal transducing adaptor molecule (SH3 domain and ITAM motif) 1 |
| chr4_-_2420335 | 0.06 |
ENST00000503000.1
|
ZFYVE28
|
zinc finger, FYVE domain containing 28 |
| chr10_+_114710516 | 0.06 |
ENST00000542695.1
ENST00000346198.4 |
TCF7L2
|
transcription factor 7-like 2 (T-cell specific, HMG-box) |
| chr2_+_33359646 | 0.06 |
ENST00000390003.4
ENST00000418533.2 |
LTBP1
|
latent transforming growth factor beta binding protein 1 |
| chr10_-_56561022 | 0.06 |
ENST00000373965.2
ENST00000414778.1 ENST00000395438.1 ENST00000409834.1 ENST00000395445.1 ENST00000395446.1 ENST00000395442.1 ENST00000395440.1 ENST00000395432.2 ENST00000361849.3 ENST00000395433.1 ENST00000320301.6 ENST00000395430.1 ENST00000437009.1 |
PCDH15
|
protocadherin-related 15 |
| chr1_-_44818599 | 0.06 |
ENST00000537474.1
|
ERI3
|
ERI1 exoribonuclease family member 3 |
| chr11_+_64004888 | 0.06 |
ENST00000541681.1
|
VEGFB
|
vascular endothelial growth factor B |
| chr19_+_36235964 | 0.06 |
ENST00000587708.2
|
PSENEN
|
presenilin enhancer gamma secretase subunit |
| chr2_+_181845843 | 0.06 |
ENST00000602710.1
|
UBE2E3
|
ubiquitin-conjugating enzyme E2E 3 |
| chr15_+_49462434 | 0.06 |
ENST00000558145.1
ENST00000543495.1 ENST00000544523.1 ENST00000560138.1 |
GALK2
|
galactokinase 2 |
| chr18_-_53255379 | 0.06 |
ENST00000565908.2
|
TCF4
|
transcription factor 4 |
| chr2_+_202122826 | 0.05 |
ENST00000413726.1
|
CASP8
|
caspase 8, apoptosis-related cysteine peptidase |
| chr9_-_113761720 | 0.05 |
ENST00000541779.1
ENST00000374430.2 |
LPAR1
|
lysophosphatidic acid receptor 1 |
| chr6_-_131949305 | 0.05 |
ENST00000368053.4
ENST00000354577.4 ENST00000403834.3 ENST00000540546.1 ENST00000368068.3 ENST00000368060.3 |
MED23
|
mediator complex subunit 23 |
| chr21_+_17791838 | 0.05 |
ENST00000453910.1
|
LINC00478
|
long intergenic non-protein coding RNA 478 |
| chr1_+_205682497 | 0.05 |
ENST00000598338.1
|
AC119673.1
|
AC119673.1 |
| chr17_-_42298201 | 0.05 |
ENST00000527034.1
|
UBTF
|
upstream binding transcription factor, RNA polymerase I |
| chr1_+_228870824 | 0.05 |
ENST00000366691.3
|
RHOU
|
ras homolog family member U |
| chr9_-_16705069 | 0.05 |
ENST00000471301.2
|
BNC2
|
basonuclin 2 |
| chr7_+_141811539 | 0.05 |
ENST00000550469.2
ENST00000477922.3 |
RP11-1220K2.2
|
Putative inactive maltase-glucoamylase-like protein LOC93432 |
| chr12_+_12870055 | 0.05 |
ENST00000228872.4
|
CDKN1B
|
cyclin-dependent kinase inhibitor 1B (p27, Kip1) |
| chr12_+_56324756 | 0.05 |
ENST00000331886.5
ENST00000555090.1 |
DGKA
|
diacylglycerol kinase, alpha 80kDa |
| chr5_+_145316120 | 0.05 |
ENST00000359120.4
|
SH3RF2
|
SH3 domain containing ring finger 2 |
| chr17_+_67498295 | 0.05 |
ENST00000589295.1
|
MAP2K6
|
mitogen-activated protein kinase kinase 6 |
| chr15_+_49462397 | 0.05 |
ENST00000396509.2
|
GALK2
|
galactokinase 2 |
| chr12_+_120740119 | 0.05 |
ENST00000536460.1
ENST00000202967.4 |
SIRT4
|
sirtuin 4 |
| chr3_-_47950745 | 0.05 |
ENST00000429422.1
|
MAP4
|
microtubule-associated protein 4 |
| chrX_-_33146477 | 0.05 |
ENST00000378677.2
|
DMD
|
dystrophin |
| chr11_-_47521309 | 0.05 |
ENST00000535982.1
|
CELF1
|
CUGBP, Elav-like family member 1 |
| chr10_-_105845536 | 0.04 |
ENST00000393211.3
|
COL17A1
|
collagen, type XVII, alpha 1 |
| chr20_-_45981138 | 0.04 |
ENST00000446994.2
|
ZMYND8
|
zinc finger, MYND-type containing 8 |
| chr1_+_218519577 | 0.04 |
ENST00000366930.4
ENST00000366929.4 |
TGFB2
|
transforming growth factor, beta 2 |
| chr14_+_89060739 | 0.04 |
ENST00000318308.6
|
ZC3H14
|
zinc finger CCCH-type containing 14 |
| chr5_-_159846399 | 0.04 |
ENST00000297151.4
|
SLU7
|
SLU7 splicing factor homolog (S. cerevisiae) |
| chr19_+_782755 | 0.04 |
ENST00000606242.1
ENST00000586061.1 |
AC006273.5
|
AC006273.5 |
| chr3_+_186383741 | 0.04 |
ENST00000232003.4
|
HRG
|
histidine-rich glycoprotein |
| chr1_+_2066252 | 0.04 |
ENST00000466352.1
|
PRKCZ
|
protein kinase C, zeta |
| chr9_+_82186872 | 0.04 |
ENST00000376544.3
ENST00000376520.4 |
TLE4
|
transducin-like enhancer of split 4 (E(sp1) homolog, Drosophila) |
| chr19_-_11545920 | 0.04 |
ENST00000356392.4
ENST00000591179.1 |
CCDC151
|
coiled-coil domain containing 151 |
| chr6_+_123317116 | 0.04 |
ENST00000275162.5
|
CLVS2
|
clavesin 2 |
| chr2_+_27435734 | 0.04 |
ENST00000419744.1
|
ATRAID
|
all-trans retinoic acid-induced differentiation factor |
| chr19_+_13134772 | 0.04 |
ENST00000587760.1
ENST00000585575.1 |
NFIX
|
nuclear factor I/X (CCAAT-binding transcription factor) |
| chr10_+_51187938 | 0.04 |
ENST00000311663.5
|
FAM21D
|
family with sequence similarity 21, member D |
| chr19_+_19303008 | 0.04 |
ENST00000353145.1
ENST00000421262.3 ENST00000303088.4 ENST00000456252.3 ENST00000593273.1 |
RFXANK
|
regulatory factor X-associated ankyrin-containing protein |
| chr12_-_57522813 | 0.04 |
ENST00000556155.1
|
STAT6
|
signal transducer and activator of transcription 6, interleukin-4 induced |
| chr1_-_182360498 | 0.04 |
ENST00000417584.2
|
GLUL
|
glutamate-ammonia ligase |
| chr7_-_83824169 | 0.04 |
ENST00000265362.4
|
SEMA3A
|
sema domain, immunoglobulin domain (Ig), short basic domain, secreted, (semaphorin) 3A |
| chr18_+_7754957 | 0.04 |
ENST00000400053.4
|
PTPRM
|
protein tyrosine phosphatase, receptor type, M |
| chr3_+_114012819 | 0.03 |
ENST00000383671.3
|
TIGIT
|
T cell immunoreceptor with Ig and ITIM domains |
| chr17_-_76713100 | 0.03 |
ENST00000585509.1
|
CYTH1
|
cytohesin 1 |
| chr2_-_175202151 | 0.03 |
ENST00000595354.1
|
AC018470.1
|
Uncharacterized protein FLJ46347 |
| chr5_+_156696362 | 0.03 |
ENST00000377576.3
|
CYFIP2
|
cytoplasmic FMR1 interacting protein 2 |
| chr1_+_78383813 | 0.03 |
ENST00000342754.5
|
NEXN
|
nexilin (F actin binding protein) |
| chr16_-_3350614 | 0.03 |
ENST00000268674.2
|
TIGD7
|
tigger transposable element derived 7 |
| chr2_+_202937972 | 0.03 |
ENST00000541917.1
ENST00000295844.3 |
AC079354.1
|
uncharacterized protein KIAA2012 |
| chr2_-_65593784 | 0.03 |
ENST00000443619.2
|
SPRED2
|
sprouty-related, EVH1 domain containing 2 |
| chr4_-_100242549 | 0.03 |
ENST00000305046.8
ENST00000394887.3 |
ADH1B
|
alcohol dehydrogenase 1B (class I), beta polypeptide |
| chr2_-_216300784 | 0.03 |
ENST00000421182.1
ENST00000432072.2 ENST00000323926.6 ENST00000336916.4 ENST00000357867.4 ENST00000359671.1 ENST00000346544.3 ENST00000345488.5 ENST00000357009.2 ENST00000446046.1 ENST00000356005.4 ENST00000443816.1 ENST00000426059.1 ENST00000354785.4 |
FN1
|
fibronectin 1 |
| chrX_+_12924732 | 0.03 |
ENST00000218032.6
ENST00000311912.5 |
TLR8
|
toll-like receptor 8 |
| chr14_-_23762777 | 0.03 |
ENST00000431326.2
|
HOMEZ
|
homeobox and leucine zipper encoding |
| chr6_-_31612808 | 0.03 |
ENST00000438149.1
|
BAG6
|
BCL2-associated athanogene 6 |
| chr19_+_18682661 | 0.03 |
ENST00000596273.1
ENST00000442744.2 ENST00000595683.1 ENST00000599256.1 ENST00000595158.1 ENST00000598780.1 |
UBA52
|
ubiquitin A-52 residue ribosomal protein fusion product 1 |
| chr4_-_153274078 | 0.03 |
ENST00000263981.5
|
FBXW7
|
F-box and WD repeat domain containing 7, E3 ubiquitin protein ligase |
| chr9_+_82186682 | 0.03 |
ENST00000376552.2
|
TLE4
|
transducin-like enhancer of split 4 (E(sp1) homolog, Drosophila) |
| chr1_-_182360918 | 0.03 |
ENST00000339526.4
|
GLUL
|
glutamate-ammonia ligase |
| chr17_-_42298331 | 0.03 |
ENST00000343638.5
|
UBTF
|
upstream binding transcription factor, RNA polymerase I |
| chr1_-_154178803 | 0.03 |
ENST00000368525.3
|
C1orf189
|
chromosome 1 open reading frame 189 |
| chr8_+_55528627 | 0.03 |
ENST00000220676.1
|
RP1
|
retinitis pigmentosa 1 (autosomal dominant) |
| chr19_+_41094612 | 0.03 |
ENST00000595726.1
|
SHKBP1
|
SH3KBP1 binding protein 1 |
| chr17_-_74049720 | 0.02 |
ENST00000602720.1
|
SRP68
|
signal recognition particle 68kDa |
| chr3_-_149510553 | 0.02 |
ENST00000462519.2
ENST00000446160.1 ENST00000383050.3 |
ANKUB1
|
ankyrin repeat and ubiquitin domain containing 1 |
| chr7_+_106505912 | 0.02 |
ENST00000359195.3
|
PIK3CG
|
phosphatidylinositol-4,5-bisphosphate 3-kinase, catalytic subunit gamma |
| chr8_-_116680833 | 0.02 |
ENST00000220888.5
|
TRPS1
|
trichorhinophalangeal syndrome I |
| chr5_-_160973649 | 0.02 |
ENST00000393959.1
ENST00000517547.1 |
GABRB2
|
gamma-aminobutyric acid (GABA) A receptor, beta 2 |
| chr5_+_156712372 | 0.02 |
ENST00000541131.1
|
CYFIP2
|
cytoplasmic FMR1 interacting protein 2 |
| chr1_+_209602771 | 0.02 |
ENST00000440276.1
|
MIR205HG
|
MIR205 host gene (non-protein coding) |
| chr9_+_135457530 | 0.02 |
ENST00000263610.2
|
BARHL1
|
BarH-like homeobox 1 |
| chr1_-_155271213 | 0.02 |
ENST00000342741.4
|
PKLR
|
pyruvate kinase, liver and RBC |
| chr19_-_55677999 | 0.02 |
ENST00000532817.1
ENST00000527223.2 ENST00000391720.4 |
DNAAF3
|
dynein, axonemal, assembly factor 3 |
| chr14_+_69658480 | 0.02 |
ENST00000409949.1
ENST00000409242.1 ENST00000312994.5 ENST00000413191.1 |
EXD2
|
exonuclease 3'-5' domain containing 2 |
| chr19_+_11546093 | 0.02 |
ENST00000591462.1
|
PRKCSH
|
protein kinase C substrate 80K-H |
| chr1_-_45140074 | 0.02 |
ENST00000420706.1
ENST00000372235.3 ENST00000372242.3 ENST00000372243.3 ENST00000372244.3 |
TMEM53
|
transmembrane protein 53 |
| chr3_-_170303845 | 0.02 |
ENST00000231706.5
|
SLC7A14
|
solute carrier family 7, member 14 |
| chr1_-_40041925 | 0.02 |
ENST00000372862.3
|
PABPC4
|
poly(A) binding protein, cytoplasmic 4 (inducible form) |
| chr1_+_43766642 | 0.02 |
ENST00000372476.3
|
TIE1
|
tyrosine kinase with immunoglobulin-like and EGF-like domains 1 |
| chr21_+_45209394 | 0.02 |
ENST00000497547.1
|
RRP1
|
ribosomal RNA processing 1 |
| chr3_-_193272874 | 0.02 |
ENST00000342695.4
|
ATP13A4
|
ATPase type 13A4 |
| chr16_+_67381263 | 0.02 |
ENST00000541146.1
ENST00000563189.1 ENST00000290940.7 |
LRRC36
|
leucine rich repeat containing 36 |
| chr1_-_43855444 | 0.02 |
ENST00000372455.4
|
MED8
|
mediator complex subunit 8 |
| chr8_+_102504979 | 0.02 |
ENST00000395927.1
|
GRHL2
|
grainyhead-like 2 (Drosophila) |
| chr10_+_17686124 | 0.02 |
ENST00000377524.3
|
STAM
|
signal transducing adaptor molecule (SH3 domain and ITAM motif) 1 |
| chr3_+_130279178 | 0.02 |
ENST00000358511.6
ENST00000453409.2 |
COL6A6
|
collagen, type VI, alpha 6 |
| chr6_-_31509506 | 0.02 |
ENST00000449757.1
|
DDX39B
|
DEAD (Asp-Glu-Ala-Asp) box polypeptide 39B |
| chr14_-_24711806 | 0.02 |
ENST00000540705.1
ENST00000538777.1 ENST00000558566.1 ENST00000559019.1 |
TINF2
|
TERF1 (TRF1)-interacting nuclear factor 2 |
| chr1_+_43855560 | 0.02 |
ENST00000562955.1
|
SZT2
|
seizure threshold 2 homolog (mouse) |
| chr7_+_54609995 | 0.02 |
ENST00000302287.3
ENST00000407838.3 |
VSTM2A
|
V-set and transmembrane domain containing 2A |
| chrX_-_19533379 | 0.02 |
ENST00000338883.4
|
MAP3K15
|
mitogen-activated protein kinase kinase kinase 15 |
| chrX_+_95939638 | 0.02 |
ENST00000373061.3
ENST00000373054.4 ENST00000355827.4 |
DIAPH2
|
diaphanous-related formin 2 |
| chr16_+_24741013 | 0.02 |
ENST00000315183.7
ENST00000395799.3 |
TNRC6A
|
trinucleotide repeat containing 6A |
| chr11_-_67169253 | 0.01 |
ENST00000527663.1
ENST00000312989.7 |
PPP1CA
|
protein phosphatase 1, catalytic subunit, alpha isozyme |
| chr14_-_21852119 | 0.01 |
ENST00000555943.1
|
SUPT16H
|
suppressor of Ty 16 homolog (S. cerevisiae) |
| chr12_+_27863706 | 0.01 |
ENST00000081029.3
ENST00000538315.1 ENST00000542791.1 |
MRPS35
|
mitochondrial ribosomal protein S35 |
| chr1_+_181452678 | 0.01 |
ENST00000367570.1
ENST00000526775.1 ENST00000357570.5 ENST00000358338.5 ENST00000367567.4 |
CACNA1E
|
calcium channel, voltage-dependent, R type, alpha 1E subunit |
| chr22_-_29137771 | 0.01 |
ENST00000439200.1
ENST00000405598.1 ENST00000398017.2 ENST00000425190.2 ENST00000348295.3 ENST00000382578.1 ENST00000382565.1 ENST00000382566.1 ENST00000382580.2 ENST00000328354.6 |
CHEK2
|
checkpoint kinase 2 |
| chr7_+_106505696 | 0.01 |
ENST00000440650.2
ENST00000496166.1 ENST00000473541.1 |
PIK3CG
|
phosphatidylinositol-4,5-bisphosphate 3-kinase, catalytic subunit gamma |
| chr14_-_24711865 | 0.01 |
ENST00000399423.4
ENST00000267415.7 |
TINF2
|
TERF1 (TRF1)-interacting nuclear factor 2 |
| chr17_+_75369400 | 0.01 |
ENST00000590059.1
|
SEPT9
|
septin 9 |
| chr3_-_149051444 | 0.01 |
ENST00000296059.2
|
TM4SF18
|
transmembrane 4 L six family member 18 |
| chr11_+_7506837 | 0.01 |
ENST00000528758.1
|
OLFML1
|
olfactomedin-like 1 |
| chr12_+_10365404 | 0.01 |
ENST00000266458.5
ENST00000421801.2 ENST00000544284.1 ENST00000545047.1 ENST00000543602.1 ENST00000545887.1 |
GABARAPL1
|
GABA(A) receptor-associated protein like 1 |
| chr4_-_168155730 | 0.01 |
ENST00000502330.1
ENST00000357154.3 |
SPOCK3
|
sparc/osteonectin, cwcv and kazal-like domains proteoglycan (testican) 3 |
| chr19_+_1438351 | 0.01 |
ENST00000233609.4
|
RPS15
|
ribosomal protein S15 |
| chr5_+_137225158 | 0.01 |
ENST00000290431.5
|
PKD2L2
|
polycystic kidney disease 2-like 2 |
| chr5_-_115872142 | 0.01 |
ENST00000510263.1
|
SEMA6A
|
sema domain, transmembrane domain (TM), and cytoplasmic domain, (semaphorin) 6A |
| chr12_-_46766577 | 0.01 |
ENST00000256689.5
|
SLC38A2
|
solute carrier family 38, member 2 |
| chr9_-_73483958 | 0.00 |
ENST00000377101.1
ENST00000377106.1 ENST00000360823.2 ENST00000377105.1 |
TRPM3
|
transient receptor potential cation channel, subfamily M, member 3 |
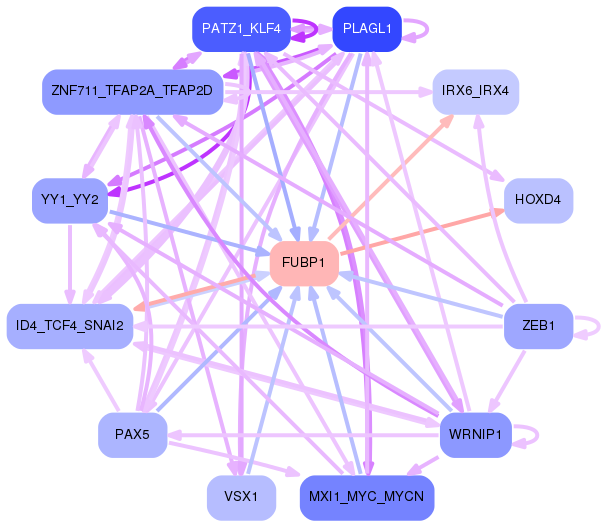
Network of associatons between targets according to the STRING database.

First level regulatory network of FUBP1
Gene Ontology Analysis
Gene overrepresentation in biological_process category:
| Log-likelihood per target | Total log-likelihood | Term | Description |
|---|---|---|---|
| 0.1 | 0.3 | GO:0043654 | recognition of apoptotic cell(GO:0043654) |
| 0.1 | 0.2 | GO:1903045 | neural crest cell migration involved in sympathetic nervous system development(GO:1903045) |
| 0.0 | 0.3 | GO:2001106 | regulation of Rho guanyl-nucleotide exchange factor activity(GO:2001106) |
| 0.0 | 0.2 | GO:0015887 | biotin transport(GO:0015878) pantothenate transmembrane transport(GO:0015887) |
| 0.0 | 0.2 | GO:0072709 | cellular response to sorbitol(GO:0072709) |
| 0.0 | 0.2 | GO:0045915 | positive regulation of catecholamine metabolic process(GO:0045915) positive regulation of dopamine metabolic process(GO:0045964) |
| 0.0 | 0.1 | GO:0035981 | tongue muscle cell differentiation(GO:0035981) positive regulation of skeletal muscle fiber differentiation(GO:1902811) regulation of tongue muscle cell differentiation(GO:2001035) positive regulation of tongue muscle cell differentiation(GO:2001037) |
| 0.0 | 0.1 | GO:1901668 | regulation of superoxide dismutase activity(GO:1901668) |
| 0.0 | 0.1 | GO:2000987 | cell communication by chemical coupling(GO:0010643) positive regulation of fear response(GO:1903367) positive regulation of behavioral fear response(GO:2000987) |
| 0.0 | 0.2 | GO:0070164 | negative regulation of adiponectin secretion(GO:0070164) |
| 0.0 | 0.1 | GO:0046671 | negative regulation of cellular pH reduction(GO:0032848) CD8-positive, alpha-beta T cell lineage commitment(GO:0043375) negative regulation of retinal cell programmed cell death(GO:0046671) |
| 0.0 | 0.0 | GO:1903216 | regulation of protein processing involved in protein targeting to mitochondrion(GO:1903216) negative regulation of protein processing involved in protein targeting to mitochondrion(GO:1903217) |
| 0.0 | 0.1 | GO:0006542 | glutamine biosynthetic process(GO:0006542) |
| 0.0 | 0.1 | GO:1904222 | regulation of CDP-diacylglycerol-serine O-phosphatidyltransferase activity(GO:1904217) positive regulation of CDP-diacylglycerol-serine O-phosphatidyltransferase activity(GO:1904219) positive regulation of serine C-palmitoyltransferase activity(GO:1904222) |
| 0.0 | 0.0 | GO:0051795 | apoptotic process involved in outflow tract morphogenesis(GO:0003275) uterine wall breakdown(GO:0042704) positive regulation of catagen(GO:0051795) regulation of apoptotic process involved in outflow tract morphogenesis(GO:1902256) |
| 0.0 | 0.1 | GO:0093001 | glycolysis from storage polysaccharide through glucose-1-phosphate(GO:0093001) |
| 0.0 | 0.0 | GO:2001027 | negative regulation of endothelial cell chemotaxis(GO:2001027) |
| 0.0 | 0.1 | GO:1901894 | regulation of calcium-transporting ATPase activity(GO:1901894) |
| 0.0 | 0.2 | GO:0071169 | establishment of protein localization to chromatin(GO:0071169) |
| 0.0 | 0.3 | GO:0010818 | T cell chemotaxis(GO:0010818) |
| 0.0 | 0.1 | GO:2000048 | negative regulation of cell-cell adhesion mediated by cadherin(GO:2000048) |
| 0.0 | 0.1 | GO:0097368 | establishment of Sertoli cell barrier(GO:0097368) |
| 0.0 | 0.1 | GO:1904565 | response to 1-oleoyl-sn-glycerol 3-phosphate(GO:1904565) cellular response to 1-oleoyl-sn-glycerol 3-phosphate(GO:1904566) |
| 0.0 | 0.1 | GO:0035583 | sequestering of TGFbeta in extracellular matrix(GO:0035583) |
| 0.0 | 0.0 | GO:1904235 | interaction with other organism via secreted substance involved in symbiotic interaction(GO:0052047) regulation of substrate-dependent cell migration, cell attachment to substrate(GO:1904235) positive regulation of substrate-dependent cell migration, cell attachment to substrate(GO:1904237) |
Gene overrepresentation in cellular_component category:
| Log-likelihood per target | Total log-likelihood | Term | Description |
|---|---|---|---|
| 0.0 | 0.2 | GO:0097232 | lamellar body membrane(GO:0097232) alveolar lamellar body membrane(GO:0097233) |
| 0.0 | 0.1 | GO:1990130 | Iml1 complex(GO:1990130) |
| 0.0 | 0.1 | GO:0016035 | zeta DNA polymerase complex(GO:0016035) |
| 0.0 | 0.1 | GO:0031262 | Ndc80 complex(GO:0031262) |
| 0.0 | 0.0 | GO:0005944 | phosphatidylinositol 3-kinase complex, class IB(GO:0005944) |
| 0.0 | 0.1 | GO:0005945 | 6-phosphofructokinase complex(GO:0005945) |
Gene overrepresentation in molecular_function category:
| Log-likelihood per target | Total log-likelihood | Term | Description |
|---|---|---|---|
| 0.1 | 0.5 | GO:0004382 | guanosine-diphosphatase activity(GO:0004382) |
| 0.1 | 0.2 | GO:0031728 | CCR3 chemokine receptor binding(GO:0031728) |
| 0.0 | 0.1 | GO:0033858 | N-acetylgalactosamine kinase activity(GO:0033858) |
| 0.0 | 0.2 | GO:0004882 | androgen receptor activity(GO:0004882) |
| 0.0 | 0.2 | GO:0008523 | sodium-dependent multivitamin transmembrane transporter activity(GO:0008523) |
| 0.0 | 0.1 | GO:0050436 | microfibril binding(GO:0050436) |
| 0.0 | 0.3 | GO:0001011 | transcription factor activity, sequence-specific DNA binding, RNA polymerase recruiting(GO:0001011) transcription factor activity, TFIIB-class binding(GO:0001087) |
| 0.0 | 0.1 | GO:0004356 | glutamate-ammonia ligase activity(GO:0004356) ammonia ligase activity(GO:0016211) acid-ammonia (or amide) ligase activity(GO:0016880) |
| 0.0 | 0.0 | GO:0047708 | biotinidase activity(GO:0047708) |
| 0.0 | 0.1 | GO:0086075 | gap junction channel activity involved in cardiac conduction electrical coupling(GO:0086075) |
| 0.0 | 0.0 | GO:0034714 | type III transforming growth factor beta receptor binding(GO:0034714) |
| 0.0 | 0.1 | GO:0008401 | retinoic acid 4-hydroxylase activity(GO:0008401) |
| 0.0 | 0.1 | GO:1990380 | Lys48-specific deubiquitinase activity(GO:1990380) |