Project
A549 cells infected with SARS-CoV-2 Analysis Results (GEO series: GSE147507)
Navigation
Downloads
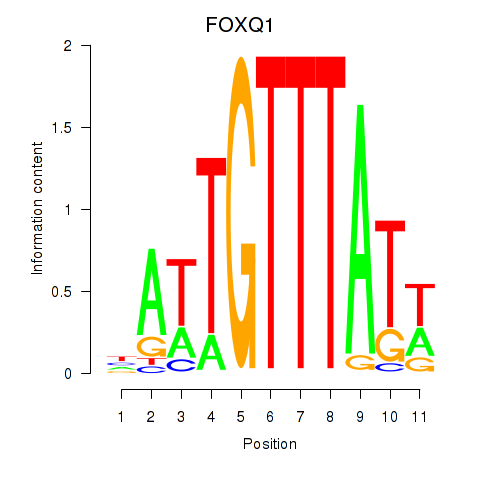
Results for FOXQ1
Z-value: 1.30
Motif logo
Transcription factors associated with FOXQ1
| Gene Symbol | Gene ID | Gene Info |
|---|---|---|
|
FOXQ1
|
ENSG00000164379.4 | forkhead box Q1 |
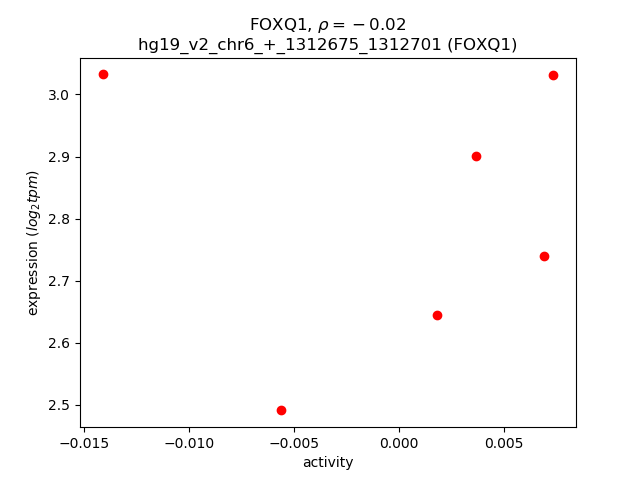
Activity-expression correlation:
| Gene | Promoter | Pearson corr. coef. | P-value | Plot |
|---|---|---|---|---|
| FOXQ1 | hg19_v2_chr6_+_1312675_1312701 | -0.02 | 9.7e-01 | Click! |
Activity profile of FOXQ1 motif
Sorted Z-values of FOXQ1 motif
| Promoter | Log-likelihood | Transcript | Gene | Gene Info |
|---|---|---|---|---|
| chr1_-_27998689 | 4.76 |
ENST00000339145.4
ENST00000362020.4 ENST00000361157.6 |
IFI6
|
interferon, alpha-inducible protein 6 |
| chr11_-_615942 | 2.05 |
ENST00000397562.3
ENST00000330243.5 ENST00000397570.1 ENST00000397574.2 |
IRF7
|
interferon regulatory factor 7 |
| chr11_-_615570 | 1.92 |
ENST00000525445.1
ENST00000348655.6 ENST00000397566.1 |
IRF7
|
interferon regulatory factor 7 |
| chr2_-_37374876 | 1.22 |
ENST00000405334.1
|
EIF2AK2
|
eukaryotic translation initiation factor 2-alpha kinase 2 |
| chr4_-_111120334 | 1.17 |
ENST00000503885.1
|
ELOVL6
|
ELOVL fatty acid elongase 6 |
| chr3_+_136649311 | 1.04 |
ENST00000469404.1
ENST00000467911.1 |
NCK1
|
NCK adaptor protein 1 |
| chr15_+_63188009 | 1.01 |
ENST00000557900.1
|
RP11-1069G10.2
|
RP11-1069G10.2 |
| chr3_+_164924716 | 0.89 |
ENST00000470138.1
ENST00000498616.1 |
RP11-85M11.2
|
RP11-85M11.2 |
| chrM_+_10464 | 0.88 |
ENST00000361335.1
|
MT-ND4L
|
mitochondrially encoded NADH dehydrogenase 4L |
| chr7_-_81635106 | 0.85 |
ENST00000443883.1
|
CACNA2D1
|
calcium channel, voltage-dependent, alpha 2/delta subunit 1 |
| chr15_+_49715449 | 0.85 |
ENST00000560979.1
|
FGF7
|
fibroblast growth factor 7 |
| chr6_-_32083106 | 0.84 |
ENST00000442721.1
|
TNXB
|
tenascin XB |
| chr17_+_45771420 | 0.82 |
ENST00000578982.1
|
TBKBP1
|
TBK1 binding protein 1 |
| chr4_-_111120132 | 0.82 |
ENST00000506625.1
|
ELOVL6
|
ELOVL fatty acid elongase 6 |
| chr5_+_94982435 | 0.80 |
ENST00000511684.1
ENST00000380005.4 |
RFESD
|
Rieske (Fe-S) domain containing |
| chr10_-_36813162 | 0.79 |
ENST00000440465.1
|
NAMPTL
|
nicotinamide phosphoribosyltransferase-like |
| chr2_-_188419078 | 0.73 |
ENST00000437725.1
ENST00000409676.1 ENST00000339091.4 ENST00000420747.1 |
TFPI
|
tissue factor pathway inhibitor (lipoprotein-associated coagulation inhibitor) |
| chr2_+_173955327 | 0.72 |
ENST00000422149.1
|
MLTK
|
Mitogen-activated protein kinase kinase kinase MLT |
| chr4_+_86749045 | 0.71 |
ENST00000514229.1
|
ARHGAP24
|
Rho GTPase activating protein 24 |
| chr8_+_142264664 | 0.70 |
ENST00000518520.1
|
RP11-10J21.3
|
Uncharacterized protein |
| chr2_-_61389240 | 0.70 |
ENST00000606876.1
|
RP11-493E12.1
|
RP11-493E12.1 |
| chr17_-_39341594 | 0.69 |
ENST00000398472.1
|
KRTAP4-1
|
keratin associated protein 4-1 |
| chr14_+_51026926 | 0.68 |
ENST00000557735.1
|
ATL1
|
atlastin GTPase 1 |
| chr21_-_16254231 | 0.67 |
ENST00000412426.1
ENST00000418954.1 |
AF127936.7
|
AF127936.7 |
| chr17_+_68164752 | 0.63 |
ENST00000535240.1
|
KCNJ2
|
potassium inwardly-rectifying channel, subfamily J, member 2 |
| chr4_-_159094194 | 0.63 |
ENST00000592057.1
ENST00000585682.1 ENST00000393807.5 |
FAM198B
|
family with sequence similarity 198, member B |
| chr3_-_148939598 | 0.62 |
ENST00000455472.3
|
CP
|
ceruloplasmin (ferroxidase) |
| chr7_-_64023441 | 0.61 |
ENST00000309683.6
|
ZNF680
|
zinc finger protein 680 |
| chr21_-_33975547 | 0.61 |
ENST00000431599.1
|
C21orf59
|
chromosome 21 open reading frame 59 |
| chr17_+_70036164 | 0.60 |
ENST00000602013.1
|
AC007461.1
|
Uncharacterized protein |
| chr12_-_76478386 | 0.59 |
ENST00000535020.2
|
NAP1L1
|
nucleosome assembly protein 1-like 1 |
| chr3_+_172468749 | 0.59 |
ENST00000366254.2
ENST00000415665.1 ENST00000438041.1 |
ECT2
|
epithelial cell transforming sequence 2 oncogene |
| chr1_+_92632542 | 0.58 |
ENST00000409154.4
ENST00000370378.4 |
KIAA1107
|
KIAA1107 |
| chr7_-_124569991 | 0.57 |
ENST00000446993.1
ENST00000357628.3 ENST00000393329.1 |
POT1
|
protection of telomeres 1 |
| chr19_+_44455368 | 0.57 |
ENST00000591168.1
ENST00000587682.1 ENST00000251269.5 |
ZNF221
|
zinc finger protein 221 |
| chr2_-_188419200 | 0.57 |
ENST00000233156.3
ENST00000426055.1 ENST00000453013.1 ENST00000417013.1 |
TFPI
|
tissue factor pathway inhibitor (lipoprotein-associated coagulation inhibitor) |
| chr10_-_94301107 | 0.55 |
ENST00000436178.1
|
IDE
|
insulin-degrading enzyme |
| chr5_-_24645078 | 0.54 |
ENST00000264463.4
|
CDH10
|
cadherin 10, type 2 (T2-cadherin) |
| chrM_+_10758 | 0.54 |
ENST00000361381.2
|
MT-ND4
|
mitochondrially encoded NADH dehydrogenase 4 |
| chr1_+_70820451 | 0.53 |
ENST00000361764.4
ENST00000359875.5 ENST00000370940.5 ENST00000531950.1 ENST00000432224.1 |
HHLA3
|
HERV-H LTR-associating 3 |
| chr1_+_151739131 | 0.53 |
ENST00000400999.1
|
OAZ3
|
ornithine decarboxylase antizyme 3 |
| chr1_+_95616933 | 0.52 |
ENST00000604203.1
|
RP11-57H12.6
|
TMEM56-RWDD3 readthrough |
| chr4_+_17578815 | 0.52 |
ENST00000226299.4
|
LAP3
|
leucine aminopeptidase 3 |
| chr3_+_98699880 | 0.51 |
ENST00000473756.1
|
LINC00973
|
long intergenic non-protein coding RNA 973 |
| chr1_+_215747118 | 0.51 |
ENST00000448333.1
|
KCTD3
|
potassium channel tetramerization domain containing 3 |
| chrM_+_5824 | 0.50 |
ENST00000361624.2
|
MT-CO1
|
mitochondrially encoded cytochrome c oxidase I |
| chr14_+_51026844 | 0.50 |
ENST00000554886.1
|
ATL1
|
atlastin GTPase 1 |
| chr8_+_94767072 | 0.50 |
ENST00000452276.1
ENST00000453321.3 ENST00000498673.1 ENST00000518319.1 |
TMEM67
|
transmembrane protein 67 |
| chr12_-_8803128 | 0.49 |
ENST00000543467.1
|
MFAP5
|
microfibrillar associated protein 5 |
| chr6_+_123038689 | 0.49 |
ENST00000354275.2
ENST00000368446.1 |
PKIB
|
protein kinase (cAMP-dependent, catalytic) inhibitor beta |
| chr4_+_155484155 | 0.49 |
ENST00000509493.1
|
FGB
|
fibrinogen beta chain |
| chr16_-_90096309 | 0.49 |
ENST00000408886.2
|
C16orf3
|
chromosome 16 open reading frame 3 |
| chr4_-_103266626 | 0.48 |
ENST00000356736.4
|
SLC39A8
|
solute carrier family 39 (zinc transporter), member 8 |
| chr9_-_3469181 | 0.48 |
ENST00000366116.2
|
AL365202.1
|
Uncharacterized protein |
| chr7_+_7196565 | 0.48 |
ENST00000429911.1
|
C1GALT1
|
core 1 synthase, glycoprotein-N-acetylgalactosamine 3-beta-galactosyltransferase, 1 |
| chr12_-_76461249 | 0.48 |
ENST00000551524.1
|
NAP1L1
|
nucleosome assembly protein 1-like 1 |
| chr4_+_79567362 | 0.47 |
ENST00000512322.1
|
RP11-792D21.2
|
long intergenic non-protein coding RNA 1094 |
| chr19_-_48823332 | 0.47 |
ENST00000315396.7
|
CCDC114
|
coiled-coil domain containing 114 |
| chr1_-_54405773 | 0.46 |
ENST00000371376.1
|
HSPB11
|
heat shock protein family B (small), member 11 |
| chr14_-_35591156 | 0.46 |
ENST00000554361.1
|
PPP2R3C
|
protein phosphatase 2, regulatory subunit B'', gamma |
| chr3_-_96337000 | 0.46 |
ENST00000600213.2
|
MTRNR2L12
|
MT-RNR2-like 12 (pseudogene) |
| chr8_-_17752912 | 0.45 |
ENST00000398054.1
ENST00000381840.2 |
FGL1
|
fibrinogen-like 1 |
| chr3_+_69811858 | 0.45 |
ENST00000433517.1
|
MITF
|
microphthalmia-associated transcription factor |
| chr4_-_70626430 | 0.45 |
ENST00000310613.3
|
SULT1B1
|
sulfotransferase family, cytosolic, 1B, member 1 |
| chr15_+_57891609 | 0.45 |
ENST00000569089.1
|
MYZAP
|
myocardial zonula adherens protein |
| chr1_+_240177627 | 0.45 |
ENST00000447095.1
|
FMN2
|
formin 2 |
| chr12_-_76478417 | 0.45 |
ENST00000552342.1
|
NAP1L1
|
nucleosome assembly protein 1-like 1 |
| chr8_+_110551925 | 0.45 |
ENST00000395785.2
|
EBAG9
|
estrogen receptor binding site associated, antigen, 9 |
| chr11_+_34654011 | 0.43 |
ENST00000531794.1
|
EHF
|
ets homologous factor |
| chr9_-_123812542 | 0.43 |
ENST00000223642.1
|
C5
|
complement component 5 |
| chr4_+_95174445 | 0.43 |
ENST00000509418.1
|
SMARCAD1
|
SWI/SNF-related, matrix-associated actin-dependent regulator of chromatin, subfamily a, containing DEAD/H box 1 |
| chr4_-_111119804 | 0.43 |
ENST00000394607.3
ENST00000302274.3 |
ELOVL6
|
ELOVL fatty acid elongase 6 |
| chr20_+_12989596 | 0.42 |
ENST00000434210.1
ENST00000399002.2 |
SPTLC3
|
serine palmitoyltransferase, long chain base subunit 3 |
| chr3_+_157154578 | 0.42 |
ENST00000295927.3
|
PTX3
|
pentraxin 3, long |
| chr2_-_150444116 | 0.42 |
ENST00000428879.1
ENST00000422782.2 |
MMADHC
|
methylmalonic aciduria (cobalamin deficiency) cblD type, with homocystinuria |
| chr4_-_74853897 | 0.41 |
ENST00000296028.3
|
PPBP
|
pro-platelet basic protein (chemokine (C-X-C motif) ligand 7) |
| chr14_+_52456327 | 0.41 |
ENST00000556760.1
|
C14orf166
|
chromosome 14 open reading frame 166 |
| chr12_-_102133191 | 0.41 |
ENST00000392924.1
ENST00000266743.2 ENST00000392927.3 |
SYCP3
|
synaptonemal complex protein 3 |
| chr6_-_133084580 | 0.40 |
ENST00000525270.1
ENST00000530536.1 ENST00000524919.1 |
VNN2
|
vanin 2 |
| chr14_+_56078695 | 0.40 |
ENST00000416613.1
|
KTN1
|
kinectin 1 (kinesin receptor) |
| chr18_+_61445007 | 0.40 |
ENST00000447428.1
ENST00000546027.1 |
SERPINB7
|
serpin peptidase inhibitor, clade B (ovalbumin), member 7 |
| chr3_-_178976996 | 0.40 |
ENST00000485523.1
|
KCNMB3
|
potassium large conductance calcium-activated channel, subfamily M beta member 3 |
| chrX_+_49020882 | 0.40 |
ENST00000454342.1
|
MAGIX
|
MAGI family member, X-linked |
| chr10_+_94594351 | 0.39 |
ENST00000371552.4
|
EXOC6
|
exocyst complex component 6 |
| chr14_-_23288930 | 0.39 |
ENST00000554517.1
ENST00000285850.7 ENST00000397529.2 ENST00000555702.1 |
SLC7A7
|
solute carrier family 7 (amino acid transporter light chain, y+L system), member 7 |
| chr5_+_65440032 | 0.39 |
ENST00000334121.6
|
SREK1
|
splicing regulatory glutamine/lysine-rich protein 1 |
| chr5_+_64920543 | 0.38 |
ENST00000399438.3
ENST00000510585.2 |
TRAPPC13
CTC-534A2.2
|
trafficking protein particle complex 13 CDNA FLJ26957 fis, clone SLV00486; Uncharacterized protein |
| chr1_+_16083098 | 0.38 |
ENST00000496928.2
ENST00000508310.1 |
FBLIM1
|
filamin binding LIM protein 1 |
| chr12_-_76462713 | 0.38 |
ENST00000552056.1
|
NAP1L1
|
nucleosome assembly protein 1-like 1 |
| chr6_+_151358048 | 0.38 |
ENST00000450635.1
|
MTHFD1L
|
methylenetetrahydrofolate dehydrogenase (NADP+ dependent) 1-like |
| chr12_-_76478446 | 0.38 |
ENST00000393263.3
ENST00000548044.1 ENST00000547704.1 ENST00000431879.3 ENST00000549596.1 ENST00000550934.1 ENST00000551600.1 ENST00000547479.1 ENST00000547773.1 ENST00000544816.1 ENST00000542344.1 ENST00000548273.1 |
NAP1L1
|
nucleosome assembly protein 1-like 1 |
| chr2_-_150444300 | 0.38 |
ENST00000303319.5
|
MMADHC
|
methylmalonic aciduria (cobalamin deficiency) cblD type, with homocystinuria |
| chr3_-_145940214 | 0.37 |
ENST00000481701.1
|
PLSCR4
|
phospholipid scramblase 4 |
| chr9_+_79792410 | 0.37 |
ENST00000357409.5
|
VPS13A
|
vacuolar protein sorting 13 homolog A (S. cerevisiae) |
| chr6_-_114194483 | 0.37 |
ENST00000434296.2
|
RP1-249H1.4
|
RP1-249H1.4 |
| chr15_-_59041768 | 0.37 |
ENST00000402627.1
ENST00000396140.2 ENST00000559053.1 ENST00000561288.1 |
ADAM10
|
ADAM metallopeptidase domain 10 |
| chr6_+_12008986 | 0.36 |
ENST00000491710.1
|
HIVEP1
|
human immunodeficiency virus type I enhancer binding protein 1 |
| chr8_+_109455845 | 0.36 |
ENST00000220853.3
|
EMC2
|
ER membrane protein complex subunit 2 |
| chr3_+_190333097 | 0.36 |
ENST00000412080.1
|
IL1RAP
|
interleukin 1 receptor accessory protein |
| chr9_+_67977438 | 0.36 |
ENST00000456982.1
|
RP11-195B21.3
|
Protein LOC644249 |
| chr9_+_82267508 | 0.35 |
ENST00000490347.1
|
TLE4
|
transducin-like enhancer of split 4 (E(sp1) homolog, Drosophila) |
| chr18_-_57027194 | 0.35 |
ENST00000251047.5
|
LMAN1
|
lectin, mannose-binding, 1 |
| chr19_+_35899569 | 0.35 |
ENST00000600405.1
|
AC002511.1
|
AC002511.1 |
| chr7_+_135611542 | 0.35 |
ENST00000416501.1
|
AC015987.2
|
AC015987.2 |
| chr3_+_184529948 | 0.35 |
ENST00000436792.2
ENST00000446204.2 ENST00000422105.1 |
VPS8
|
vacuolar protein sorting 8 homolog (S. cerevisiae) |
| chr2_-_225434538 | 0.34 |
ENST00000409096.1
|
CUL3
|
cullin 3 |
| chr2_+_170440844 | 0.34 |
ENST00000260970.3
ENST00000433207.1 ENST00000409714.3 ENST00000462903.1 |
PPIG
|
peptidylprolyl isomerase G (cyclophilin G) |
| chr8_-_103884640 | 0.34 |
ENST00000520402.1
|
AZIN1
|
antizyme inhibitor 1 |
| chr8_+_110552046 | 0.34 |
ENST00000529931.1
|
EBAG9
|
estrogen receptor binding site associated, antigen, 9 |
| chr6_+_21666633 | 0.34 |
ENST00000606851.1
|
CASC15
|
cancer susceptibility candidate 15 (non-protein coding) |
| chr3_+_184529929 | 0.33 |
ENST00000287546.4
ENST00000437079.3 |
VPS8
|
vacuolar protein sorting 8 homolog (S. cerevisiae) |
| chr9_-_119162885 | 0.33 |
ENST00000445861.2
|
PAPPA-AS1
|
PAPPA antisense RNA 1 |
| chr5_-_159846066 | 0.33 |
ENST00000519349.1
ENST00000520664.1 |
SLU7
|
SLU7 splicing factor homolog (S. cerevisiae) |
| chr11_-_14521379 | 0.33 |
ENST00000249923.3
ENST00000529866.1 ENST00000439561.2 ENST00000534771.1 |
COPB1
|
coatomer protein complex, subunit beta 1 |
| chr8_-_30013748 | 0.32 |
ENST00000607315.1
|
RP11-51J9.5
|
RP11-51J9.5 |
| chr5_+_64920826 | 0.32 |
ENST00000438419.2
ENST00000231526.4 ENST00000505553.1 ENST00000545191.1 |
TRAPPC13
|
trafficking protein particle complex 13 |
| chr10_-_52008313 | 0.32 |
ENST00000329428.6
ENST00000395526.4 ENST00000447815.1 |
ASAH2
|
N-acylsphingosine amidohydrolase (non-lysosomal ceramidase) 2 |
| chr4_+_155484103 | 0.32 |
ENST00000302068.4
|
FGB
|
fibrinogen beta chain |
| chr1_+_84629976 | 0.32 |
ENST00000446538.1
ENST00000370684.1 ENST00000436133.1 |
PRKACB
|
protein kinase, cAMP-dependent, catalytic, beta |
| chr2_+_143635222 | 0.32 |
ENST00000375773.2
ENST00000409512.1 ENST00000410015.2 |
KYNU
|
kynureninase |
| chr4_-_147443043 | 0.32 |
ENST00000394059.4
ENST00000502607.1 ENST00000335472.7 ENST00000432059.2 ENST00000394062.3 |
SLC10A7
|
solute carrier family 10, member 7 |
| chr8_-_55014018 | 0.32 |
ENST00000521352.1
|
LYPLA1
|
lysophospholipase I |
| chr3_+_122513642 | 0.32 |
ENST00000261038.5
|
DIRC2
|
disrupted in renal carcinoma 2 |
| chr5_-_41510725 | 0.32 |
ENST00000328457.3
|
PLCXD3
|
phosphatidylinositol-specific phospholipase C, X domain containing 3 |
| chr14_+_56127989 | 0.31 |
ENST00000555573.1
|
KTN1
|
kinectin 1 (kinesin receptor) |
| chr17_+_9745786 | 0.31 |
ENST00000304773.5
|
GLP2R
|
glucagon-like peptide 2 receptor |
| chr12_-_51418549 | 0.31 |
ENST00000548150.1
|
SLC11A2
|
solute carrier family 11 (proton-coupled divalent metal ion transporter), member 2 |
| chr2_+_105050794 | 0.31 |
ENST00000429464.1
ENST00000414442.1 ENST00000447380.1 |
AC013402.2
|
long intergenic non-protein coding RNA 1102 |
| chr15_+_80351977 | 0.31 |
ENST00000559157.1
ENST00000561012.1 ENST00000564367.1 ENST00000558494.1 |
ZFAND6
|
zinc finger, AN1-type domain 6 |
| chr11_+_6947647 | 0.31 |
ENST00000278319.5
|
ZNF215
|
zinc finger protein 215 |
| chr8_-_82644562 | 0.31 |
ENST00000520604.1
ENST00000521742.1 ENST00000520635.1 |
ZFAND1
|
zinc finger, AN1-type domain 1 |
| chr3_-_57233966 | 0.31 |
ENST00000473921.1
ENST00000295934.3 |
HESX1
|
HESX homeobox 1 |
| chr1_+_63989004 | 0.31 |
ENST00000371088.4
|
EFCAB7
|
EF-hand calcium binding domain 7 |
| chr8_+_94767109 | 0.31 |
ENST00000409623.3
ENST00000453906.1 ENST00000521517.1 |
TMEM67
|
transmembrane protein 67 |
| chr1_+_120839412 | 0.30 |
ENST00000355228.4
|
FAM72B
|
family with sequence similarity 72, member B |
| chr14_+_96722539 | 0.30 |
ENST00000553356.1
|
BDKRB1
|
bradykinin receptor B1 |
| chr2_+_190306159 | 0.30 |
ENST00000314761.4
|
WDR75
|
WD repeat domain 75 |
| chr11_-_107328527 | 0.30 |
ENST00000282251.5
ENST00000433523.1 |
CWF19L2
|
CWF19-like 2, cell cycle control (S. pombe) |
| chr3_-_156840776 | 0.30 |
ENST00000471357.1
|
LINC00880
|
long intergenic non-protein coding RNA 880 |
| chr1_+_172422026 | 0.30 |
ENST00000367725.4
|
C1orf105
|
chromosome 1 open reading frame 105 |
| chr12_-_10588539 | 0.29 |
ENST00000381902.2
ENST00000381901.1 ENST00000539033.1 |
KLRC2
NKG2-E
|
killer cell lectin-like receptor subfamily C, member 2 Uncharacterized protein |
| chr15_-_56757329 | 0.29 |
ENST00000260453.3
|
MNS1
|
meiosis-specific nuclear structural 1 |
| chr9_-_15472730 | 0.29 |
ENST00000481862.1
|
PSIP1
|
PC4 and SFRS1 interacting protein 1 |
| chr14_+_56127960 | 0.29 |
ENST00000553624.1
|
KTN1
|
kinectin 1 (kinesin receptor) |
| chr6_+_88182643 | 0.29 |
ENST00000369556.3
ENST00000544441.1 ENST00000369552.4 ENST00000369557.5 |
SLC35A1
|
solute carrier family 35 (CMP-sialic acid transporter), member A1 |
| chr2_+_201450591 | 0.29 |
ENST00000374700.2
|
AOX1
|
aldehyde oxidase 1 |
| chr10_-_21661870 | 0.29 |
ENST00000433460.1
|
RP11-275N1.1
|
RP11-275N1.1 |
| chr2_+_143635067 | 0.29 |
ENST00000264170.4
|
KYNU
|
kynureninase |
| chr8_+_125486939 | 0.28 |
ENST00000303545.3
|
RNF139
|
ring finger protein 139 |
| chr4_-_147442817 | 0.28 |
ENST00000507030.1
|
SLC10A7
|
solute carrier family 10, member 7 |
| chr19_+_11466062 | 0.28 |
ENST00000251473.5
ENST00000591329.1 ENST00000586380.1 |
DKFZP761J1410
|
Lipid phosphate phosphatase-related protein type 2 |
| chrX_-_71525742 | 0.28 |
ENST00000450875.1
ENST00000417400.1 ENST00000431381.1 ENST00000445983.1 |
CITED1
|
Cbp/p300-interacting transactivator, with Glu/Asp-rich carboxy-terminal domain, 1 |
| chr6_+_136172820 | 0.28 |
ENST00000308191.6
|
PDE7B
|
phosphodiesterase 7B |
| chrX_+_9880412 | 0.28 |
ENST00000418909.2
|
SHROOM2
|
shroom family member 2 |
| chr5_+_136070614 | 0.28 |
ENST00000502421.1
|
CTB-1I21.1
|
CTB-1I21.1 |
| chr5_+_93954039 | 0.28 |
ENST00000265140.5
|
ANKRD32
|
ankyrin repeat domain 32 |
| chr18_-_52626622 | 0.28 |
ENST00000591504.1
|
CCDC68
|
coiled-coil domain containing 68 |
| chr4_-_185694872 | 0.28 |
ENST00000505492.1
|
ACSL1
|
acyl-CoA synthetase long-chain family member 1 |
| chr14_+_67831576 | 0.28 |
ENST00000555876.1
|
EIF2S1
|
eukaryotic translation initiation factor 2, subunit 1 alpha, 35kDa |
| chr14_+_73563735 | 0.28 |
ENST00000532192.1
|
RBM25
|
RNA binding motif protein 25 |
| chr17_-_29233769 | 0.27 |
ENST00000581216.1
|
TEFM
|
transcription elongation factor, mitochondrial |
| chr1_+_104159999 | 0.27 |
ENST00000414303.2
ENST00000423678.1 |
AMY2A
|
amylase, alpha 2A (pancreatic) |
| chr1_-_182360498 | 0.27 |
ENST00000417584.2
|
GLUL
|
glutamate-ammonia ligase |
| chr4_+_95916947 | 0.26 |
ENST00000506363.1
|
BMPR1B
|
bone morphogenetic protein receptor, type IB |
| chrX_-_99891796 | 0.26 |
ENST00000373020.4
|
TSPAN6
|
tetraspanin 6 |
| chr3_-_19975665 | 0.26 |
ENST00000295824.9
ENST00000389256.4 |
EFHB
|
EF-hand domain family, member B |
| chr4_+_26578293 | 0.26 |
ENST00000512840.1
|
TBC1D19
|
TBC1 domain family, member 19 |
| chr8_-_95487331 | 0.25 |
ENST00000336148.5
|
RAD54B
|
RAD54 homolog B (S. cerevisiae) |
| chr1_+_24645807 | 0.25 |
ENST00000361548.4
|
GRHL3
|
grainyhead-like 3 (Drosophila) |
| chr6_-_28554977 | 0.25 |
ENST00000452236.2
|
SCAND3
|
SCAN domain containing 3 |
| chr12_+_28410128 | 0.25 |
ENST00000381259.1
ENST00000381256.1 |
CCDC91
|
coiled-coil domain containing 91 |
| chrM_+_10053 | 0.25 |
ENST00000361227.2
|
MT-ND3
|
mitochondrially encoded NADH dehydrogenase 3 |
| chr2_+_183582774 | 0.25 |
ENST00000537515.1
|
DNAJC10
|
DnaJ (Hsp40) homolog, subfamily C, member 10 |
| chr14_+_51026743 | 0.25 |
ENST00000358385.6
ENST00000357032.3 ENST00000354525.4 |
ATL1
|
atlastin GTPase 1 |
| chr1_+_24645865 | 0.25 |
ENST00000342072.4
|
GRHL3
|
grainyhead-like 3 (Drosophila) |
| chr5_-_111091948 | 0.25 |
ENST00000447165.2
|
NREP
|
neuronal regeneration related protein |
| chr10_-_73848086 | 0.24 |
ENST00000536168.1
|
SPOCK2
|
sparc/osteonectin, cwcv and kazal-like domains proteoglycan (testican) 2 |
| chr15_-_55489097 | 0.24 |
ENST00000260443.4
|
RSL24D1
|
ribosomal L24 domain containing 1 |
| chr2_-_55459294 | 0.24 |
ENST00000407122.1
ENST00000406437.2 |
CLHC1
|
clathrin heavy chain linker domain containing 1 |
| chr5_+_102201722 | 0.24 |
ENST00000274392.9
ENST00000455264.2 |
PAM
|
peptidylglycine alpha-amidating monooxygenase |
| chr4_+_86396321 | 0.24 |
ENST00000503995.1
|
ARHGAP24
|
Rho GTPase activating protein 24 |
| chr17_-_38574169 | 0.24 |
ENST00000423485.1
|
TOP2A
|
topoisomerase (DNA) II alpha 170kDa |
| chr5_+_118690466 | 0.24 |
ENST00000503646.1
|
TNFAIP8
|
tumor necrosis factor, alpha-induced protein 8 |
| chr12_+_19928380 | 0.24 |
ENST00000535764.1
|
RP11-405A12.2
|
RP11-405A12.2 |
| chr5_-_159846399 | 0.24 |
ENST00000297151.4
|
SLU7
|
SLU7 splicing factor homolog (S. cerevisiae) |
| chr10_+_35484793 | 0.23 |
ENST00000488741.1
ENST00000474931.1 ENST00000468236.1 ENST00000344351.5 ENST00000490511.1 |
CREM
|
cAMP responsive element modulator |
| chr7_+_95115210 | 0.23 |
ENST00000428113.1
ENST00000325885.5 |
ASB4
|
ankyrin repeat and SOCS box containing 4 |
| chr5_+_140625147 | 0.23 |
ENST00000231173.3
|
PCDHB15
|
protocadherin beta 15 |
| chr1_+_24646002 | 0.23 |
ENST00000356046.2
|
GRHL3
|
grainyhead-like 3 (Drosophila) |
| chr13_+_33160553 | 0.23 |
ENST00000315596.10
|
PDS5B
|
PDS5, regulator of cohesion maintenance, homolog B (S. cerevisiae) |
| chr14_-_34420259 | 0.23 |
ENST00000250457.3
ENST00000547327.2 |
EGLN3
|
egl-9 family hypoxia-inducible factor 3 |
| chr1_-_115259337 | 0.22 |
ENST00000369535.4
|
NRAS
|
neuroblastoma RAS viral (v-ras) oncogene homolog |
| chr2_+_170440902 | 0.22 |
ENST00000448752.2
ENST00000418888.1 ENST00000414307.1 |
PPIG
|
peptidylprolyl isomerase G (cyclophilin G) |
| chr15_+_89182178 | 0.22 |
ENST00000559876.1
|
ISG20
|
interferon stimulated exonuclease gene 20kDa |
| chr7_-_140624499 | 0.22 |
ENST00000288602.6
|
BRAF
|
v-raf murine sarcoma viral oncogene homolog B |
| chr12_+_72233487 | 0.22 |
ENST00000482439.2
ENST00000550746.1 ENST00000491063.1 ENST00000319106.8 ENST00000485960.2 ENST00000393309.3 |
TBC1D15
|
TBC1 domain family, member 15 |
| chr15_+_89182156 | 0.22 |
ENST00000379224.5
|
ISG20
|
interferon stimulated exonuclease gene 20kDa |
| chr10_+_13652047 | 0.22 |
ENST00000601460.1
|
RP11-295P9.3
|
Uncharacterized protein |
| chr16_-_25122735 | 0.22 |
ENST00000563176.1
|
RP11-449H11.1
|
RP11-449H11.1 |
| chr16_-_71323617 | 0.22 |
ENST00000563876.1
|
CMTR2
|
cap methyltransferase 2 |
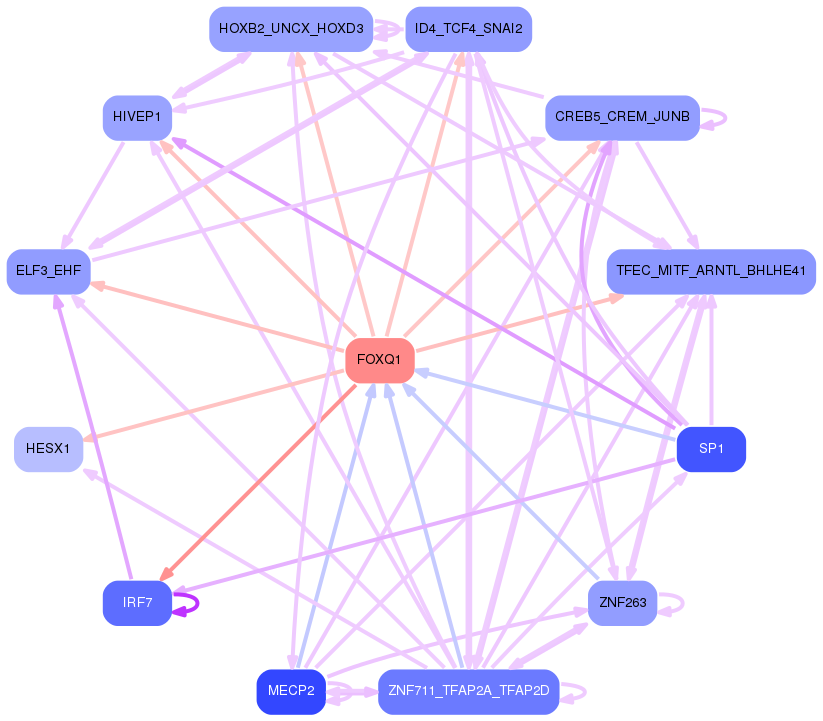
Network of associatons between targets according to the STRING database.

First level regulatory network of FOXQ1
Gene Ontology Analysis
Gene overrepresentation in biological_process category:
| Log-likelihood per target | Total log-likelihood | Term | Description |
|---|---|---|---|
| 1.3 | 4.0 | GO:0034124 | regulation of MyD88-dependent toll-like receptor signaling pathway(GO:0034124) |
| 0.4 | 4.8 | GO:0051902 | negative regulation of mitochondrial depolarization(GO:0051902) |
| 0.3 | 1.0 | GO:1903674 | regulation of cap-dependent translational initiation(GO:1903674) positive regulation of cap-dependent translational initiation(GO:1903676) |
| 0.2 | 2.4 | GO:0019367 | fatty acid elongation, saturated fatty acid(GO:0019367) fatty acid elongation, unsaturated fatty acid(GO:0019368) fatty acid elongation, monounsaturated fatty acid(GO:0034625) fatty acid elongation, polyunsaturated fatty acid(GO:0034626) |
| 0.2 | 0.6 | GO:0060382 | regulation of DNA strand elongation(GO:0060382) |
| 0.2 | 1.3 | GO:0007598 | blood coagulation, extrinsic pathway(GO:0007598) |
| 0.2 | 1.0 | GO:0060437 | lung growth(GO:0060437) |
| 0.2 | 0.6 | GO:0019442 | tryptophan catabolic process to acetyl-CoA(GO:0019442) |
| 0.1 | 0.4 | GO:0051758 | homologous chromosome movement towards spindle pole involved in homologous chromosome segregation(GO:0051758) |
| 0.1 | 0.6 | GO:1901143 | insulin catabolic process(GO:1901143) |
| 0.1 | 0.4 | GO:0008057 | eye pigment granule organization(GO:0008057) |
| 0.1 | 0.4 | GO:0036451 | cap mRNA methylation(GO:0036451) |
| 0.1 | 0.6 | GO:0090076 | relaxation of skeletal muscle(GO:0090076) |
| 0.1 | 1.2 | GO:0051834 | evasion or tolerance of host defenses by virus(GO:0019049) avoidance of host defenses(GO:0044413) evasion or tolerance of host defenses(GO:0044415) avoidance of defenses of other organism involved in symbiotic interaction(GO:0051832) evasion or tolerance of defenses of other organism involved in symbiotic interaction(GO:0051834) |
| 0.1 | 0.5 | GO:0006542 | glutamine biosynthetic process(GO:0006542) |
| 0.1 | 0.5 | GO:0016267 | O-glycan processing, core 1(GO:0016267) |
| 0.1 | 0.5 | GO:1902268 | negative regulation of polyamine transmembrane transport(GO:1902268) |
| 0.1 | 0.8 | GO:0086048 | membrane depolarization during bundle of His cell action potential(GO:0086048) |
| 0.1 | 0.5 | GO:0000738 | DNA catabolic process, exonucleolytic(GO:0000738) |
| 0.1 | 0.5 | GO:0051088 | PMA-inducible membrane protein ectodomain proteolysis(GO:0051088) |
| 0.1 | 0.5 | GO:0010760 | negative regulation of macrophage chemotaxis(GO:0010760) |
| 0.1 | 0.4 | GO:1902626 | assembly of large subunit precursor of preribosome(GO:1902626) |
| 0.1 | 0.3 | GO:1902267 | polyamine transmembrane transport(GO:1902047) regulation of polyamine transmembrane transport(GO:1902267) |
| 0.1 | 0.4 | GO:0001878 | response to yeast(GO:0001878) |
| 0.1 | 0.4 | GO:0090362 | positive regulation of platelet-derived growth factor production(GO:0090362) |
| 0.1 | 0.4 | GO:0009257 | 10-formyltetrahydrofolate biosynthetic process(GO:0009257) |
| 0.1 | 0.8 | GO:0043152 | induction of bacterial agglutination(GO:0043152) |
| 0.1 | 0.4 | GO:0097089 | methyl-branched fatty acid metabolic process(GO:0097089) |
| 0.1 | 0.3 | GO:0046110 | xanthine metabolic process(GO:0046110) |
| 0.1 | 0.2 | GO:0033364 | mast cell secretory granule organization(GO:0033364) |
| 0.1 | 0.3 | GO:1990737 | response to manganese-induced endoplasmic reticulum stress(GO:1990737) |
| 0.1 | 0.3 | GO:0001831 | trophectodermal cellular morphogenesis(GO:0001831) |
| 0.1 | 0.5 | GO:0035093 | spermatogenesis, exchange of chromosomal proteins(GO:0035093) |
| 0.1 | 0.4 | GO:0002001 | renal response to blood flow involved in circulatory renin-angiotensin regulation of systemic arterial blood pressure(GO:0001999) renin secretion into blood stream(GO:0002001) |
| 0.1 | 0.4 | GO:0036111 | very long-chain fatty-acyl-CoA metabolic process(GO:0036111) |
| 0.1 | 0.7 | GO:0015691 | cadmium ion transport(GO:0015691) cadmium ion transmembrane transport(GO:0070574) |
| 0.1 | 0.5 | GO:0006390 | transcription from mitochondrial promoter(GO:0006390) |
| 0.1 | 0.3 | GO:0044245 | polysaccharide digestion(GO:0044245) |
| 0.1 | 0.2 | GO:0002188 | translation reinitiation(GO:0002188) |
| 0.1 | 0.4 | GO:0038172 | interleukin-33-mediated signaling pathway(GO:0038172) |
| 0.1 | 0.6 | GO:0000389 | mRNA 3'-splice site recognition(GO:0000389) |
| 0.1 | 0.2 | GO:0006433 | glutamyl-tRNA aminoacylation(GO:0006424) prolyl-tRNA aminoacylation(GO:0006433) |
| 0.0 | 0.3 | GO:2000234 | positive regulation of ribosome biogenesis(GO:0090070) positive regulation of rRNA processing(GO:2000234) |
| 0.0 | 0.2 | GO:0070124 | mitochondrial translational initiation(GO:0070124) |
| 0.0 | 0.5 | GO:0002759 | regulation of antimicrobial humoral response(GO:0002759) |
| 0.0 | 0.5 | GO:0097338 | response to clozapine(GO:0097338) |
| 0.0 | 0.2 | GO:0006726 | eye pigment biosynthetic process(GO:0006726) eye pigment metabolic process(GO:0042441) pigment metabolic process involved in developmental pigmentation(GO:0043324) pigment metabolic process involved in pigmentation(GO:0043474) |
| 0.0 | 0.2 | GO:0032207 | regulation of telomere maintenance via recombination(GO:0032207) negative regulation of telomere maintenance via recombination(GO:0032208) negative regulation of single strand break repair(GO:1903517) negative regulation of beta-galactosidase activity(GO:1903770) telomere single strand break repair(GO:1903823) negative regulation of telomere single strand break repair(GO:1903824) |
| 0.0 | 0.2 | GO:0018032 | protein amidation(GO:0018032) |
| 0.0 | 0.2 | GO:0044314 | protein K27-linked ubiquitination(GO:0044314) |
| 0.0 | 0.4 | GO:0000821 | regulation of arginine metabolic process(GO:0000821) basic amino acid transmembrane transport(GO:1990822) |
| 0.0 | 0.3 | GO:0001550 | ovarian cumulus expansion(GO:0001550) fused antrum stage(GO:0048165) |
| 0.0 | 0.2 | GO:2000301 | negative regulation of synaptic vesicle exocytosis(GO:2000301) |
| 0.0 | 0.2 | GO:0002005 | angiotensin catabolic process in blood(GO:0002005) |
| 0.0 | 0.2 | GO:0006127 | glycerophosphate shuttle(GO:0006127) |
| 0.0 | 0.3 | GO:0071105 | response to interleukin-9(GO:0071104) response to interleukin-11(GO:0071105) |
| 0.0 | 0.5 | GO:0090646 | mitochondrial tRNA processing(GO:0090646) |
| 0.0 | 0.8 | GO:0034975 | protein folding in endoplasmic reticulum(GO:0034975) |
| 0.0 | 0.1 | GO:0036071 | N-glycan fucosylation(GO:0036071) |
| 0.0 | 0.2 | GO:0051708 | intracellular transport of viral protein in host cell(GO:0019060) symbiont intracellular protein transport in host(GO:0030581) intracellular protein transport in other organism involved in symbiotic interaction(GO:0051708) |
| 0.0 | 0.5 | GO:0048251 | elastic fiber assembly(GO:0048251) |
| 0.0 | 0.3 | GO:0000395 | mRNA 5'-splice site recognition(GO:0000395) |
| 0.0 | 0.3 | GO:0042997 | negative regulation of Golgi to plasma membrane protein transport(GO:0042997) |
| 0.0 | 0.6 | GO:0010826 | negative regulation of centrosome duplication(GO:0010826) |
| 0.0 | 0.8 | GO:0070986 | left/right axis specification(GO:0070986) |
| 0.0 | 0.2 | GO:0090131 | mesenchyme migration(GO:0090131) |
| 0.0 | 0.7 | GO:0090179 | planar cell polarity pathway involved in neural tube closure(GO:0090179) |
| 0.0 | 0.2 | GO:0090611 | ubiquitin-independent protein catabolic process via the multivesicular body sorting pathway(GO:0090611) |
| 0.0 | 0.2 | GO:0051012 | microtubule sliding(GO:0051012) |
| 0.0 | 0.4 | GO:0033623 | regulation of integrin activation(GO:0033623) |
| 0.0 | 0.6 | GO:0006388 | tRNA splicing, via endonucleolytic cleavage and ligation(GO:0006388) |
| 0.0 | 0.4 | GO:0034058 | endosomal vesicle fusion(GO:0034058) |
| 0.0 | 0.2 | GO:0006741 | NADP biosynthetic process(GO:0006741) |
| 0.0 | 0.2 | GO:0060372 | regulation of atrial cardiac muscle cell membrane repolarization(GO:0060372) |
| 0.0 | 0.6 | GO:0006825 | copper ion transport(GO:0006825) |
| 0.0 | 0.2 | GO:0032468 | Golgi calcium ion homeostasis(GO:0032468) |
| 0.0 | 0.5 | GO:0046520 | sphingoid biosynthetic process(GO:0046520) |
| 0.0 | 0.6 | GO:0051988 | regulation of attachment of spindle microtubules to kinetochore(GO:0051988) |
| 0.0 | 0.2 | GO:0030263 | apoptotic chromosome condensation(GO:0030263) |
| 0.0 | 0.1 | GO:0010157 | response to chlorate(GO:0010157) |
| 0.0 | 0.1 | GO:0000117 | regulation of transcription involved in G2/M transition of mitotic cell cycle(GO:0000117) |
| 0.0 | 0.2 | GO:0021840 | directional guidance of interneurons involved in migration from the subpallium to the cortex(GO:0021840) chemorepulsion involved in interneuron migration from the subpallium to the cortex(GO:0021842) ERBB3 signaling pathway(GO:0038129) |
| 0.0 | 0.4 | GO:0015939 | pantothenate metabolic process(GO:0015939) |
| 0.0 | 0.3 | GO:0034201 | response to oleic acid(GO:0034201) |
| 0.0 | 0.3 | GO:0030916 | otic vesicle formation(GO:0030916) |
| 0.0 | 0.1 | GO:0060529 | ectoderm and mesoderm interaction(GO:0007499) squamous basal epithelial stem cell differentiation involved in prostate gland acinus development(GO:0060529) |
| 0.0 | 0.1 | GO:1990637 | response to prolactin(GO:1990637) |
| 0.0 | 0.1 | GO:0070340 | detection of triacyl bacterial lipopeptide(GO:0042495) detection of bacterial lipopeptide(GO:0070340) |
| 0.0 | 0.1 | GO:0002175 | protein localization to paranode region of axon(GO:0002175) |
| 0.0 | 0.2 | GO:0035726 | common myeloid progenitor cell proliferation(GO:0035726) |
| 0.0 | 0.0 | GO:0002541 | activation of plasma proteins involved in acute inflammatory response(GO:0002541) |
| 0.0 | 0.5 | GO:0006123 | mitochondrial electron transport, cytochrome c to oxygen(GO:0006123) |
| 0.0 | 0.4 | GO:0005513 | detection of calcium ion(GO:0005513) |
| 0.0 | 0.1 | GO:0006203 | dGTP catabolic process(GO:0006203) |
| 0.0 | 0.4 | GO:0034498 | early endosome to Golgi transport(GO:0034498) |
| 0.0 | 0.4 | GO:0002523 | leukocyte migration involved in inflammatory response(GO:0002523) |
| 0.0 | 0.3 | GO:0015781 | pyrimidine nucleotide-sugar transport(GO:0015781) |
| 0.0 | 0.2 | GO:0000056 | ribosomal small subunit export from nucleus(GO:0000056) |
| 0.0 | 0.1 | GO:0006196 | AMP catabolic process(GO:0006196) |
| 0.0 | 0.5 | GO:0006068 | ethanol catabolic process(GO:0006068) |
| 0.0 | 0.1 | GO:1904977 | lymphatic endothelial cell migration(GO:1904977) |
| 0.0 | 0.3 | GO:0090160 | Golgi to lysosome transport(GO:0090160) |
| 0.0 | 1.4 | GO:0006120 | mitochondrial electron transport, NADH to ubiquinone(GO:0006120) |
| 0.0 | 0.3 | GO:0019800 | peptide cross-linking via chondroitin 4-sulfate glycosaminoglycan(GO:0019800) |
| 0.0 | 0.5 | GO:0009235 | cobalamin metabolic process(GO:0009235) |
| 0.0 | 0.1 | GO:2000048 | negative regulation of cell-cell adhesion mediated by cadherin(GO:2000048) |
| 0.0 | 0.1 | GO:0042126 | nitrate metabolic process(GO:0042126) |
| 0.0 | 0.5 | GO:1904355 | positive regulation of telomere capping(GO:1904355) |
| 0.0 | 0.2 | GO:0018401 | peptidyl-proline hydroxylation to 4-hydroxy-L-proline(GO:0018401) |
| 0.0 | 0.0 | GO:0070563 | negative regulation of vitamin D receptor signaling pathway(GO:0070563) |
| 0.0 | 0.2 | GO:1902365 | regulation of spindle elongation(GO:0032887) regulation of mitotic spindle elongation(GO:0032888) anastral spindle assembly(GO:0055048) protein localization to spindle pole body(GO:0071988) regulation of protein localization to spindle pole body(GO:1902363) positive regulation of protein localization to spindle pole body(GO:1902365) positive regulation of mitotic spindle elongation(GO:1902846) |
| 0.0 | 0.1 | GO:1990168 | protein K33-linked deubiquitination(GO:1990168) |
| 0.0 | 0.0 | GO:0035526 | retrograde transport, plasma membrane to Golgi(GO:0035526) |
| 0.0 | 0.5 | GO:0072662 | protein targeting to peroxisome(GO:0006625) protein localization to peroxisome(GO:0072662) establishment of protein localization to peroxisome(GO:0072663) |
| 0.0 | 0.2 | GO:2001214 | positive regulation of vasculogenesis(GO:2001214) |
| 0.0 | 0.0 | GO:1903217 | regulation of protein processing involved in protein targeting to mitochondrion(GO:1903216) negative regulation of protein processing involved in protein targeting to mitochondrion(GO:1903217) |
| 0.0 | 0.2 | GO:0070973 | protein localization to endoplasmic reticulum exit site(GO:0070973) |
| 0.0 | 0.4 | GO:0006895 | Golgi to endosome transport(GO:0006895) |
| 0.0 | 0.2 | GO:1901223 | negative regulation of NIK/NF-kappaB signaling(GO:1901223) |
| 0.0 | 0.3 | GO:0036158 | outer dynein arm assembly(GO:0036158) |
| 0.0 | 0.1 | GO:0048698 | negative regulation of collateral sprouting in absence of injury(GO:0048698) |
| 0.0 | 0.1 | GO:0018343 | protein farnesylation(GO:0018343) |
| 0.0 | 2.2 | GO:0006334 | nucleosome assembly(GO:0006334) |
| 0.0 | 0.1 | GO:0097428 | protein maturation by iron-sulfur cluster transfer(GO:0097428) |
| 0.0 | 0.1 | GO:1903764 | regulation of potassium ion export across plasma membrane(GO:1903764) |
| 0.0 | 0.0 | GO:0006533 | aspartate catabolic process(GO:0006533) |
| 0.0 | 0.1 | GO:0046085 | adenosine metabolic process(GO:0046085) |
| 0.0 | 0.2 | GO:0006610 | ribosomal protein import into nucleus(GO:0006610) |
| 0.0 | 0.2 | GO:0042136 | neurotransmitter biosynthetic process(GO:0042136) |
| 0.0 | 0.2 | GO:0043248 | proteasome assembly(GO:0043248) |
| 0.0 | 0.1 | GO:0042271 | susceptibility to natural killer cell mediated cytotoxicity(GO:0042271) |
| 0.0 | 0.1 | GO:1903435 | positive regulation of constitutive secretory pathway(GO:1903435) |
| 0.0 | 0.0 | GO:0051866 | general adaptation syndrome(GO:0051866) |
| 0.0 | 0.4 | GO:0000729 | DNA double-strand break processing(GO:0000729) |
| 0.0 | 0.0 | GO:0044029 | DNA hypomethylation(GO:0044028) hypomethylation of CpG island(GO:0044029) |
| 0.0 | 0.1 | GO:0060160 | negative regulation of dopamine receptor signaling pathway(GO:0060160) |
| 0.0 | 0.2 | GO:0007064 | mitotic sister chromatid cohesion(GO:0007064) |
Gene overrepresentation in cellular_component category:
| Log-likelihood per target | Total log-likelihood | Term | Description |
|---|---|---|---|
| 0.1 | 1.6 | GO:0000137 | Golgi cis cisterna(GO:0000137) |
| 0.1 | 0.4 | GO:0005579 | membrane attack complex(GO:0005579) |
| 0.1 | 0.6 | GO:0097149 | centralspindlin complex(GO:0097149) |
| 0.1 | 0.3 | GO:0043614 | multi-eIF complex(GO:0043614) translation preinitiation complex(GO:0070993) astrocyte end-foot(GO:0097450) glial limiting end-foot(GO:0097451) |
| 0.1 | 1.3 | GO:0005577 | fibrinogen complex(GO:0005577) |
| 0.1 | 0.2 | GO:0009330 | DNA topoisomerase complex (ATP-hydrolyzing)(GO:0009330) |
| 0.1 | 0.2 | GO:1990716 | axonemal central apparatus(GO:1990716) |
| 0.1 | 1.0 | GO:1990454 | L-type voltage-gated calcium channel complex(GO:1990454) |
| 0.1 | 0.8 | GO:0098643 | fibrillar collagen trimer(GO:0005583) banded collagen fibril(GO:0098643) |
| 0.1 | 0.5 | GO:0030678 | mitochondrial ribonuclease P complex(GO:0030678) |
| 0.1 | 0.6 | GO:0072669 | tRNA-splicing ligase complex(GO:0072669) |
| 0.1 | 0.3 | GO:0070826 | paraferritin complex(GO:0070826) |
| 0.1 | 0.2 | GO:0036502 | Derlin-1-VIMP complex(GO:0036502) |
| 0.1 | 1.1 | GO:0000164 | protein phosphatase type 1 complex(GO:0000164) |
| 0.0 | 0.7 | GO:0070187 | telosome(GO:0070187) |
| 0.0 | 0.4 | GO:0030430 | host cell cytoplasm(GO:0030430) host cell cytoplasm part(GO:0033655) |
| 0.0 | 0.5 | GO:0097197 | tetraspanin-enriched microdomain(GO:0097197) |
| 0.0 | 0.5 | GO:0017059 | serine C-palmitoyltransferase complex(GO:0017059) endoplasmic reticulum palmitoyltransferase complex(GO:0031211) |
| 0.0 | 0.4 | GO:0033263 | CORVET complex(GO:0033263) |
| 0.0 | 0.5 | GO:0045275 | mitochondrial respiratory chain complex III(GO:0005750) respiratory chain complex III(GO:0045275) |
| 0.0 | 0.8 | GO:0036038 | MKS complex(GO:0036038) |
| 0.0 | 0.3 | GO:0005827 | polar microtubule(GO:0005827) |
| 0.0 | 0.2 | GO:0031466 | Cul5-RING ubiquitin ligase complex(GO:0031466) |
| 0.0 | 0.2 | GO:0036157 | outer dynein arm(GO:0036157) |
| 0.0 | 0.2 | GO:1990726 | Lsm1-7-Pat1 complex(GO:1990726) |
| 0.0 | 0.2 | GO:0009331 | glycerol-3-phosphate dehydrogenase complex(GO:0009331) |
| 0.0 | 0.4 | GO:0072546 | ER membrane protein complex(GO:0072546) |
| 0.0 | 0.2 | GO:0070971 | endoplasmic reticulum exit site(GO:0070971) |
| 0.0 | 0.1 | GO:0035354 | Toll-like receptor 1-Toll-like receptor 2 protein complex(GO:0035354) |
| 0.0 | 0.5 | GO:0043205 | microfibril(GO:0001527) fibril(GO:0043205) |
| 0.0 | 0.1 | GO:0097454 | Schwann cell microvillus(GO:0097454) |
| 0.0 | 0.1 | GO:0005965 | protein farnesyltransferase complex(GO:0005965) |
| 0.0 | 0.3 | GO:0030864 | cortical actin cytoskeleton(GO:0030864) |
| 0.0 | 0.4 | GO:0036513 | Derlin-1 retrotranslocation complex(GO:0036513) |
| 0.0 | 0.2 | GO:0097452 | GAIT complex(GO:0097452) |
| 0.0 | 0.3 | GO:0030126 | COPI vesicle coat(GO:0030126) |
| 0.0 | 0.3 | GO:1990712 | HFE-transferrin receptor complex(GO:1990712) |
| 0.0 | 1.4 | GO:0005747 | mitochondrial respiratory chain complex I(GO:0005747) NADH dehydrogenase complex(GO:0030964) respiratory chain complex I(GO:0045271) |
| 0.0 | 0.4 | GO:0000800 | lateral element(GO:0000800) |
| 0.0 | 0.2 | GO:0055028 | cortical microtubule(GO:0055028) |
| 0.0 | 0.3 | GO:0097386 | glial cell projection(GO:0097386) |
| 0.0 | 0.5 | GO:0030992 | intraciliary transport particle B(GO:0030992) |
| 0.0 | 0.0 | GO:0031430 | M band(GO:0031430) |
| 0.0 | 0.4 | GO:0031045 | dense core granule(GO:0031045) |
| 0.0 | 0.9 | GO:0031907 | peroxisomal matrix(GO:0005782) microbody lumen(GO:0031907) |
| 0.0 | 0.1 | GO:0034680 | integrin alpha10-beta1 complex(GO:0034680) |
| 0.0 | 2.4 | GO:0030176 | integral component of endoplasmic reticulum membrane(GO:0030176) |
| 0.0 | 0.1 | GO:0044294 | dendrite terminus(GO:0044292) dendritic growth cone(GO:0044294) |
| 0.0 | 0.1 | GO:0042641 | actomyosin(GO:0042641) |
| 0.0 | 0.3 | GO:0033162 | melanosome membrane(GO:0033162) chitosome(GO:0045009) |
| 0.0 | 0.1 | GO:0008282 | ATP-sensitive potassium channel complex(GO:0008282) |
| 0.0 | 0.2 | GO:0034663 | endoplasmic reticulum chaperone complex(GO:0034663) |
Gene overrepresentation in molecular_function category:
| Log-likelihood per target | Total log-likelihood | Term | Description |
|---|---|---|---|
| 0.3 | 0.8 | GO:0086057 | voltage-gated calcium channel activity involved in bundle of His cell action potential(GO:0086057) |
| 0.2 | 1.0 | GO:0071074 | eukaryotic initiation factor eIF2 binding(GO:0071074) |
| 0.2 | 1.2 | GO:0004694 | eukaryotic translation initiation factor 2alpha kinase activity(GO:0004694) |
| 0.2 | 2.4 | GO:0102338 | fatty acid elongase activity(GO:0009922) 3-oxo-arachidoyl-CoA synthase activity(GO:0102336) 3-oxo-cerotoyl-CoA synthase activity(GO:0102337) 3-oxo-lignoceronyl-CoA synthase activity(GO:0102338) |
| 0.2 | 0.6 | GO:0031626 | beta-endorphin binding(GO:0031626) |
| 0.2 | 0.5 | GO:0008859 | exoribonuclease II activity(GO:0008859) |
| 0.1 | 0.4 | GO:0004483 | mRNA (nucleoside-2'-O-)-methyltransferase activity(GO:0004483) |
| 0.1 | 0.5 | GO:0030337 | DNA polymerase processivity factor activity(GO:0030337) |
| 0.1 | 0.5 | GO:0016211 | glutamate-ammonia ligase activity(GO:0004356) ammonia ligase activity(GO:0016211) acid-ammonia (or amide) ligase activity(GO:0016880) |
| 0.1 | 0.5 | GO:0016263 | glycoprotein-N-acetylgalactosamine 3-beta-galactosyltransferase activity(GO:0016263) |
| 0.1 | 0.6 | GO:0000386 | second spliceosomal transesterification activity(GO:0000386) |
| 0.1 | 0.5 | GO:0008073 | ornithine decarboxylase inhibitor activity(GO:0008073) |
| 0.1 | 0.6 | GO:0016823 | hydrolase activity, acting on acid carbon-carbon bonds(GO:0016822) hydrolase activity, acting on acid carbon-carbon bonds, in ketonic substances(GO:0016823) |
| 0.1 | 0.3 | GO:0004947 | bradykinin receptor activity(GO:0004947) |
| 0.1 | 0.6 | GO:0010521 | telomerase inhibitor activity(GO:0010521) |
| 0.1 | 0.5 | GO:0030291 | cAMP-dependent protein kinase inhibitor activity(GO:0004862) protein serine/threonine kinase inhibitor activity(GO:0030291) |
| 0.1 | 0.2 | GO:0061505 | DNA topoisomerase type II (ATP-hydrolyzing) activity(GO:0003918) DNA topoisomerase II activity(GO:0061505) |
| 0.1 | 0.3 | GO:0004967 | glucagon receptor activity(GO:0004967) |
| 0.1 | 0.6 | GO:0016724 | ferroxidase activity(GO:0004322) oxidoreductase activity, oxidizing metal ions, oxygen as acceptor(GO:0016724) |
| 0.1 | 0.4 | GO:0004329 | formate-tetrahydrofolate ligase activity(GO:0004329) |
| 0.1 | 0.3 | GO:0031208 | POZ domain binding(GO:0031208) |
| 0.1 | 0.3 | GO:0004556 | alpha-amylase activity(GO:0004556) |
| 0.1 | 0.4 | GO:0017159 | pantetheine hydrolase activity(GO:0017159) |
| 0.1 | 0.5 | GO:0004758 | serine C-palmitoyltransferase activity(GO:0004758) C-palmitoyltransferase activity(GO:0016454) |
| 0.1 | 0.3 | GO:0015616 | DNA translocase activity(GO:0015616) |
| 0.1 | 0.4 | GO:0033989 | 3alpha,7alpha,12alpha-trihydroxy-5beta-cholest-24-enoyl-CoA hydratase activity(GO:0033989) 17-beta-hydroxysteroid dehydrogenase (NAD+) activity(GO:0044594) |
| 0.1 | 0.2 | GO:0072545 | tyrosine binding(GO:0072545) |
| 0.1 | 0.4 | GO:0001849 | complement component C1q binding(GO:0001849) |
| 0.1 | 0.2 | GO:0030350 | iron-responsive element binding(GO:0030350) |
| 0.1 | 0.3 | GO:0015087 | cadmium ion transmembrane transporter activity(GO:0015086) cobalt ion transmembrane transporter activity(GO:0015087) lead ion transmembrane transporter activity(GO:0015094) ferrous iron uptake transmembrane transporter activity(GO:0015639) |
| 0.1 | 0.4 | GO:0002114 | interleukin-33 receptor activity(GO:0002114) |
| 0.1 | 0.2 | GO:0004827 | glutamate-tRNA ligase activity(GO:0004818) proline-tRNA ligase activity(GO:0004827) |
| 0.0 | 0.1 | GO:0050146 | nucleoside phosphotransferase activity(GO:0050146) |
| 0.0 | 0.2 | GO:0005277 | acetylcholine transmembrane transporter activity(GO:0005277) secondary active organic cation transmembrane transporter activity(GO:0008513) acetate ester transmembrane transporter activity(GO:1901375) |
| 0.0 | 0.4 | GO:0043546 | molybdopterin cofactor binding(GO:0043546) |
| 0.0 | 0.1 | GO:0070260 | tyrosyl-RNA phosphodiesterase activity(GO:0036317) 5'-tyrosyl-DNA phosphodiesterase activity(GO:0070260) |
| 0.0 | 0.2 | GO:0052591 | sn-glycerol-3-phosphate:ubiquinone oxidoreductase activity(GO:0052590) sn-glycerol-3-phosphate:ubiquinone-8 oxidoreductase activity(GO:0052591) |
| 0.0 | 1.2 | GO:0031005 | filamin binding(GO:0031005) |
| 0.0 | 0.3 | GO:0042979 | ornithine decarboxylase regulator activity(GO:0042979) |
| 0.0 | 0.2 | GO:0004441 | inositol-1,4-bisphosphate 1-phosphatase activity(GO:0004441) inositol-1,3,4-trisphosphate 1-phosphatase activity(GO:0052829) |
| 0.0 | 0.2 | GO:0004598 | peptidylglycine monooxygenase activity(GO:0004504) peptidylamidoglycolate lyase activity(GO:0004598) |
| 0.0 | 0.2 | GO:0016429 | tRNA (adenine) methyltransferase activity(GO:0016426) tRNA (adenine-N1-)-methyltransferase activity(GO:0016429) |
| 0.0 | 1.1 | GO:0005104 | fibroblast growth factor receptor binding(GO:0005104) |
| 0.0 | 0.3 | GO:0017040 | ceramidase activity(GO:0017040) |
| 0.0 | 0.6 | GO:0016018 | cyclosporin A binding(GO:0016018) |
| 0.0 | 0.7 | GO:0086008 | voltage-gated potassium channel activity involved in cardiac muscle cell action potential repolarization(GO:0086008) |
| 0.0 | 0.1 | GO:0046921 | glycoprotein 6-alpha-L-fucosyltransferase activity(GO:0008424) alpha-(1->6)-fucosyltransferase activity(GO:0046921) |
| 0.0 | 0.1 | GO:0035539 | 8-oxo-7,8-dihydroguanosine triphosphate pyrophosphatase activity(GO:0008413) 8-oxo-7,8-dihydrodeoxyguanosine triphosphate pyrophosphatase activity(GO:0035539) |
| 0.0 | 0.5 | GO:0001206 | transcriptional repressor activity, RNA polymerase II distal enhancer sequence-specific binding(GO:0001206) |
| 0.0 | 0.9 | GO:0051537 | 2 iron, 2 sulfur cluster binding(GO:0051537) |
| 0.0 | 0.2 | GO:0008597 | calcium-dependent protein serine/threonine phosphatase regulator activity(GO:0008597) |
| 0.0 | 0.9 | GO:0016505 | peptidase activator activity involved in apoptotic process(GO:0016505) |
| 0.0 | 1.6 | GO:0050136 | NADH dehydrogenase (ubiquinone) activity(GO:0008137) NADH dehydrogenase (quinone) activity(GO:0050136) |
| 0.0 | 0.3 | GO:0005025 | transforming growth factor beta receptor activity, type I(GO:0005025) |
| 0.0 | 0.1 | GO:0008457 | beta-galactosyl-N-acetylglucosaminylgalactosylglucosyl-ceramide beta-1,3-acetylglucosaminyltransferase activity(GO:0008457) lactosylceramide 1,3-N-acetyl-beta-D-glucosaminyltransferase activity(GO:0047256) |
| 0.0 | 0.6 | GO:0102391 | decanoate--CoA ligase activity(GO:0102391) |
| 0.0 | 0.3 | GO:0008474 | palmitoyl-(protein) hydrolase activity(GO:0008474) palmitoyl hydrolase activity(GO:0098599) |
| 0.0 | 0.2 | GO:0097199 | cysteine-type endopeptidase activity involved in apoptotic signaling pathway(GO:0097199) |
| 0.0 | 0.3 | GO:0097100 | supercoiled DNA binding(GO:0097100) |
| 0.0 | 0.3 | GO:0015165 | pyrimidine nucleotide-sugar transmembrane transporter activity(GO:0015165) |
| 0.0 | 0.4 | GO:0015280 | ligand-gated sodium channel activity(GO:0015280) |
| 0.0 | 3.0 | GO:0000979 | RNA polymerase II core promoter sequence-specific DNA binding(GO:0000979) |
| 0.0 | 0.5 | GO:1904264 | ubiquitin protein ligase activity involved in ERAD pathway(GO:1904264) |
| 0.0 | 0.2 | GO:0086007 | voltage-gated calcium channel activity involved in cardiac muscle cell action potential(GO:0086007) |
| 0.0 | 0.1 | GO:0004660 | protein farnesyltransferase activity(GO:0004660) |
| 0.0 | 0.2 | GO:0003835 | beta-galactoside alpha-2,6-sialyltransferase activity(GO:0003835) |
| 0.0 | 0.4 | GO:0005537 | mannose binding(GO:0005537) |
| 0.0 | 0.5 | GO:0004691 | cAMP-dependent protein kinase activity(GO:0004691) |
| 0.0 | 0.4 | GO:0015174 | basic amino acid transmembrane transporter activity(GO:0015174) |
| 0.0 | 0.2 | GO:0045236 | CXCR chemokine receptor binding(GO:0045236) |
| 0.0 | 0.5 | GO:0004062 | aryl sulfotransferase activity(GO:0004062) |
| 0.0 | 0.3 | GO:0050693 | LBD domain binding(GO:0050693) |
| 0.0 | 0.6 | GO:0000993 | RNA polymerase II core binding(GO:0000993) |
| 0.0 | 0.2 | GO:0005176 | ErbB-2 class receptor binding(GO:0005176) |
| 0.0 | 0.1 | GO:0005119 | smoothened binding(GO:0005119) |
| 0.0 | 0.3 | GO:0004526 | ribonuclease P activity(GO:0004526) |
| 0.0 | 0.1 | GO:0071987 | WD40-repeat domain binding(GO:0071987) |
| 0.0 | 0.5 | GO:0016676 | cytochrome-c oxidase activity(GO:0004129) heme-copper terminal oxidase activity(GO:0015002) oxidoreductase activity, acting on a heme group of donors, oxygen as acceptor(GO:0016676) |
| 0.0 | 0.1 | GO:0035663 | Toll-like receptor 2 binding(GO:0035663) |
| 0.0 | 0.4 | GO:0008009 | chemokine activity(GO:0008009) |
| 0.0 | 0.1 | GO:0008195 | phosphatidate phosphatase activity(GO:0008195) |
| 0.0 | 0.1 | GO:0003876 | AMP deaminase activity(GO:0003876) adenosine-phosphate deaminase activity(GO:0047623) |
| 0.0 | 0.1 | GO:0050115 | myosin-light-chain-phosphatase activity(GO:0050115) |
| 0.0 | 0.6 | GO:0005385 | zinc ion transmembrane transporter activity(GO:0005385) |
| 0.0 | 0.2 | GO:0008140 | cAMP response element binding protein binding(GO:0008140) |
| 0.0 | 0.2 | GO:0003964 | telomerase activity(GO:0003720) RNA-directed DNA polymerase activity(GO:0003964) |
| 0.0 | 0.0 | GO:0008184 | nucleobase binding(GO:0002054) purine nucleobase binding(GO:0002060) glycogen phosphorylase activity(GO:0008184) |
| 0.0 | 0.2 | GO:0016671 | oxidoreductase activity, acting on a sulfur group of donors, disulfide as acceptor(GO:0016671) |
| 0.0 | 0.2 | GO:0043024 | ribosomal small subunit binding(GO:0043024) |
| 0.0 | 0.0 | GO:0047708 | biotinidase activity(GO:0047708) |
| 0.0 | 0.2 | GO:0008191 | metalloendopeptidase inhibitor activity(GO:0008191) |
| 0.0 | 0.1 | GO:0008889 | glycerophosphodiester phosphodiesterase activity(GO:0008889) |
| 0.0 | 0.2 | GO:0031545 | peptidyl-proline 4-dioxygenase activity(GO:0031545) |
| 0.0 | 0.7 | GO:0004177 | aminopeptidase activity(GO:0004177) |
| 0.0 | 0.1 | GO:0048020 | CCR chemokine receptor binding(GO:0048020) |
Gene overrepresentation in C2:CP category:
| Log-likelihood per target | Total log-likelihood | Term | Description |
|---|---|---|---|
| 0.0 | 4.3 | PID SMAD2 3NUCLEAR PATHWAY | Regulation of nuclear SMAD2/3 signaling |
| 0.0 | 1.1 | PID VEGFR1 PATHWAY | VEGFR1 specific signals |
| 0.0 | 1.3 | PID SYNDECAN 4 PATHWAY | Syndecan-4-mediated signaling events |
| 0.0 | 0.4 | PID TCR RAS PATHWAY | Ras signaling in the CD4+ TCR pathway |
| 0.0 | 0.8 | PID EPHRINB REV PATHWAY | Ephrin B reverse signaling |
| 0.0 | 1.2 | PID TCPTP PATHWAY | Signaling events mediated by TCPTP |
| 0.0 | 0.2 | PID DELTA NP63 PATHWAY | Validated transcriptional targets of deltaNp63 isoforms |
| 0.0 | 1.1 | PID NOTCH PATHWAY | Notch signaling pathway |
| 0.0 | 0.5 | PID IL3 PATHWAY | IL3-mediated signaling events |
| 0.0 | 0.3 | PID WNT CANONICAL PATHWAY | Canonical Wnt signaling pathway |
| 0.0 | 0.4 | ST MYOCYTE AD PATHWAY | Myocyte Adrenergic Pathway is a specific case of the generalized Adrenergic Pathway. |
Gene overrepresentation in C2:CP:REACTOME category:
| Log-likelihood per target | Total log-likelihood | Term | Description |
|---|---|---|---|
| 0.3 | 4.0 | REACTOME TRAF6 MEDIATED IRF7 ACTIVATION IN TLR7 8 OR 9 SIGNALING | Genes involved in TRAF6 mediated IRF7 activation in TLR7/8 or 9 signaling |
| 0.1 | 2.7 | REACTOME SYNTHESIS OF VERY LONG CHAIN FATTY ACYL COAS | Genes involved in Synthesis of very long-chain fatty acyl-CoAs |
| 0.1 | 5.4 | REACTOME INTERFERON ALPHA BETA SIGNALING | Genes involved in Interferon alpha/beta signaling |
| 0.1 | 1.1 | REACTOME ACTIVATED POINT MUTANTS OF FGFR2 | Genes involved in Activated point mutants of FGFR2 |
| 0.0 | 2.2 | REACTOME FORMATION OF FIBRIN CLOT CLOTTING CASCADE | Genes involved in Formation of Fibrin Clot (Clotting Cascade) |
| 0.0 | 0.5 | REACTOME RECEPTOR LIGAND BINDING INITIATES THE SECOND PROTEOLYTIC CLEAVAGE OF NOTCH RECEPTOR | Genes involved in Receptor-ligand binding initiates the second proteolytic cleavage of Notch receptor |
| 0.0 | 1.0 | REACTOME ACTIVATION OF RAC | Genes involved in Activation of Rac |
| 0.0 | 0.3 | REACTOME APOBEC3G MEDIATED RESISTANCE TO HIV1 INFECTION | Genes involved in APOBEC3G mediated resistance to HIV-1 infection |
| 0.0 | 0.7 | REACTOME SYNTHESIS OF BILE ACIDS AND BILE SALTS VIA 7ALPHA HYDROXYCHOLESTEROL | Genes involved in Synthesis of bile acids and bile salts via 7alpha-hydroxycholesterol |
| 0.0 | 1.1 | REACTOME METAL ION SLC TRANSPORTERS | Genes involved in Metal ion SLC transporters |
| 0.0 | 0.3 | REACTOME COPI MEDIATED TRANSPORT | Genes involved in COPI Mediated Transport |
| 0.0 | 0.3 | REACTOME DIGESTION OF DIETARY CARBOHYDRATE | Genes involved in Digestion of dietary carbohydrate |
| 0.0 | 0.5 | REACTOME TRYPTOPHAN CATABOLISM | Genes involved in Tryptophan catabolism |
| 0.0 | 0.4 | REACTOME SIGNALLING TO P38 VIA RIT AND RIN | Genes involved in Signalling to p38 via RIT and RIN |
| 0.0 | 0.3 | REACTOME ABACAVIR TRANSPORT AND METABOLISM | Genes involved in Abacavir transport and metabolism |
| 0.0 | 0.9 | REACTOME PACKAGING OF TELOMERE ENDS | Genes involved in Packaging Of Telomere Ends |
| 0.0 | 0.5 | REACTOME AMINO ACID SYNTHESIS AND INTERCONVERSION TRANSAMINATION | Genes involved in Amino acid synthesis and interconversion (transamination) |
| 0.0 | 0.5 | REACTOME HORMONE SENSITIVE LIPASE HSL MEDIATED TRIACYLGLYCEROL HYDROLYSIS | Genes involved in Hormone-sensitive lipase (HSL)-mediated triacylglycerol hydrolysis |
| 0.0 | 0.4 | REACTOME CYTOSOLIC SULFONATION OF SMALL MOLECULES | Genes involved in Cytosolic sulfonation of small molecules |
| 0.0 | 0.6 | REACTOME INHIBITION OF VOLTAGE GATED CA2 CHANNELS VIA GBETA GAMMA SUBUNITS | Genes involved in Inhibition of voltage gated Ca2+ channels via Gbeta/gamma subunits |
| 0.0 | 0.2 | REACTOME ANTIGEN PRESENTATION FOLDING ASSEMBLY AND PEPTIDE LOADING OF CLASS I MHC | Genes involved in Antigen Presentation: Folding, assembly and peptide loading of class I MHC |
| 0.0 | 1.4 | REACTOME ANTIVIRAL MECHANISM BY IFN STIMULATED GENES | Genes involved in Antiviral mechanism by IFN-stimulated genes |
| 0.0 | 0.3 | REACTOME PERK REGULATED GENE EXPRESSION | Genes involved in PERK regulated gene expression |
| 0.0 | 0.2 | REACTOME DESTABILIZATION OF MRNA BY TRISTETRAPROLIN TTP | Genes involved in Destabilization of mRNA by Tristetraprolin (TTP) |
| 0.0 | 0.6 | REACTOME ADHERENS JUNCTIONS INTERACTIONS | Genes involved in Adherens junctions interactions |
| 0.0 | 0.3 | REACTOME GLUCAGON TYPE LIGAND RECEPTORS | Genes involved in Glucagon-type ligand receptors |