Project
A549 cells infected with SARS-CoV-2 Analysis Results (GEO series: GSE147507)
Navigation
Downloads
Results for DUXA
Z-value: 1.17
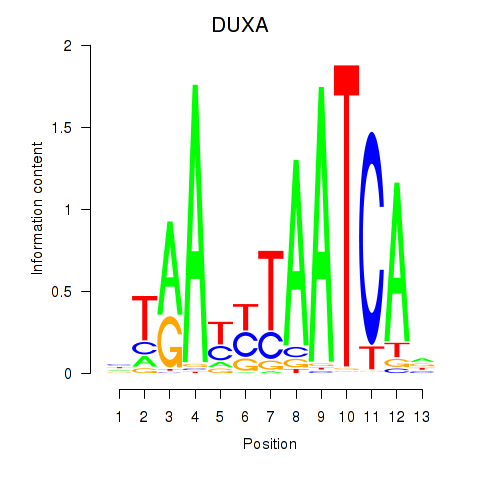
Motif logo
Transcription factors associated with DUXA
| Gene Symbol | Gene ID | Gene Info |
|---|---|---|
|
DUXA
|
ENSG00000258873.2 | double homeobox A |
Activity-expression correlation:
| Gene | Promoter | Pearson corr. coef. | P-value | Plot |
|---|---|---|---|---|
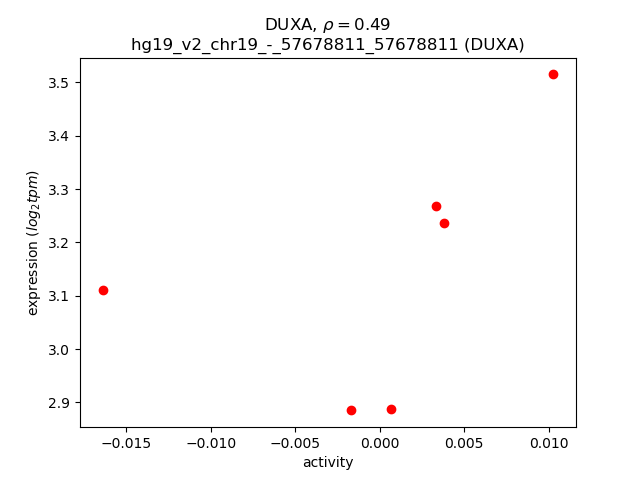
| DUXA | hg19_v2_chr19_-_57678811_57678811 | 0.49 | 3.2e-01 | Click! |
Activity profile of DUXA motif
Sorted Z-values of DUXA motif
| Promoter | Log-likelihood | Transcript | Gene | Gene Info |
|---|---|---|---|---|
| chr1_-_27998689 | 2.08 |
ENST00000339145.4
ENST00000362020.4 ENST00000361157.6 |
IFI6
|
interferon, alpha-inducible protein 6 |
| chr1_+_95616933 | 2.01 |
ENST00000604203.1
|
RP11-57H12.6
|
TMEM56-RWDD3 readthrough |
| chr12_-_91546926 | 1.89 |
ENST00000550758.1
|
DCN
|
decorin |
| chr10_-_112255945 | 1.54 |
ENST00000609514.1
ENST00000607952.1 |
RP11-525A16.4
|
RP11-525A16.4 |
| chr2_+_228678550 | 1.52 |
ENST00000409189.3
ENST00000358813.4 |
CCL20
|
chemokine (C-C motif) ligand 20 |
| chr17_+_61151306 | 0.98 |
ENST00000580068.1
ENST00000580466.1 |
TANC2
|
tetratricopeptide repeat, ankyrin repeat and coiled-coil containing 2 |
| chr15_-_34447023 | 0.94 |
ENST00000560310.1
|
KATNBL1
|
katanin p80 subunit B-like 1 |
| chr12_+_72061563 | 0.92 |
ENST00000551238.1
|
THAP2
|
THAP domain containing, apoptosis associated protein 2 |
| chr7_+_30589829 | 0.79 |
ENST00000579437.1
|
RP4-777O23.1
|
RP4-777O23.1 |
| chr2_+_161993465 | 0.78 |
ENST00000457476.1
|
TANK
|
TRAF family member-associated NFKB activator |
| chr7_-_34978980 | 0.76 |
ENST00000428054.1
|
DPY19L1
|
dpy-19-like 1 (C. elegans) |
| chrX_+_69501943 | 0.75 |
ENST00000509895.1
ENST00000374473.2 ENST00000276066.4 |
RAB41
|
RAB41, member RAS oncogene family |
| chrX_+_154444643 | 0.75 |
ENST00000286428.5
|
VBP1
|
von Hippel-Lindau binding protein 1 |
| chr15_-_80263506 | 0.71 |
ENST00000335661.6
|
BCL2A1
|
BCL2-related protein A1 |
| chr1_+_219347203 | 0.69 |
ENST00000366927.3
|
LYPLAL1
|
lysophospholipase-like 1 |
| chr5_-_111312622 | 0.69 |
ENST00000395634.3
|
NREP
|
neuronal regeneration related protein |
| chr1_+_74663994 | 0.67 |
ENST00000472069.1
|
FPGT
|
fucose-1-phosphate guanylyltransferase |
| chr4_+_79567057 | 0.66 |
ENST00000503259.1
ENST00000507802.1 |
RP11-792D21.2
|
long intergenic non-protein coding RNA 1094 |
| chr6_-_26199499 | 0.64 |
ENST00000377831.5
|
HIST1H3D
|
histone cluster 1, H3d |
| chr15_+_71228826 | 0.64 |
ENST00000558456.1
ENST00000560158.2 ENST00000558808.1 ENST00000559806.1 ENST00000559069.1 |
LRRC49
|
leucine rich repeat containing 49 |
| chr4_+_79567362 | 0.64 |
ENST00000512322.1
|
RP11-792D21.2
|
long intergenic non-protein coding RNA 1094 |
| chr4_+_76649797 | 0.60 |
ENST00000538159.1
ENST00000514213.2 |
USO1
|
USO1 vesicle transport factor |
| chr12_+_28299014 | 0.60 |
ENST00000538586.1
ENST00000536154.1 |
CCDC91
|
coiled-coil domain containing 91 |
| chr9_-_6015607 | 0.60 |
ENST00000259569.5
|
RANBP6
|
RAN binding protein 6 |
| chr19_-_57967854 | 0.59 |
ENST00000321039.3
|
VN1R1
|
vomeronasal 1 receptor 1 |
| chr21_-_16254231 | 0.59 |
ENST00000412426.1
ENST00000418954.1 |
AF127936.7
|
AF127936.7 |
| chr12_+_32115400 | 0.59 |
ENST00000381054.3
|
KIAA1551
|
KIAA1551 |
| chr21_+_47013566 | 0.59 |
ENST00000441095.1
ENST00000424569.1 |
AL133493.2
|
AL133493.2 |
| chr1_-_115124257 | 0.59 |
ENST00000369541.3
|
BCAS2
|
breast carcinoma amplified sequence 2 |
| chr12_-_118628315 | 0.59 |
ENST00000540561.1
|
TAOK3
|
TAO kinase 3 |
| chr2_+_160590469 | 0.58 |
ENST00000409591.1
|
MARCH7
|
membrane-associated ring finger (C3HC4) 7, E3 ubiquitin protein ligase |
| chr9_+_88556444 | 0.58 |
ENST00000376040.1
|
NAA35
|
N(alpha)-acetyltransferase 35, NatC auxiliary subunit |
| chr2_+_29001711 | 0.58 |
ENST00000418910.1
|
PPP1CB
|
protein phosphatase 1, catalytic subunit, beta isozyme |
| chr6_+_89791507 | 0.58 |
ENST00000354922.3
|
PNRC1
|
proline-rich nuclear receptor coactivator 1 |
| chr9_-_19065082 | 0.56 |
ENST00000415524.1
|
HAUS6
|
HAUS augmin-like complex, subunit 6 |
| chr2_+_161993412 | 0.56 |
ENST00000259075.2
ENST00000432002.1 |
TANK
|
TRAF family member-associated NFKB activator |
| chr4_-_112993808 | 0.56 |
ENST00000511219.1
|
RP11-269F21.3
|
RP11-269F21.3 |
| chr12_-_90049878 | 0.55 |
ENST00000359142.3
|
ATP2B1
|
ATPase, Ca++ transporting, plasma membrane 1 |
| chr1_-_74663825 | 0.55 |
ENST00000370911.3
ENST00000370909.2 ENST00000354431.4 |
LRRIQ3
|
leucine-rich repeats and IQ motif containing 3 |
| chr6_+_26251835 | 0.54 |
ENST00000356350.2
|
HIST1H2BH
|
histone cluster 1, H2bh |
| chr16_+_31724552 | 0.54 |
ENST00000539915.1
ENST00000316491.9 ENST00000399681.3 ENST00000398696.3 ENST00000534369.1 |
ZNF720
|
zinc finger protein 720 |
| chr3_-_148939598 | 0.53 |
ENST00000455472.3
|
CP
|
ceruloplasmin (ferroxidase) |
| chr21_+_35107346 | 0.52 |
ENST00000456489.1
|
ITSN1
|
intersectin 1 (SH3 domain protein) |
| chr6_+_168434678 | 0.51 |
ENST00000496008.1
|
KIF25
|
kinesin family member 25 |
| chr7_+_135611542 | 0.50 |
ENST00000416501.1
|
AC015987.2
|
AC015987.2 |
| chr5_+_154237778 | 0.49 |
ENST00000523698.1
ENST00000517876.1 ENST00000520472.1 |
CNOT8
|
CCR4-NOT transcription complex, subunit 8 |
| chr5_-_89705537 | 0.48 |
ENST00000522864.1
ENST00000522083.1 ENST00000522565.1 ENST00000522842.1 ENST00000283122.3 |
CETN3
|
centrin, EF-hand protein, 3 |
| chr2_+_86333340 | 0.48 |
ENST00000409783.2
ENST00000409277.3 |
PTCD3
|
pentatricopeptide repeat domain 3 |
| chr3_+_108321623 | 0.48 |
ENST00000497905.1
ENST00000463306.1 |
DZIP3
|
DAZ interacting zinc finger protein 3 |
| chr16_+_77756399 | 0.47 |
ENST00000564085.1
ENST00000268533.5 ENST00000568787.1 ENST00000437314.3 ENST00000563839.1 |
NUDT7
|
nudix (nucleoside diphosphate linked moiety X)-type motif 7 |
| chr2_+_198380763 | 0.47 |
ENST00000448447.2
ENST00000409360.1 |
MOB4
|
MOB family member 4, phocein |
| chr4_+_76649753 | 0.47 |
ENST00000603759.1
|
USO1
|
USO1 vesicle transport factor |
| chr3_+_93781728 | 0.47 |
ENST00000314622.4
|
NSUN3
|
NOP2/Sun domain family, member 3 |
| chr4_+_48833312 | 0.46 |
ENST00000508293.1
ENST00000513391.2 |
OCIAD1
|
OCIA domain containing 1 |
| chr6_+_86195088 | 0.45 |
ENST00000437581.1
|
NT5E
|
5'-nucleotidase, ecto (CD73) |
| chr3_+_108015382 | 0.45 |
ENST00000463019.3
ENST00000491820.1 ENST00000467562.1 ENST00000482430.1 ENST00000462629.1 |
HHLA2
|
HERV-H LTR-associating 2 |
| chr12_-_90049828 | 0.44 |
ENST00000261173.2
ENST00000348959.3 |
ATP2B1
|
ATPase, Ca++ transporting, plasma membrane 1 |
| chrX_+_133733457 | 0.44 |
ENST00000440614.1
|
RP11-308B5.2
|
RP11-308B5.2 |
| chr5_+_154238096 | 0.43 |
ENST00000517568.1
ENST00000524105.1 ENST00000285896.6 |
CNOT8
|
CCR4-NOT transcription complex, subunit 8 |
| chr1_+_92632542 | 0.43 |
ENST00000409154.4
ENST00000370378.4 |
KIAA1107
|
KIAA1107 |
| chr11_-_95522639 | 0.42 |
ENST00000536839.1
|
FAM76B
|
family with sequence similarity 76, member B |
| chr18_+_61445007 | 0.42 |
ENST00000447428.1
ENST00000546027.1 |
SERPINB7
|
serpin peptidase inhibitor, clade B (ovalbumin), member 7 |
| chr14_-_80697396 | 0.42 |
ENST00000557010.1
|
DIO2
|
deiodinase, iodothyronine, type II |
| chr11_+_13690200 | 0.42 |
ENST00000354817.3
|
FAR1
|
fatty acyl CoA reductase 1 |
| chr11_-_95522907 | 0.41 |
ENST00000358780.5
ENST00000542135.1 |
FAM76B
|
family with sequence similarity 76, member B |
| chr1_+_40997233 | 0.41 |
ENST00000372699.3
ENST00000372697.3 ENST00000372696.3 |
ZNF684
|
zinc finger protein 684 |
| chr5_+_68513622 | 0.40 |
ENST00000512880.1
ENST00000602380.1 |
MRPS36
|
mitochondrial ribosomal protein S36 |
| chr3_-_149093499 | 0.40 |
ENST00000472441.1
|
TM4SF1
|
transmembrane 4 L six family member 1 |
| chr12_+_25348186 | 0.40 |
ENST00000555711.1
ENST00000556885.1 ENST00000554266.1 ENST00000556351.1 ENST00000556927.1 ENST00000556402.1 ENST00000553788.1 |
LYRM5
|
LYR motif containing 5 |
| chr10_+_78078088 | 0.39 |
ENST00000496424.2
|
C10orf11
|
chromosome 10 open reading frame 11 |
| chr11_-_114271139 | 0.38 |
ENST00000325636.4
|
C11orf71
|
chromosome 11 open reading frame 71 |
| chr11_+_95523621 | 0.37 |
ENST00000325542.5
ENST00000325486.5 ENST00000544522.1 ENST00000541365.1 |
CEP57
|
centrosomal protein 57kDa |
| chr10_-_48806939 | 0.37 |
ENST00000374233.3
ENST00000507417.1 ENST00000512321.1 ENST00000395660.2 ENST00000374235.2 ENST00000395661.3 |
PTPN20B
|
protein tyrosine phosphatase, non-receptor type 20B |
| chrX_+_100878079 | 0.35 |
ENST00000471229.2
|
ARMCX3
|
armadillo repeat containing, X-linked 3 |
| chr13_+_21141208 | 0.35 |
ENST00000351808.5
|
IFT88
|
intraflagellar transport 88 homolog (Chlamydomonas) |
| chrM_+_10758 | 0.34 |
ENST00000361381.2
|
MT-ND4
|
mitochondrially encoded NADH dehydrogenase 4 |
| chr11_+_43333513 | 0.34 |
ENST00000534695.1
ENST00000455725.2 ENST00000531273.1 ENST00000420461.2 ENST00000378852.3 ENST00000534600.1 |
API5
|
apoptosis inhibitor 5 |
| chr14_+_67831576 | 0.34 |
ENST00000555876.1
|
EIF2S1
|
eukaryotic translation initiation factor 2, subunit 1 alpha, 35kDa |
| chr2_+_60983361 | 0.34 |
ENST00000238714.3
|
PAPOLG
|
poly(A) polymerase gamma |
| chr3_+_97483366 | 0.34 |
ENST00000463745.1
ENST00000462412.1 |
ARL6
|
ADP-ribosylation factor-like 6 |
| chr5_+_154238042 | 0.34 |
ENST00000519211.1
ENST00000522458.1 ENST00000519903.1 ENST00000521450.1 ENST00000403027.2 |
CNOT8
|
CCR4-NOT transcription complex, subunit 8 |
| chr13_+_21141270 | 0.34 |
ENST00000319980.6
ENST00000537103.1 ENST00000389373.3 |
IFT88
|
intraflagellar transport 88 homolog (Chlamydomonas) |
| chr1_+_74663896 | 0.33 |
ENST00000370898.3
ENST00000467578.2 ENST00000370894.5 ENST00000482102.2 ENST00000609362.1 ENST00000534056.1 ENST00000557284.2 ENST00000370899.3 ENST00000370895.1 ENST00000534632.1 ENST00000370893.1 ENST00000370891.2 |
FPGT
FPGT-TNNI3K
TNNI3K
|
fucose-1-phosphate guanylyltransferase FPGT-TNNI3K readthrough TNNI3 interacting kinase |
| chr15_+_44719970 | 0.33 |
ENST00000558966.1
|
CTDSPL2
|
CTD (carboxy-terminal domain, RNA polymerase II, polypeptide A) small phosphatase like 2 |
| chr5_-_95297534 | 0.32 |
ENST00000513343.1
ENST00000431061.2 |
ELL2
|
elongation factor, RNA polymerase II, 2 |
| chr6_-_76072719 | 0.32 |
ENST00000370020.1
|
FILIP1
|
filamin A interacting protein 1 |
| chr12_-_76817036 | 0.32 |
ENST00000546946.1
|
OSBPL8
|
oxysterol binding protein-like 8 |
| chr16_-_15149917 | 0.31 |
ENST00000287706.3
|
NTAN1
|
N-terminal asparagine amidase |
| chr11_+_10772847 | 0.30 |
ENST00000524523.1
|
CTR9
|
CTR9, Paf1/RNA polymerase II complex component |
| chr5_+_154238149 | 0.30 |
ENST00000519430.1
ENST00000520671.1 ENST00000521583.1 ENST00000518028.1 ENST00000519404.1 ENST00000519394.1 ENST00000518775.1 |
CNOT8
|
CCR4-NOT transcription complex, subunit 8 |
| chr5_-_74326724 | 0.30 |
ENST00000322348.4
|
GCNT4
|
glucosaminyl (N-acetyl) transferase 4, core 2 |
| chr8_-_86575726 | 0.30 |
ENST00000379010.2
|
REXO1L1
|
REX1, RNA exonuclease 1 homolog (S. cerevisiae)-like 1, pseudogene |
| chr5_-_75919217 | 0.30 |
ENST00000504899.1
|
F2RL2
|
coagulation factor II (thrombin) receptor-like 2 |
| chr6_-_150346607 | 0.30 |
ENST00000367341.1
ENST00000286380.2 |
RAET1L
|
retinoic acid early transcript 1L |
| chr12_+_31812121 | 0.30 |
ENST00000395763.3
|
METTL20
|
methyltransferase like 20 |
| chr1_+_64014588 | 0.30 |
ENST00000371086.2
ENST00000340052.3 |
DLEU2L
|
deleted in lymphocytic leukemia 2-like |
| chr14_-_102552659 | 0.30 |
ENST00000441629.2
|
HSP90AA1
|
heat shock protein 90kDa alpha (cytosolic), class A member 1 |
| chr1_+_53480598 | 0.29 |
ENST00000430330.2
ENST00000408941.3 ENST00000478274.2 ENST00000484100.1 ENST00000435345.2 ENST00000488965.1 |
SCP2
|
sterol carrier protein 2 |
| chr6_-_71666732 | 0.29 |
ENST00000230053.6
|
B3GAT2
|
beta-1,3-glucuronyltransferase 2 (glucuronosyltransferase S) |
| chr13_-_31191642 | 0.29 |
ENST00000405805.1
|
HMGB1
|
high mobility group box 1 |
| chr10_-_112064665 | 0.29 |
ENST00000369603.5
|
SMNDC1
|
survival motor neuron domain containing 1 |
| chr2_+_234600253 | 0.29 |
ENST00000373424.1
ENST00000441351.1 |
UGT1A6
|
UDP glucuronosyltransferase 1 family, polypeptide A6 |
| chr1_+_66458072 | 0.29 |
ENST00000423207.2
|
PDE4B
|
phosphodiesterase 4B, cAMP-specific |
| chr4_+_79567314 | 0.28 |
ENST00000503539.1
ENST00000504675.1 |
RP11-792D21.2
|
long intergenic non-protein coding RNA 1094 |
| chr2_+_190722119 | 0.28 |
ENST00000452382.1
|
PMS1
|
PMS1 postmeiotic segregation increased 1 (S. cerevisiae) |
| chr11_+_114270752 | 0.28 |
ENST00000540163.1
|
RBM7
|
RNA binding motif protein 7 |
| chr15_+_21145765 | 0.28 |
ENST00000553416.1
|
CT60
|
cancer/testis antigen 60 (non-protein coding) |
| chr12_-_75784669 | 0.28 |
ENST00000552497.1
ENST00000551829.1 ENST00000436898.1 ENST00000442339.2 |
CAPS2
|
calcyphosine 2 |
| chr18_+_68002675 | 0.28 |
ENST00000584919.1
|
RP11-41O4.1
|
Uncharacterized protein |
| chr15_-_49912987 | 0.28 |
ENST00000560246.1
ENST00000558594.1 |
FAM227B
|
family with sequence similarity 227, member B |
| chr2_-_24299308 | 0.28 |
ENST00000233468.4
|
SF3B14
|
Pre-mRNA branch site protein p14 |
| chr2_-_201753717 | 0.28 |
ENST00000409264.2
|
PPIL3
|
peptidylprolyl isomerase (cyclophilin)-like 3 |
| chr6_-_75953484 | 0.27 |
ENST00000472311.2
ENST00000460985.1 ENST00000377978.3 ENST00000509698.1 ENST00000230459.4 ENST00000370089.2 |
COX7A2
|
cytochrome c oxidase subunit VIIa polypeptide 2 (liver) |
| chr6_+_130339710 | 0.27 |
ENST00000526087.1
ENST00000533560.1 ENST00000361794.2 |
L3MBTL3
|
l(3)mbt-like 3 (Drosophila) |
| chr5_+_32585605 | 0.27 |
ENST00000265073.4
ENST00000515355.1 ENST00000502897.1 ENST00000510442.1 |
SUB1
|
SUB1 homolog (S. cerevisiae) |
| chr10_-_46620012 | 0.27 |
ENST00000508602.1
ENST00000374339.3 ENST00000502254.1 ENST00000437863.1 ENST00000374342.2 ENST00000395722.3 |
PTPN20A
|
protein tyrosine phosphatase, non-receptor type 20A |
| chr1_+_78383813 | 0.27 |
ENST00000342754.5
|
NEXN
|
nexilin (F actin binding protein) |
| chr12_+_28605426 | 0.27 |
ENST00000542801.1
|
CCDC91
|
coiled-coil domain containing 91 |
| chr15_+_44719790 | 0.26 |
ENST00000558791.1
|
CTDSPL2
|
CTD (carboxy-terminal domain, RNA polymerase II, polypeptide A) small phosphatase like 2 |
| chr4_+_156775910 | 0.26 |
ENST00000506072.1
ENST00000507590.1 |
TDO2
|
tryptophan 2,3-dioxygenase |
| chr14_+_85994943 | 0.26 |
ENST00000553678.1
|
RP11-497E19.2
|
Uncharacterized protein |
| chr4_+_40751914 | 0.26 |
ENST00000381782.2
ENST00000316607.5 |
NSUN7
|
NOP2/Sun domain family, member 7 |
| chr16_+_21623392 | 0.25 |
ENST00000562961.1
|
METTL9
|
methyltransferase like 9 |
| chr12_-_118796971 | 0.25 |
ENST00000542902.1
|
TAOK3
|
TAO kinase 3 |
| chr8_+_67104940 | 0.25 |
ENST00000517689.1
|
LINC00967
|
long intergenic non-protein coding RNA 967 |
| chrX_-_55187588 | 0.25 |
ENST00000472571.2
ENST00000332132.4 ENST00000425133.2 ENST00000358460.4 |
FAM104B
|
family with sequence similarity 104, member B |
| chr6_-_133055896 | 0.25 |
ENST00000367927.5
ENST00000425515.2 ENST00000207771.3 ENST00000392393.3 ENST00000450865.2 ENST00000392394.2 |
VNN3
|
vanin 3 |
| chr4_+_77941685 | 0.25 |
ENST00000506731.1
|
SEPT11
|
septin 11 |
| chr12_-_118796910 | 0.25 |
ENST00000541186.1
ENST00000539872.1 |
TAOK3
|
TAO kinase 3 |
| chr8_-_82754427 | 0.25 |
ENST00000353788.4
ENST00000520618.1 ENST00000518183.1 ENST00000396330.2 ENST00000519119.1 ENST00000345957.4 |
SNX16
|
sorting nexin 16 |
| chr3_+_179280668 | 0.25 |
ENST00000429709.2
ENST00000450518.2 ENST00000392662.1 ENST00000490364.1 |
ACTL6A
|
actin-like 6A |
| chr5_+_68860949 | 0.24 |
ENST00000507595.1
|
GTF2H2C
|
general transcription factor IIH, polypeptide 2C |
| chr8_-_17752996 | 0.24 |
ENST00000381841.2
ENST00000427924.1 |
FGL1
|
fibrinogen-like 1 |
| chr1_-_110933663 | 0.24 |
ENST00000369781.4
ENST00000541986.1 ENST00000369779.4 |
SLC16A4
|
solute carrier family 16, member 4 |
| chr1_-_110933611 | 0.24 |
ENST00000472422.2
ENST00000437429.2 |
SLC16A4
|
solute carrier family 16, member 4 |
| chr1_-_91487770 | 0.24 |
ENST00000337393.5
|
ZNF644
|
zinc finger protein 644 |
| chr6_+_31553978 | 0.24 |
ENST00000376096.1
ENST00000376099.1 ENST00000376110.3 |
LST1
|
leukocyte specific transcript 1 |
| chr4_-_71532668 | 0.23 |
ENST00000510437.1
|
IGJ
|
immunoglobulin J polypeptide, linker protein for immunoglobulin alpha and mu polypeptides |
| chrX_-_154689596 | 0.23 |
ENST00000369444.2
|
H2AFB3
|
H2A histone family, member B3 |
| chr12_-_51422017 | 0.23 |
ENST00000394904.3
|
SLC11A2
|
solute carrier family 11 (proton-coupled divalent metal ion transporter), member 2 |
| chr11_-_95523500 | 0.23 |
ENST00000540054.1
|
FAM76B
|
family with sequence similarity 76, member B |
| chr16_+_24549014 | 0.22 |
ENST00000564314.1
ENST00000567686.1 |
RBBP6
|
retinoblastoma binding protein 6 |
| chr14_-_75536182 | 0.22 |
ENST00000555463.1
|
ACYP1
|
acylphosphatase 1, erythrocyte (common) type |
| chr15_-_66679019 | 0.22 |
ENST00000568216.1
ENST00000562124.1 ENST00000570251.1 |
TIPIN
|
TIMELESS interacting protein |
| chr2_+_32390925 | 0.22 |
ENST00000440718.1
ENST00000379343.2 ENST00000282587.5 ENST00000435660.1 ENST00000538303.1 ENST00000357055.3 ENST00000406369.1 |
SLC30A6
|
solute carrier family 30 (zinc transporter), member 6 |
| chr3_-_120461378 | 0.22 |
ENST00000273375.3
|
RABL3
|
RAB, member of RAS oncogene family-like 3 |
| chr3_-_93781750 | 0.21 |
ENST00000314636.2
|
DHFRL1
|
dihydrofolate reductase-like 1 |
| chr4_-_87028478 | 0.21 |
ENST00000515400.1
ENST00000395157.3 |
MAPK10
|
mitogen-activated protein kinase 10 |
| chr1_-_234667504 | 0.21 |
ENST00000421207.1
ENST00000435574.1 |
RP5-855F14.1
|
RP5-855F14.1 |
| chr4_-_77069573 | 0.21 |
ENST00000264883.3
|
NUP54
|
nucleoporin 54kDa |
| chr2_-_161350305 | 0.21 |
ENST00000348849.3
|
RBMS1
|
RNA binding motif, single stranded interacting protein 1 |
| chr14_+_61447927 | 0.21 |
ENST00000451406.1
|
SLC38A6
|
solute carrier family 38, member 6 |
| chr4_+_56719782 | 0.20 |
ENST00000381295.2
ENST00000346134.7 ENST00000349598.6 |
EXOC1
|
exocyst complex component 1 |
| chr11_-_2924970 | 0.20 |
ENST00000533594.1
|
SLC22A18AS
|
solute carrier family 22 (organic cation transporter), member 18 antisense |
| chr19_-_54663473 | 0.20 |
ENST00000222224.3
|
LENG1
|
leukocyte receptor cluster (LRC) member 1 |
| chr3_+_107364683 | 0.20 |
ENST00000413213.1
|
BBX
|
bobby sox homolog (Drosophila) |
| chr5_+_145826867 | 0.20 |
ENST00000296702.5
ENST00000394421.2 |
TCERG1
|
transcription elongation regulator 1 |
| chr2_-_69180083 | 0.20 |
ENST00000328895.4
|
GKN2
|
gastrokine 2 |
| chr9_+_139877445 | 0.19 |
ENST00000408973.2
|
LCNL1
|
lipocalin-like 1 |
| chr5_-_77590480 | 0.19 |
ENST00000519295.1
ENST00000255194.6 |
AP3B1
|
adaptor-related protein complex 3, beta 1 subunit |
| chr4_-_69536346 | 0.19 |
ENST00000338206.5
|
UGT2B15
|
UDP glucuronosyltransferase 2 family, polypeptide B15 |
| chr1_-_42801540 | 0.19 |
ENST00000372573.1
|
FOXJ3
|
forkhead box J3 |
| chr11_-_5526834 | 0.19 |
ENST00000380237.1
ENST00000396895.1 ENST00000380252.1 |
HBE1
HBG2
|
hemoglobin, epsilon 1 hemoglobin, gamma G |
| chr1_+_170501270 | 0.18 |
ENST00000367763.3
ENST00000367762.1 |
GORAB
|
golgin, RAB6-interacting |
| chr14_+_61447832 | 0.18 |
ENST00000354886.2
ENST00000267488.4 |
SLC38A6
|
solute carrier family 38, member 6 |
| chr14_-_61447752 | 0.18 |
ENST00000555420.1
ENST00000553903.1 |
TRMT5
|
tRNA methyltransferase 5 |
| chr10_+_70661014 | 0.18 |
ENST00000373585.3
|
DDX50
|
DEAD (Asp-Glu-Ala-Asp) box polypeptide 50 |
| chr12_-_14967095 | 0.18 |
ENST00000316048.2
|
SMCO3
|
single-pass membrane protein with coiled-coil domains 3 |
| chr2_-_201753980 | 0.18 |
ENST00000443398.1
ENST00000286175.8 ENST00000409449.1 |
PPIL3
|
peptidylprolyl isomerase (cyclophilin)-like 3 |
| chr10_-_17171785 | 0.17 |
ENST00000377823.1
|
CUBN
|
cubilin (intrinsic factor-cobalamin receptor) |
| chr4_-_106629796 | 0.17 |
ENST00000416543.1
ENST00000515819.1 ENST00000420368.2 ENST00000503746.1 ENST00000340139.5 ENST00000433009.1 |
INTS12
|
integrator complex subunit 12 |
| chr15_-_43398274 | 0.17 |
ENST00000382177.2
ENST00000290650.4 |
UBR1
|
ubiquitin protein ligase E3 component n-recognin 1 |
| chr6_-_49604545 | 0.17 |
ENST00000371175.4
ENST00000229810.7 |
RHAG
|
Rh-associated glycoprotein |
| chrX_+_46306624 | 0.17 |
ENST00000360017.5
|
KRBOX4
|
KRAB box domain containing 4 |
| chr21_+_17566643 | 0.17 |
ENST00000419952.1
ENST00000445461.2 |
LINC00478
|
long intergenic non-protein coding RNA 478 |
| chr5_+_31532373 | 0.17 |
ENST00000325366.9
ENST00000355907.3 ENST00000507818.2 |
C5orf22
|
chromosome 5 open reading frame 22 |
| chr10_-_33281363 | 0.17 |
ENST00000534049.1
|
ITGB1
|
integrin, beta 1 (fibronectin receptor, beta polypeptide, antigen CD29 includes MDF2, MSK12) |
| chr3_-_194188956 | 0.17 |
ENST00000256031.4
ENST00000446356.1 |
ATP13A3
|
ATPase type 13A3 |
| chr9_-_75695323 | 0.16 |
ENST00000419959.1
|
ALDH1A1
|
aldehyde dehydrogenase 1 family, member A1 |
| chr5_+_102201687 | 0.16 |
ENST00000304400.7
|
PAM
|
peptidylglycine alpha-amidating monooxygenase |
| chrX_-_122756660 | 0.16 |
ENST00000441692.1
|
THOC2
|
THO complex 2 |
| chr3_+_118892362 | 0.16 |
ENST00000497685.1
ENST00000264234.3 |
UPK1B
|
uroplakin 1B |
| chr1_-_220219775 | 0.16 |
ENST00000609181.1
|
EPRS
|
glutamyl-prolyl-tRNA synthetase |
| chr3_+_107364769 | 0.16 |
ENST00000449271.1
ENST00000425868.1 ENST00000449213.1 |
BBX
|
bobby sox homolog (Drosophila) |
| chr1_+_104159999 | 0.16 |
ENST00000414303.2
ENST00000423678.1 |
AMY2A
|
amylase, alpha 2A (pancreatic) |
| chr12_-_12837423 | 0.16 |
ENST00000540510.1
|
GPR19
|
G protein-coupled receptor 19 |
| chr12_-_10601963 | 0.16 |
ENST00000543893.1
|
KLRC1
|
killer cell lectin-like receptor subfamily C, member 1 |
| chr6_-_74104856 | 0.16 |
ENST00000441145.1
|
OOEP
|
oocyte expressed protein |
| chr7_+_1126437 | 0.16 |
ENST00000413368.1
ENST00000397092.1 |
GPER1
|
G protein-coupled estrogen receptor 1 |
| chr11_+_13690249 | 0.16 |
ENST00000532701.1
|
FAR1
|
fatty acyl CoA reductase 1 |
| chr7_+_93690435 | 0.15 |
ENST00000438538.1
|
AC003092.1
|
AC003092.1 |
| chr4_-_76649546 | 0.15 |
ENST00000508510.1
ENST00000509561.1 ENST00000499709.2 ENST00000511868.1 |
G3BP2
|
GTPase activating protein (SH3 domain) binding protein 2 |
| chr17_+_74463650 | 0.15 |
ENST00000392492.3
|
AANAT
|
aralkylamine N-acetyltransferase |
| chr5_-_1882858 | 0.15 |
ENST00000511126.1
ENST00000231357.2 |
IRX4
|
iroquois homeobox 4 |
| chr6_+_150920999 | 0.14 |
ENST00000367328.1
ENST00000367326.1 |
PLEKHG1
|
pleckstrin homology domain containing, family G (with RhoGef domain) member 1 |
| chr7_+_134331550 | 0.14 |
ENST00000344924.3
ENST00000418040.1 ENST00000393132.2 |
BPGM
|
2,3-bisphosphoglycerate mutase |
| chr13_-_76111945 | 0.14 |
ENST00000355801.4
ENST00000406936.3 |
COMMD6
|
COMM domain containing 6 |
| chr5_-_66492562 | 0.14 |
ENST00000256447.4
|
CD180
|
CD180 molecule |
| chr12_-_54653313 | 0.14 |
ENST00000550411.1
ENST00000439541.2 |
CBX5
|
chromobox homolog 5 |
| chr4_-_130692631 | 0.14 |
ENST00000500092.2
ENST00000509105.1 |
RP11-519M16.1
|
RP11-519M16.1 |
Network of associatons between targets according to the STRING database.

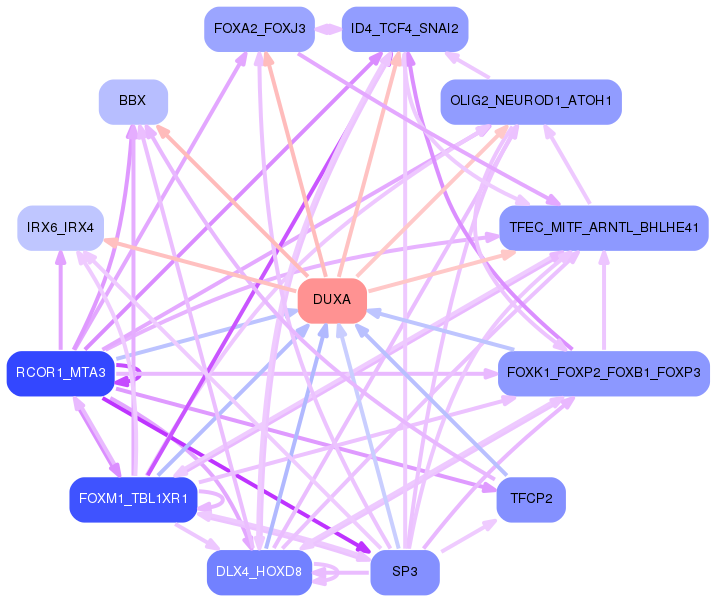
First level regulatory network of DUXA
Gene Ontology Analysis
Gene overrepresentation in biological_process category:
| Log-likelihood per target | Total log-likelihood | Term | Description |
|---|---|---|---|
| 0.5 | 1.5 | GO:0045360 | interleukin-1 biosynthetic process(GO:0042222) regulation of interleukin-1 biosynthetic process(GO:0045360) positive regulation of interleukin-1 biosynthetic process(GO:0045362) |
| 0.2 | 1.7 | GO:1900747 | negative regulation of vascular endothelial growth factor signaling pathway(GO:1900747) |
| 0.2 | 2.1 | GO:0051902 | negative regulation of mitochondrial depolarization(GO:0051902) |
| 0.2 | 1.3 | GO:2000158 | positive regulation of ubiquitin-specific protease activity(GO:2000158) |
| 0.2 | 0.5 | GO:0046603 | negative regulation of mitotic centrosome separation(GO:0046603) |
| 0.2 | 0.5 | GO:0046356 | acetyl-CoA catabolic process(GO:0046356) |
| 0.2 | 0.5 | GO:0002101 | tRNA wobble cytosine modification(GO:0002101) |
| 0.1 | 0.6 | GO:0008611 | ether lipid biosynthetic process(GO:0008611) glycerol ether biosynthetic process(GO:0046504) ether biosynthetic process(GO:1901503) |
| 0.1 | 1.0 | GO:1990034 | cellular response to corticosterone stimulus(GO:0071386) calcium ion export from cell(GO:1990034) |
| 0.1 | 0.3 | GO:0002121 | inter-male aggressive behavior(GO:0002121) |
| 0.1 | 0.6 | GO:0019236 | response to pheromone(GO:0019236) |
| 0.1 | 0.4 | GO:2001160 | regulation of histone H3-K79 methylation(GO:2001160) positive regulation of histone H3-K79 methylation(GO:2001162) |
| 0.1 | 0.5 | GO:0046086 | adenosine biosynthetic process(GO:0046086) |
| 0.1 | 0.3 | GO:1990737 | response to manganese-induced endoplasmic reticulum stress(GO:1990737) |
| 0.1 | 0.3 | GO:0046909 | intermembrane transport(GO:0046909) protein transport from ciliary membrane to plasma membrane(GO:1903445) |
| 0.1 | 0.4 | GO:0090362 | positive regulation of platelet-derived growth factor production(GO:0090362) |
| 0.1 | 0.2 | GO:0030264 | nuclear fragmentation involved in apoptotic nuclear change(GO:0030264) |
| 0.1 | 1.1 | GO:0048280 | vesicle fusion with Golgi apparatus(GO:0048280) |
| 0.1 | 0.3 | GO:0032072 | plasmacytoid dendritic cell activation(GO:0002270) regulation of restriction endodeoxyribonuclease activity(GO:0032072) T-helper 1 cell activation(GO:0035711) negative regulation of apoptotic cell clearance(GO:2000426) |
| 0.1 | 0.8 | GO:0018103 | protein C-linked glycosylation(GO:0018103) peptidyl-tryptophan modification(GO:0018211) protein C-linked glycosylation via tryptophan(GO:0018317) protein C-linked glycosylation via 2'-alpha-mannosyl-L-tryptophan(GO:0018406) |
| 0.1 | 0.3 | GO:0019442 | tryptophan catabolic process to acetyl-CoA(GO:0019442) |
| 0.1 | 0.2 | GO:0048003 | antigen processing and presentation of lipid antigen via MHC class Ib(GO:0048003) antigen processing and presentation, exogenous lipid antigen via MHC class Ib(GO:0048007) |
| 0.1 | 0.7 | GO:0002084 | protein depalmitoylation(GO:0002084) |
| 0.1 | 0.3 | GO:0043335 | protein unfolding(GO:0043335) |
| 0.1 | 0.2 | GO:0035378 | carbon dioxide transmembrane transport(GO:0035378) |
| 0.1 | 0.2 | GO:0006433 | glutamyl-tRNA aminoacylation(GO:0006424) prolyl-tRNA aminoacylation(GO:0006433) |
| 0.1 | 0.6 | GO:0031087 | deadenylation-independent decapping of nuclear-transcribed mRNA(GO:0031087) |
| 0.1 | 0.2 | GO:0036228 | protein targeting to nuclear inner membrane(GO:0036228) |
| 0.0 | 0.1 | GO:0030186 | melatonin metabolic process(GO:0030186) melatonin biosynthetic process(GO:0030187) |
| 0.0 | 0.3 | GO:0018032 | protein amidation(GO:0018032) |
| 0.0 | 1.0 | GO:0006004 | fucose metabolic process(GO:0006004) |
| 0.0 | 0.3 | GO:0032377 | regulation of intracellular lipid transport(GO:0032377) regulation of intracellular sterol transport(GO:0032380) regulation of intracellular cholesterol transport(GO:0032383) |
| 0.0 | 0.1 | GO:0060139 | positive regulation by symbiont of host apoptotic process(GO:0052151) positive regulation of apoptotic process by virus(GO:0060139) |
| 0.0 | 0.2 | GO:0010710 | regulation of collagen catabolic process(GO:0010710) |
| 0.0 | 0.6 | GO:0005981 | regulation of glycogen catabolic process(GO:0005981) |
| 0.0 | 0.2 | GO:0015692 | lead ion transport(GO:0015692) |
| 0.0 | 0.2 | GO:0070901 | mitochondrial tRNA methylation(GO:0070901) |
| 0.0 | 0.1 | GO:0043456 | regulation of pentose-phosphate shunt(GO:0043456) |
| 0.0 | 0.6 | GO:0002643 | regulation of tolerance induction(GO:0002643) |
| 0.0 | 0.1 | GO:1903216 | regulation of protein processing involved in protein targeting to mitochondrion(GO:1903216) negative regulation of protein processing involved in protein targeting to mitochondrion(GO:1903217) |
| 0.0 | 0.2 | GO:0044245 | polysaccharide digestion(GO:0044245) |
| 0.0 | 0.4 | GO:0052697 | flavonoid glucuronidation(GO:0052696) xenobiotic glucuronidation(GO:0052697) |
| 0.0 | 0.3 | GO:2000270 | negative regulation of fibroblast apoptotic process(GO:2000270) |
| 0.0 | 0.7 | GO:0007021 | tubulin complex assembly(GO:0007021) |
| 0.0 | 0.2 | GO:0061624 | fructose catabolic process(GO:0006001) fructose catabolic process to hydroxyacetone phosphate and glyceraldehyde-3-phosphate(GO:0061624) |
| 0.0 | 0.2 | GO:0048478 | replication fork protection(GO:0048478) |
| 0.0 | 0.3 | GO:0090204 | protein localization to nuclear pore(GO:0090204) |
| 0.0 | 0.6 | GO:0006474 | N-terminal protein amino acid acetylation(GO:0006474) |
| 0.0 | 1.2 | GO:0043928 | exonucleolytic nuclear-transcribed mRNA catabolic process involved in deadenylation-dependent decay(GO:0043928) |
| 0.0 | 0.5 | GO:0006451 | selenocysteine incorporation(GO:0001514) translational readthrough(GO:0006451) |
| 0.0 | 0.6 | GO:0006825 | copper ion transport(GO:0006825) |
| 0.0 | 0.1 | GO:2000255 | negative regulation of male germ cell proliferation(GO:2000255) |
| 0.0 | 0.8 | GO:0007095 | mitotic G2 DNA damage checkpoint(GO:0007095) |
| 0.0 | 0.4 | GO:0090160 | Golgi to lysosome transport(GO:0090160) |
| 0.0 | 0.4 | GO:0015939 | pantothenate metabolic process(GO:0015939) |
| 0.0 | 0.3 | GO:0043249 | erythrocyte maturation(GO:0043249) |
| 0.0 | 0.2 | GO:0015889 | cobalamin transport(GO:0015889) |
| 0.0 | 0.3 | GO:1901898 | negative regulation of relaxation of muscle(GO:1901078) negative regulation of relaxation of cardiac muscle(GO:1901898) |
| 0.0 | 0.7 | GO:0008053 | mitochondrial fusion(GO:0008053) |
| 0.0 | 0.1 | GO:0043686 | co-translational protein modification(GO:0043686) |
| 0.0 | 0.2 | GO:0061088 | regulation of sequestering of zinc ion(GO:0061088) |
| 0.0 | 0.2 | GO:0010501 | RNA secondary structure unwinding(GO:0010501) |
| 0.0 | 0.1 | GO:0031666 | positive regulation of lipopolysaccharide-mediated signaling pathway(GO:0031666) |
| 0.0 | 0.0 | GO:0032917 | polyamine acetylation(GO:0032917) spermidine acetylation(GO:0032918) |
| 0.0 | 0.6 | GO:0046827 | positive regulation of protein export from nucleus(GO:0046827) |
| 0.0 | 0.2 | GO:0052695 | cellular glucuronidation(GO:0052695) |
| 0.0 | 0.2 | GO:0007258 | JUN phosphorylation(GO:0007258) |
| 0.0 | 0.4 | GO:0070493 | thrombin receptor signaling pathway(GO:0070493) |
| 0.0 | 0.3 | GO:0006610 | ribosomal protein import into nucleus(GO:0006610) |
| 0.0 | 0.0 | GO:0070563 | negative regulation of vitamin D receptor signaling pathway(GO:0070563) |
| 0.0 | 0.2 | GO:0051601 | exocyst localization(GO:0051601) |
| 0.0 | 0.4 | GO:0042104 | positive regulation of activated T cell proliferation(GO:0042104) |
| 0.0 | 0.7 | GO:2000785 | regulation of autophagosome assembly(GO:2000785) |
| 0.0 | 0.0 | GO:0021779 | oligodendrocyte cell fate specification(GO:0021778) oligodendrocyte cell fate commitment(GO:0021779) glial cell fate specification(GO:0021780) |
| 0.0 | 0.1 | GO:2000172 | regulation of branching morphogenesis of a nerve(GO:2000172) |
| 0.0 | 0.0 | GO:0042264 | peptidyl-aspartic acid hydroxylation(GO:0042264) |
| 0.0 | 0.1 | GO:0061732 | mitochondrial acetyl-CoA biosynthetic process from pyruvate(GO:0061732) |
| 0.0 | 0.2 | GO:0015671 | oxygen transport(GO:0015671) |
| 0.0 | 0.2 | GO:1901620 | regulation of smoothened signaling pathway involved in dorsal/ventral neural tube patterning(GO:1901620) |
| 0.0 | 0.5 | GO:0034453 | microtubule anchoring(GO:0034453) |
| 0.0 | 0.1 | GO:0038172 | interleukin-33-mediated signaling pathway(GO:0038172) |
| 0.0 | 0.1 | GO:0007185 | transmembrane receptor protein tyrosine phosphatase signaling pathway(GO:0007185) |
Gene overrepresentation in cellular_component category:
| Log-likelihood per target | Total log-likelihood | Term | Description |
|---|---|---|---|
| 0.3 | 1.8 | GO:0005589 | collagen type VI trimer(GO:0005589) collagen beaded filament(GO:0098647) |
| 0.1 | 0.6 | GO:0031417 | NatC complex(GO:0031417) |
| 0.1 | 0.3 | GO:0043614 | multi-eIF complex(GO:0043614) translation preinitiation complex(GO:0070993) astrocyte end-foot(GO:0097450) glial limiting end-foot(GO:0097451) |
| 0.1 | 1.4 | GO:0030015 | CCR4-NOT core complex(GO:0030015) |
| 0.1 | 0.7 | GO:0016272 | prefoldin complex(GO:0016272) |
| 0.1 | 0.3 | GO:0005879 | axonemal microtubule(GO:0005879) |
| 0.1 | 0.5 | GO:0005947 | mitochondrial alpha-ketoglutarate dehydrogenase complex(GO:0005947) |
| 0.1 | 1.2 | GO:0032591 | dendritic spine membrane(GO:0032591) |
| 0.1 | 0.2 | GO:0034677 | integrin alpha7-beta1 complex(GO:0034677) |
| 0.1 | 0.2 | GO:0098592 | cytoplasmic side of apical plasma membrane(GO:0098592) |
| 0.0 | 0.5 | GO:0000836 | Hrd1p ubiquitin ligase complex(GO:0000836) |
| 0.0 | 0.6 | GO:0070652 | HAUS complex(GO:0070652) |
| 0.0 | 0.2 | GO:0070826 | paraferritin complex(GO:0070826) |
| 0.0 | 0.3 | GO:0032389 | MutLalpha complex(GO:0032389) |
| 0.0 | 0.6 | GO:0072357 | PTW/PP1 phosphatase complex(GO:0072357) |
| 0.0 | 0.1 | GO:0031251 | PAN complex(GO:0031251) |
| 0.0 | 0.4 | GO:0016593 | Cdc73/Paf1 complex(GO:0016593) |
| 0.0 | 0.2 | GO:0031232 | extrinsic component of external side of plasma membrane(GO:0031232) |
| 0.0 | 0.6 | GO:0005662 | DNA replication factor A complex(GO:0005662) |
| 0.0 | 0.2 | GO:0005833 | hemoglobin complex(GO:0005833) |
| 0.0 | 0.2 | GO:0031313 | extrinsic component of endosome membrane(GO:0031313) |
| 0.0 | 0.2 | GO:0000439 | core TFIIH complex(GO:0000439) |
| 0.0 | 0.7 | GO:0030992 | intraciliary transport particle B(GO:0030992) |
| 0.0 | 0.2 | GO:0097452 | GAIT complex(GO:0097452) |
| 0.0 | 0.2 | GO:0005577 | fibrinogen complex(GO:0005577) |
| 0.0 | 0.2 | GO:0031298 | replication fork protection complex(GO:0031298) |
| 0.0 | 0.2 | GO:0000347 | THO complex(GO:0000347) THO complex part of transcription export complex(GO:0000445) |
| 0.0 | 0.1 | GO:0042406 | extrinsic component of endoplasmic reticulum membrane(GO:0042406) |
| 0.0 | 0.9 | GO:0031907 | peroxisomal matrix(GO:0005782) microbody lumen(GO:0031907) |
| 0.0 | 0.1 | GO:0045254 | pyruvate dehydrogenase complex(GO:0045254) |
| 0.0 | 0.1 | GO:0034715 | pICln-Sm protein complex(GO:0034715) |
| 0.0 | 0.2 | GO:0032039 | integrator complex(GO:0032039) |
Gene overrepresentation in molecular_function category:
| Log-likelihood per target | Total log-likelihood | Term | Description |
|---|---|---|---|
| 0.5 | 1.5 | GO:0031731 | CCR6 chemokine receptor binding(GO:0031731) |
| 0.2 | 1.3 | GO:0035800 | deubiquitinase activator activity(GO:0035800) |
| 0.1 | 1.0 | GO:0070568 | guanylyltransferase activity(GO:0070568) |
| 0.1 | 0.5 | GO:0003986 | acetyl-CoA hydrolase activity(GO:0003986) |
| 0.1 | 0.6 | GO:0050115 | myosin-light-chain-phosphatase activity(GO:0050115) |
| 0.1 | 0.6 | GO:0080019 | fatty-acyl-CoA reductase (alcohol-forming) activity(GO:0080019) |
| 0.1 | 0.3 | GO:0070538 | oleic acid binding(GO:0070538) |
| 0.1 | 0.5 | GO:0016428 | tRNA (cytosine-5-)-methyltransferase activity(GO:0016428) |
| 0.1 | 0.2 | GO:0017082 | mineralocorticoid receptor activity(GO:0017082) |
| 0.1 | 0.5 | GO:0016724 | ferroxidase activity(GO:0004322) oxidoreductase activity, oxidizing metal ions, oxygen as acceptor(GO:0016724) |
| 0.1 | 0.4 | GO:0017159 | pantetheine hydrolase activity(GO:0017159) |
| 0.1 | 0.2 | GO:0030492 | hemoglobin binding(GO:0030492) |
| 0.1 | 0.3 | GO:0003829 | beta-1,3-galactosyl-O-glycosyl-glycoprotein beta-1,6-N-acetylglucosaminyltransferase activity(GO:0003829) |
| 0.1 | 0.3 | GO:0015018 | galactosylgalactosylxylosylprotein 3-beta-glucuronosyltransferase activity(GO:0015018) |
| 0.1 | 0.5 | GO:0004800 | thyroxine 5'-deiodinase activity(GO:0004800) |
| 0.1 | 0.2 | GO:0035379 | carbon dioxide transmembrane transporter activity(GO:0035379) |
| 0.1 | 1.5 | GO:0004535 | poly(A)-specific ribonuclease activity(GO:0004535) |
| 0.1 | 0.2 | GO:0004827 | glutamate-tRNA ligase activity(GO:0004818) proline-tRNA ligase activity(GO:0004827) |
| 0.1 | 0.4 | GO:0015057 | thrombin receptor activity(GO:0015057) |
| 0.0 | 0.1 | GO:0004060 | arylamine N-acetyltransferase activity(GO:0004060) |
| 0.0 | 0.7 | GO:0098599 | palmitoyl-(protein) hydrolase activity(GO:0008474) palmitoyl hydrolase activity(GO:0098599) |
| 0.0 | 0.2 | GO:0023024 | MHC class I protein complex binding(GO:0023024) |
| 0.0 | 0.3 | GO:0004504 | peptidylglycine monooxygenase activity(GO:0004504) peptidylamidoglycolate lyase activity(GO:0004598) |
| 0.0 | 0.3 | GO:0004833 | tryptophan 2,3-dioxygenase activity(GO:0004833) |
| 0.0 | 0.3 | GO:0010858 | calcium-dependent protein kinase regulator activity(GO:0010858) |
| 0.0 | 0.2 | GO:0004556 | alpha-amylase activity(GO:0004556) |
| 0.0 | 0.2 | GO:0015094 | cadmium ion transmembrane transporter activity(GO:0015086) cobalt ion transmembrane transporter activity(GO:0015087) lead ion transmembrane transporter activity(GO:0015094) ferrous iron uptake transmembrane transporter activity(GO:0015639) |
| 0.0 | 0.1 | GO:0004739 | pyruvate dehydrogenase (acetyl-transferring) activity(GO:0004739) |
| 0.0 | 1.2 | GO:0005388 | calcium-transporting ATPase activity(GO:0005388) |
| 0.0 | 0.1 | GO:0004082 | bisphosphoglycerate mutase activity(GO:0004082) phosphoglycerate mutase activity(GO:0004619) 2,3-bisphosphoglycerate-dependent phosphoglycerate mutase activity(GO:0046538) |
| 0.0 | 0.1 | GO:0051499 | D-aminoacyl-tRNA deacylase activity(GO:0051499) D-tyrosyl-tRNA(Tyr) deacylase activity(GO:0051500) |
| 0.0 | 0.7 | GO:0051400 | BH domain binding(GO:0051400) |
| 0.0 | 0.6 | GO:0004596 | peptide alpha-N-acetyltransferase activity(GO:0004596) |
| 0.0 | 0.2 | GO:0009019 | tRNA (guanine-N1-)-methyltransferase activity(GO:0009019) |
| 0.0 | 0.6 | GO:0043024 | ribosomal small subunit binding(GO:0043024) |
| 0.0 | 0.3 | GO:0004652 | polynucleotide adenylyltransferase activity(GO:0004652) |
| 0.0 | 0.9 | GO:0000030 | mannosyltransferase activity(GO:0000030) |
| 0.0 | 0.1 | GO:0047708 | biotinidase activity(GO:0047708) |
| 0.0 | 0.8 | GO:0017134 | fibroblast growth factor binding(GO:0017134) |
| 0.0 | 0.3 | GO:0046703 | natural killer cell lectin-like receptor binding(GO:0046703) |
| 0.0 | 0.5 | GO:1904264 | ubiquitin protein ligase activity involved in ERAD pathway(GO:1904264) |
| 0.0 | 0.3 | GO:0030911 | TPR domain binding(GO:0030911) |
| 0.0 | 2.1 | GO:0050840 | extracellular matrix binding(GO:0050840) |
| 0.0 | 0.2 | GO:0031419 | cobalamin binding(GO:0031419) |
| 0.0 | 0.2 | GO:0018479 | benzaldehyde dehydrogenase (NAD+) activity(GO:0018479) |
| 0.0 | 0.3 | GO:0005432 | calcium:sodium antiporter activity(GO:0005432) |
| 0.0 | 0.5 | GO:0008253 | 5'-nucleotidase activity(GO:0008253) |
| 0.0 | 0.2 | GO:0016909 | JUN kinase activity(GO:0004705) SAP kinase activity(GO:0016909) |
| 0.0 | 0.8 | GO:0015020 | glucuronosyltransferase activity(GO:0015020) |
| 0.0 | 0.0 | GO:0004145 | diamine N-acetyltransferase activity(GO:0004145) polyamine binding(GO:0019808) |
| 0.0 | 0.0 | GO:0004597 | peptide-aspartate beta-dioxygenase activity(GO:0004597) |
| 0.0 | 0.1 | GO:0016532 | superoxide dismutase copper chaperone activity(GO:0016532) copper-dependent protein binding(GO:0032767) |
| 0.0 | 0.6 | GO:0004709 | MAP kinase kinase kinase activity(GO:0004709) |
| 0.0 | 0.3 | GO:0030983 | mismatched DNA binding(GO:0030983) |
| 0.0 | 0.4 | GO:0004129 | cytochrome-c oxidase activity(GO:0004129) heme-copper terminal oxidase activity(GO:0015002) oxidoreductase activity, acting on a heme group of donors, oxygen as acceptor(GO:0016676) |
| 0.0 | 0.2 | GO:0001011 | transcription factor activity, sequence-specific DNA binding, RNA polymerase recruiting(GO:0001011) transcription factor activity, TFIIB-class binding(GO:0001087) |
| 0.0 | 0.1 | GO:0002114 | interleukin-33 receptor activity(GO:0002114) |
Gene overrepresentation in C2:CP category:
| Log-likelihood per target | Total log-likelihood | Term | Description |
|---|---|---|---|
| 0.0 | 1.1 | PID ARF 3PATHWAY | Arf1 pathway |
| 0.0 | 1.5 | NABA PROTEOGLYCANS | Genes encoding proteoglycans |
| 0.0 | 0.4 | PID THROMBIN PAR4 PATHWAY | PAR4-mediated thrombin signaling events |
| 0.0 | 0.7 | PID P38 MKK3 6PATHWAY | p38 MAPK signaling pathway |
Gene overrepresentation in C2:CP:REACTOME category:
| Log-likelihood per target | Total log-likelihood | Term | Description |
|---|---|---|---|
| 0.1 | 1.8 | REACTOME CS DS DEGRADATION | Genes involved in CS/DS degradation |
| 0.0 | 1.3 | REACTOME TRAF6 MEDIATED IRF7 ACTIVATION | Genes involved in TRAF6 mediated IRF7 activation |
| 0.0 | 0.6 | REACTOME AMINE DERIVED HORMONES | Genes involved in Amine-derived hormones |
| 0.0 | 0.5 | REACTOME PYRIMIDINE CATABOLISM | Genes involved in Pyrimidine catabolism |
| 0.0 | 1.5 | REACTOME DEADENYLATION OF MRNA | Genes involved in Deadenylation of mRNA |
| 0.0 | 1.4 | REACTOME CHEMOKINE RECEPTORS BIND CHEMOKINES | Genes involved in Chemokine receptors bind chemokines |
| 0.0 | 2.1 | REACTOME INTERFERON ALPHA BETA SIGNALING | Genes involved in Interferon alpha/beta signaling |
| 0.0 | 0.9 | REACTOME PEROXISOMAL LIPID METABOLISM | Genes involved in Peroxisomal lipid metabolism |
| 0.0 | 0.6 | REACTOME GLUCURONIDATION | Genes involved in Glucuronidation |
| 0.0 | 0.6 | REACTOME HORMONE SENSITIVE LIPASE HSL MEDIATED TRIACYLGLYCEROL HYDROLYSIS | Genes involved in Hormone-sensitive lipase (HSL)-mediated triacylglycerol hydrolysis |
| 0.0 | 0.7 | REACTOME PREFOLDIN MEDIATED TRANSFER OF SUBSTRATE TO CCT TRIC | Genes involved in Prefoldin mediated transfer of substrate to CCT/TriC |
| 0.0 | 0.3 | REACTOME TETRAHYDROBIOPTERIN BH4 SYNTHESIS RECYCLING SALVAGE AND REGULATION | Genes involved in Tetrahydrobiopterin (BH4) synthesis, recycling, salvage and regulation |
| 0.0 | 0.2 | REACTOME DIGESTION OF DIETARY CARBOHYDRATE | Genes involved in Digestion of dietary carbohydrate |
| 0.0 | 0.5 | REACTOME METAL ION SLC TRANSPORTERS | Genes involved in Metal ion SLC transporters |
| 0.0 | 0.3 | REACTOME TRYPTOPHAN CATABOLISM | Genes involved in Tryptophan catabolism |