Project
A549 cells infected with SARS-CoV-2 Analysis Results (GEO series: GSE147507)
Navigation
Downloads
Results for AAUACUG
Z-value: 1.65
Motif logo

miRNA associated with seed AAUACUG
| Name | miRBASE accession |
|---|---|
|
hsa-miR-200b-3p
|
MIMAT0000318 |
|
hsa-miR-200c-3p
|
MIMAT0000617 |
|
hsa-miR-429
|
MIMAT0001536 |
Activity profile of AAUACUG motif
Sorted Z-values of AAUACUG motif
| Promoter | Log-likelihood | Transcript | Gene | Gene Info |
|---|---|---|---|---|
| chr17_-_53499310 | 1.42 |
ENST00000262065.3
|
MMD
|
monocyte to macrophage differentiation-associated |
| chr20_+_10199468 | 1.19 |
ENST00000254976.2
ENST00000304886.2 |
SNAP25
|
synaptosomal-associated protein, 25kDa |
| chr12_-_46766577 | 1.08 |
ENST00000256689.5
|
SLC38A2
|
solute carrier family 38, member 2 |
| chr20_+_52824367 | 1.08 |
ENST00000371419.2
|
PFDN4
|
prefoldin subunit 4 |
| chr1_+_25071848 | 1.03 |
ENST00000374379.4
|
CLIC4
|
chloride intracellular channel 4 |
| chr20_-_23402028 | 1.02 |
ENST00000398425.3
ENST00000432543.2 ENST00000377026.4 |
NAPB
|
N-ethylmaleimide-sensitive factor attachment protein, beta |
| chr3_-_182698381 | 1.02 |
ENST00000292782.4
|
DCUN1D1
|
DCN1, defective in cullin neddylation 1, domain containing 1 |
| chr4_+_95129061 | 0.97 |
ENST00000354268.4
|
SMARCAD1
|
SWI/SNF-related, matrix-associated actin-dependent regulator of chromatin, subfamily a, containing DEAD/H box 1 |
| chr14_+_62229075 | 0.87 |
ENST00000216294.4
|
SNAPC1
|
small nuclear RNA activating complex, polypeptide 1, 43kDa |
| chr2_-_36825281 | 0.86 |
ENST00000405912.3
ENST00000379245.4 |
FEZ2
|
fasciculation and elongation protein zeta 2 (zygin II) |
| chr1_+_26438289 | 0.84 |
ENST00000374271.4
ENST00000374269.1 |
PDIK1L
|
PDLIM1 interacting kinase 1 like |
| chr5_+_138678131 | 0.84 |
ENST00000394795.2
ENST00000510080.1 |
PAIP2
|
poly(A) binding protein interacting protein 2 |
| chr15_-_49447835 | 0.84 |
ENST00000388901.5
ENST00000299259.6 |
COPS2
|
COP9 signalosome subunit 2 |
| chr15_+_44719394 | 0.83 |
ENST00000260327.4
ENST00000396780.1 |
CTDSPL2
|
CTD (carboxy-terminal domain, RNA polymerase II, polypeptide A) small phosphatase like 2 |
| chr6_+_87865262 | 0.81 |
ENST00000369577.3
ENST00000518845.1 ENST00000339907.4 ENST00000496806.2 |
ZNF292
|
zinc finger protein 292 |
| chr6_+_126112001 | 0.74 |
ENST00000392477.2
|
NCOA7
|
nuclear receptor coactivator 7 |
| chr6_+_119215308 | 0.72 |
ENST00000229595.5
|
ASF1A
|
anti-silencing function 1A histone chaperone |
| chr10_+_27793197 | 0.71 |
ENST00000356940.6
ENST00000535776.1 |
RAB18
|
RAB18, member RAS oncogene family |
| chr9_+_36036430 | 0.69 |
ENST00000377966.3
|
RECK
|
reversion-inducing-cysteine-rich protein with kazal motifs |
| chr8_+_107670064 | 0.68 |
ENST00000312046.6
|
OXR1
|
oxidation resistance 1 |
| chr12_+_79258547 | 0.67 |
ENST00000457153.2
|
SYT1
|
synaptotagmin I |
| chr12_+_69004619 | 0.67 |
ENST00000250559.9
ENST00000393436.5 ENST00000425247.2 ENST00000489473.2 ENST00000422358.2 ENST00000541167.1 ENST00000538283.1 ENST00000341355.5 ENST00000537460.1 ENST00000450214.2 ENST00000545270.1 ENST00000538980.1 ENST00000542018.1 ENST00000543393.1 |
RAP1B
|
RAP1B, member of RAS oncogene family |
| chr8_-_130951940 | 0.66 |
ENST00000522250.1
ENST00000522941.1 ENST00000522746.1 ENST00000520204.1 ENST00000519070.1 ENST00000520254.1 ENST00000519824.2 ENST00000519540.1 |
FAM49B
|
family with sequence similarity 49, member B |
| chr2_-_9143786 | 0.65 |
ENST00000462696.1
ENST00000305997.3 |
MBOAT2
|
membrane bound O-acyltransferase domain containing 2 |
| chr3_+_44379944 | 0.65 |
ENST00000396078.3
ENST00000342649.4 |
TCAIM
|
T cell activation inhibitor, mitochondrial |
| chr14_-_34931458 | 0.65 |
ENST00000298130.4
|
SPTSSA
|
serine palmitoyltransferase, small subunit A |
| chr10_-_88281494 | 0.64 |
ENST00000298767.5
|
WAPAL
|
wings apart-like homolog (Drosophila) |
| chr10_+_111767720 | 0.63 |
ENST00000356080.4
ENST00000277900.8 |
ADD3
|
adducin 3 (gamma) |
| chr9_-_80646374 | 0.63 |
ENST00000286548.4
|
GNAQ
|
guanine nucleotide binding protein (G protein), q polypeptide |
| chr10_-_5855350 | 0.63 |
ENST00000456041.1
ENST00000380181.3 ENST00000418688.1 ENST00000380132.4 ENST00000609712.1 ENST00000380191.4 |
GDI2
|
GDP dissociation inhibitor 2 |
| chr14_+_67826709 | 0.62 |
ENST00000256383.4
|
EIF2S1
|
eukaryotic translation initiation factor 2, subunit 1 alpha, 35kDa |
| chr2_+_99953816 | 0.62 |
ENST00000289371.6
|
EIF5B
|
eukaryotic translation initiation factor 5B |
| chr3_+_141205852 | 0.62 |
ENST00000286364.3
ENST00000452898.1 |
RASA2
|
RAS p21 protein activator 2 |
| chr5_+_77656339 | 0.61 |
ENST00000538629.1
|
SCAMP1
|
secretory carrier membrane protein 1 |
| chr13_+_96329381 | 0.61 |
ENST00000602402.1
ENST00000376795.6 |
DNAJC3
|
DnaJ (Hsp40) homolog, subfamily C, member 3 |
| chr6_-_122792919 | 0.61 |
ENST00000339697.4
|
SERINC1
|
serine incorporator 1 |
| chr17_+_30264014 | 0.59 |
ENST00000322652.5
ENST00000580398.1 |
SUZ12
|
SUZ12 polycomb repressive complex 2 subunit |
| chr10_+_22610124 | 0.59 |
ENST00000376663.3
|
BMI1
|
BMI1 polycomb ring finger oncogene |
| chr12_+_64845660 | 0.59 |
ENST00000331710.5
|
TBK1
|
TANK-binding kinase 1 |
| chr5_-_40755987 | 0.59 |
ENST00000337702.4
|
TTC33
|
tetratricopeptide repeat domain 33 |
| chr1_+_178694300 | 0.59 |
ENST00000367635.3
|
RALGPS2
|
Ral GEF with PH domain and SH3 binding motif 2 |
| chr15_+_63481668 | 0.58 |
ENST00000321437.4
ENST00000559006.1 ENST00000448330.2 |
RAB8B
|
RAB8B, member RAS oncogene family |
| chr17_-_45266542 | 0.57 |
ENST00000531206.1
ENST00000527547.1 ENST00000446365.2 ENST00000575483.1 ENST00000066544.3 |
CDC27
|
cell division cycle 27 |
| chr13_+_33160553 | 0.57 |
ENST00000315596.10
|
PDS5B
|
PDS5, regulator of cohesion maintenance, homolog B (S. cerevisiae) |
| chr7_+_36429409 | 0.57 |
ENST00000265748.2
|
ANLN
|
anillin, actin binding protein |
| chr1_+_35734562 | 0.56 |
ENST00000314607.6
ENST00000373297.2 |
ZMYM4
|
zinc finger, MYM-type 4 |
| chr13_-_30881621 | 0.56 |
ENST00000380615.3
|
KATNAL1
|
katanin p60 subunit A-like 1 |
| chr4_-_140098339 | 0.55 |
ENST00000394235.2
|
ELF2
|
E74-like factor 2 (ets domain transcription factor) |
| chr2_-_100106419 | 0.55 |
ENST00000393445.3
ENST00000258428.3 |
REV1
|
REV1, polymerase (DNA directed) |
| chr4_-_68566832 | 0.55 |
ENST00000420827.2
ENST00000322244.5 |
UBA6
|
ubiquitin-like modifier activating enzyme 6 |
| chr8_-_74791051 | 0.54 |
ENST00000453587.2
ENST00000602969.1 ENST00000602593.1 ENST00000419880.3 ENST00000517608.1 |
UBE2W
|
ubiquitin-conjugating enzyme E2W (putative) |
| chr2_+_187350883 | 0.54 |
ENST00000337859.6
|
ZC3H15
|
zinc finger CCCH-type containing 15 |
| chrX_-_131352152 | 0.54 |
ENST00000342983.2
|
RAP2C
|
RAP2C, member of RAS oncogene family |
| chr1_+_199996702 | 0.53 |
ENST00000367362.3
|
NR5A2
|
nuclear receptor subfamily 5, group A, member 2 |
| chrX_+_134654540 | 0.53 |
ENST00000370752.4
|
DDX26B
|
DEAD/H (Asp-Glu-Ala-Asp/His) box polypeptide 26B |
| chr17_+_30469473 | 0.53 |
ENST00000333942.6
ENST00000358365.3 ENST00000583994.1 ENST00000545287.2 |
RHOT1
|
ras homolog family member T1 |
| chr5_-_90679145 | 0.52 |
ENST00000265138.3
|
ARRDC3
|
arrestin domain containing 3 |
| chr4_+_90033968 | 0.51 |
ENST00000317005.2
|
TIGD2
|
tigger transposable element derived 2 |
| chr21_-_16437255 | 0.51 |
ENST00000400199.1
ENST00000400202.1 |
NRIP1
|
nuclear receptor interacting protein 1 |
| chr7_+_94139105 | 0.50 |
ENST00000297273.4
|
CASD1
|
CAS1 domain containing 1 |
| chr17_-_48943706 | 0.49 |
ENST00000499247.2
|
TOB1
|
transducer of ERBB2, 1 |
| chr21_+_17102311 | 0.49 |
ENST00000285679.6
ENST00000351097.5 ENST00000285681.2 ENST00000400183.2 |
USP25
|
ubiquitin specific peptidase 25 |
| chr1_+_93544791 | 0.49 |
ENST00000545708.1
ENST00000540243.1 ENST00000370298.4 |
MTF2
|
metal response element binding transcription factor 2 |
| chr14_+_36295504 | 0.49 |
ENST00000216807.7
|
BRMS1L
|
breast cancer metastasis-suppressor 1-like |
| chr12_+_8850471 | 0.49 |
ENST00000535829.1
ENST00000357529.3 |
RIMKLB
|
ribosomal modification protein rimK-like family member B |
| chr1_+_60280458 | 0.48 |
ENST00000455990.1
ENST00000371208.3 |
HOOK1
|
hook microtubule-tethering protein 1 |
| chr3_-_120170052 | 0.48 |
ENST00000295633.3
|
FSTL1
|
follistatin-like 1 |
| chr12_+_72148614 | 0.48 |
ENST00000261263.3
|
RAB21
|
RAB21, member RAS oncogene family |
| chr12_-_123011536 | 0.48 |
ENST00000331738.7
ENST00000354654.2 |
RSRC2
|
arginine/serine-rich coiled-coil 2 |
| chr2_-_152684977 | 0.47 |
ENST00000428992.2
ENST00000295087.8 |
ARL5A
|
ADP-ribosylation factor-like 5A |
| chr14_+_59951161 | 0.47 |
ENST00000261247.9
ENST00000425728.2 ENST00000556985.1 ENST00000554271.1 ENST00000554795.1 |
JKAMP
|
JNK1/MAPK8-associated membrane protein |
| chr3_-_128212016 | 0.47 |
ENST00000498200.1
ENST00000341105.2 |
GATA2
|
GATA binding protein 2 |
| chr20_+_31407692 | 0.46 |
ENST00000375571.5
|
MAPRE1
|
microtubule-associated protein, RP/EB family, member 1 |
| chr4_+_141294628 | 0.46 |
ENST00000512749.1
ENST00000608372.1 ENST00000506597.1 ENST00000394201.4 ENST00000510586.1 |
SCOC
|
short coiled-coil protein |
| chr21_-_15755446 | 0.45 |
ENST00000544452.1
ENST00000285667.3 |
HSPA13
|
heat shock protein 70kDa family, member 13 |
| chr8_-_103668114 | 0.45 |
ENST00000285407.6
|
KLF10
|
Kruppel-like factor 10 |
| chr1_+_40627038 | 0.45 |
ENST00000372771.4
|
RLF
|
rearranged L-myc fusion |
| chr4_+_40058411 | 0.44 |
ENST00000261435.6
ENST00000515550.1 |
N4BP2
|
NEDD4 binding protein 2 |
| chr10_+_105726862 | 0.44 |
ENST00000335753.4
ENST00000369755.3 |
SLK
|
STE20-like kinase |
| chr3_-_176914238 | 0.44 |
ENST00000430069.1
ENST00000428970.1 |
TBL1XR1
|
transducin (beta)-like 1 X-linked receptor 1 |
| chr9_+_33817461 | 0.44 |
ENST00000263228.3
|
UBE2R2
|
ubiquitin-conjugating enzyme E2R 2 |
| chr1_-_28969517 | 0.44 |
ENST00000263974.4
ENST00000373824.4 |
TAF12
|
TAF12 RNA polymerase II, TATA box binding protein (TBP)-associated factor, 20kDa |
| chr3_+_73045936 | 0.43 |
ENST00000356692.5
ENST00000488810.1 ENST00000394284.3 ENST00000295862.9 ENST00000495566.1 |
PPP4R2
|
protein phosphatase 4, regulatory subunit 2 |
| chr4_+_113066552 | 0.43 |
ENST00000309733.5
|
C4orf32
|
chromosome 4 open reading frame 32 |
| chr13_+_53226963 | 0.43 |
ENST00000343788.6
ENST00000535397.1 ENST00000310528.8 |
SUGT1
|
SGT1, suppressor of G2 allele of SKP1 (S. cerevisiae) |
| chr1_-_207224307 | 0.43 |
ENST00000315927.4
|
YOD1
|
YOD1 deubiquitinase |
| chr8_+_90769967 | 0.43 |
ENST00000220751.4
|
RIPK2
|
receptor-interacting serine-threonine kinase 2 |
| chr2_-_38604398 | 0.43 |
ENST00000443098.1
ENST00000449130.1 ENST00000378954.4 ENST00000539122.1 ENST00000419554.2 ENST00000451483.1 ENST00000406122.1 |
ATL2
|
atlastin GTPase 2 |
| chr11_+_120894781 | 0.42 |
ENST00000529397.1
ENST00000528512.1 ENST00000422003.2 |
TBCEL
|
tubulin folding cofactor E-like |
| chr9_+_33265011 | 0.42 |
ENST00000419016.2
|
CHMP5
|
charged multivesicular body protein 5 |
| chr3_-_27498235 | 0.42 |
ENST00000295736.5
ENST00000428386.1 ENST00000428179.1 |
SLC4A7
|
solute carrier family 4, sodium bicarbonate cotransporter, member 7 |
| chr14_-_35182994 | 0.42 |
ENST00000341223.3
|
CFL2
|
cofilin 2 (muscle) |
| chr14_+_57735614 | 0.42 |
ENST00000261558.3
|
AP5M1
|
adaptor-related protein complex 5, mu 1 subunit |
| chr2_-_11484710 | 0.42 |
ENST00000315872.6
|
ROCK2
|
Rho-associated, coiled-coil containing protein kinase 2 |
| chr13_+_48807288 | 0.41 |
ENST00000378565.5
|
ITM2B
|
integral membrane protein 2B |
| chr1_+_87380299 | 0.41 |
ENST00000370551.4
ENST00000370550.5 |
HS2ST1
|
heparan sulfate 2-O-sulfotransferase 1 |
| chr12_+_104458235 | 0.41 |
ENST00000229330.4
|
HCFC2
|
host cell factor C2 |
| chr12_+_97300995 | 0.41 |
ENST00000266742.4
ENST00000429527.2 ENST00000554226.1 ENST00000557478.1 ENST00000557092.1 ENST00000411739.2 ENST00000553609.1 |
NEDD1
|
neural precursor cell expressed, developmentally down-regulated 1 |
| chr18_-_45456930 | 0.41 |
ENST00000262160.6
ENST00000587269.1 |
SMAD2
|
SMAD family member 2 |
| chr2_+_210444142 | 0.40 |
ENST00000360351.4
ENST00000361559.4 |
MAP2
|
microtubule-associated protein 2 |
| chr17_-_62658186 | 0.40 |
ENST00000262435.9
|
SMURF2
|
SMAD specific E3 ubiquitin protein ligase 2 |
| chr18_+_67956135 | 0.39 |
ENST00000397942.3
|
SOCS6
|
suppressor of cytokine signaling 6 |
| chr5_-_98262240 | 0.39 |
ENST00000284049.3
|
CHD1
|
chromodomain helicase DNA binding protein 1 |
| chrX_+_41192595 | 0.39 |
ENST00000399959.2
|
DDX3X
|
DEAD (Asp-Glu-Ala-Asp) box helicase 3, X-linked |
| chr2_+_169312350 | 0.39 |
ENST00000305747.6
|
CERS6
|
ceramide synthase 6 |
| chr2_-_39664405 | 0.39 |
ENST00000341681.5
ENST00000263881.3 |
MAP4K3
|
mitogen-activated protein kinase kinase kinase kinase 3 |
| chr1_-_225615599 | 0.37 |
ENST00000421383.1
ENST00000272163.4 |
LBR
|
lamin B receptor |
| chr8_-_74884511 | 0.37 |
ENST00000518127.1
|
TCEB1
|
transcription elongation factor B (SIII), polypeptide 1 (15kDa, elongin C) |
| chr14_-_64010046 | 0.37 |
ENST00000337537.3
|
PPP2R5E
|
protein phosphatase 2, regulatory subunit B', epsilon isoform |
| chr10_+_31608054 | 0.36 |
ENST00000320985.10
ENST00000361642.5 ENST00000560721.2 ENST00000558440.1 ENST00000424869.1 ENST00000542815.3 |
ZEB1
|
zinc finger E-box binding homeobox 1 |
| chr2_+_114647504 | 0.36 |
ENST00000263238.2
|
ACTR3
|
ARP3 actin-related protein 3 homolog (yeast) |
| chr14_+_53196872 | 0.36 |
ENST00000442123.2
ENST00000354586.4 |
STYX
|
serine/threonine/tyrosine interacting protein |
| chr6_+_17600576 | 0.36 |
ENST00000259963.3
|
FAM8A1
|
family with sequence similarity 8, member A1 |
| chr13_+_28813645 | 0.36 |
ENST00000282391.5
|
PAN3
|
PAN3 poly(A) specific ribonuclease subunit homolog (S. cerevisiae) |
| chrX_+_49644470 | 0.35 |
ENST00000508866.2
|
USP27X
|
ubiquitin specific peptidase 27, X-linked |
| chr7_-_35077653 | 0.35 |
ENST00000310974.4
|
DPY19L1
|
dpy-19-like 1 (C. elegans) |
| chr10_-_119806085 | 0.35 |
ENST00000355624.3
|
RAB11FIP2
|
RAB11 family interacting protein 2 (class I) |
| chr10_-_27443155 | 0.34 |
ENST00000427324.1
ENST00000326799.3 |
YME1L1
|
YME1-like 1 ATPase |
| chr6_-_31869769 | 0.34 |
ENST00000375527.2
|
ZBTB12
|
zinc finger and BTB domain containing 12 |
| chr12_-_29534074 | 0.34 |
ENST00000546839.1
ENST00000360150.4 ENST00000552155.1 ENST00000550353.1 ENST00000548441.1 ENST00000552132.1 |
ERGIC2
|
ERGIC and golgi 2 |
| chr8_-_42698433 | 0.34 |
ENST00000345117.2
ENST00000254250.3 |
THAP1
|
THAP domain containing, apoptosis associated protein 1 |
| chr5_+_133706865 | 0.33 |
ENST00000265339.2
|
UBE2B
|
ubiquitin-conjugating enzyme E2B |
| chr5_-_111093406 | 0.33 |
ENST00000379671.3
|
NREP
|
neuronal regeneration related protein |
| chr22_+_29168652 | 0.33 |
ENST00000249064.4
ENST00000444523.1 ENST00000448492.2 ENST00000421503.2 |
CCDC117
|
coiled-coil domain containing 117 |
| chr12_-_31479045 | 0.33 |
ENST00000539409.1
ENST00000395766.1 |
FAM60A
|
family with sequence similarity 60, member A |
| chr2_-_47168906 | 0.33 |
ENST00000444761.2
ENST00000409147.1 |
MCFD2
|
multiple coagulation factor deficiency 2 |
| chr1_+_110091189 | 0.33 |
ENST00000369851.4
|
GNAI3
|
guanine nucleotide binding protein (G protein), alpha inhibiting activity polypeptide 3 |
| chr8_-_17104356 | 0.32 |
ENST00000361272.4
ENST00000523917.1 |
CNOT7
|
CCR4-NOT transcription complex, subunit 7 |
| chr21_-_40685477 | 0.32 |
ENST00000342449.3
|
BRWD1
|
bromodomain and WD repeat domain containing 1 |
| chr7_+_77166592 | 0.32 |
ENST00000248594.6
|
PTPN12
|
protein tyrosine phosphatase, non-receptor type 12 |
| chr7_-_19748640 | 0.32 |
ENST00000222567.5
|
TWISTNB
|
TWIST neighbor |
| chr2_-_164592497 | 0.32 |
ENST00000333129.3
ENST00000409634.1 |
FIGN
|
fidgetin |
| chr9_+_2621798 | 0.32 |
ENST00000382100.3
|
VLDLR
|
very low density lipoprotein receptor |
| chr4_-_100867864 | 0.31 |
ENST00000442697.2
|
DNAJB14
|
DnaJ (Hsp40) homolog, subfamily B, member 14 |
| chr17_+_54671047 | 0.31 |
ENST00000332822.4
|
NOG
|
noggin |
| chr2_-_151344172 | 0.31 |
ENST00000375734.2
ENST00000263895.4 ENST00000454202.1 |
RND3
|
Rho family GTPase 3 |
| chr3_-_154042235 | 0.31 |
ENST00000308361.6
ENST00000496811.1 ENST00000544526.1 |
DHX36
|
DEAH (Asp-Glu-Ala-His) box polypeptide 36 |
| chrX_+_150151752 | 0.31 |
ENST00000325307.7
|
HMGB3
|
high mobility group box 3 |
| chr18_+_43304092 | 0.30 |
ENST00000321925.4
ENST00000587601.1 |
SLC14A1
|
solute carrier family 14 (urea transporter), member 1 (Kidd blood group) |
| chr2_+_208576355 | 0.30 |
ENST00000420822.1
ENST00000295414.3 ENST00000339882.5 |
CCNYL1
|
cyclin Y-like 1 |
| chrX_-_20284958 | 0.30 |
ENST00000379565.3
|
RPS6KA3
|
ribosomal protein S6 kinase, 90kDa, polypeptide 3 |
| chr3_+_101292939 | 0.30 |
ENST00000265260.3
ENST00000469941.1 ENST00000296024.5 |
PCNP
|
PEST proteolytic signal containing nuclear protein |
| chr9_-_113800317 | 0.30 |
ENST00000374431.3
|
LPAR1
|
lysophosphatidic acid receptor 1 |
| chr17_-_72919317 | 0.30 |
ENST00000319642.1
|
USH1G
|
Usher syndrome 1G (autosomal recessive) |
| chr8_+_95835438 | 0.30 |
ENST00000521860.1
ENST00000519457.1 ENST00000519053.1 ENST00000523731.1 ENST00000447247.1 |
INTS8
|
integrator complex subunit 8 |
| chrY_+_15016725 | 0.29 |
ENST00000336079.3
|
DDX3Y
|
DEAD (Asp-Glu-Ala-Asp) box helicase 3, Y-linked |
| chr6_+_64281906 | 0.29 |
ENST00000370651.3
|
PTP4A1
|
protein tyrosine phosphatase type IVA, member 1 |
| chr7_+_100081542 | 0.29 |
ENST00000300179.2
ENST00000423930.1 |
NYAP1
|
neuronal tyrosine-phosphorylated phosphoinositide-3-kinase adaptor 1 |
| chr6_+_41040678 | 0.29 |
ENST00000341376.6
ENST00000353205.5 |
NFYA
|
nuclear transcription factor Y, alpha |
| chr20_-_52210368 | 0.29 |
ENST00000371471.2
|
ZNF217
|
zinc finger protein 217 |
| chr6_-_13711773 | 0.29 |
ENST00000011619.3
|
RANBP9
|
RAN binding protein 9 |
| chr3_-_71774516 | 0.29 |
ENST00000425534.3
|
EIF4E3
|
eukaryotic translation initiation factor 4E family member 3 |
| chr3_-_129407535 | 0.29 |
ENST00000432054.2
|
TMCC1
|
transmembrane and coiled-coil domain family 1 |
| chr4_+_41937131 | 0.28 |
ENST00000504986.1
ENST00000508448.1 ENST00000513702.1 ENST00000325094.5 |
TMEM33
|
transmembrane protein 33 |
| chr9_+_112810878 | 0.28 |
ENST00000434623.2
ENST00000374525.1 |
AKAP2
|
A kinase (PRKA) anchor protein 2 |
| chr3_-_69435224 | 0.28 |
ENST00000398540.3
|
FRMD4B
|
FERM domain containing 4B |
| chr16_-_65155833 | 0.28 |
ENST00000566827.1
ENST00000394156.3 ENST00000562998.1 |
CDH11
|
cadherin 11, type 2, OB-cadherin (osteoblast) |
| chr5_-_57756087 | 0.27 |
ENST00000274289.3
|
PLK2
|
polo-like kinase 2 |
| chr8_-_122653630 | 0.27 |
ENST00000303924.4
|
HAS2
|
hyaluronan synthase 2 |
| chr2_+_61108650 | 0.27 |
ENST00000295025.8
|
REL
|
v-rel avian reticuloendotheliosis viral oncogene homolog |
| chr4_-_99851766 | 0.27 |
ENST00000450253.2
|
EIF4E
|
eukaryotic translation initiation factor 4E |
| chr1_+_52521928 | 0.27 |
ENST00000489308.2
|
BTF3L4
|
basic transcription factor 3-like 4 |
| chr3_+_180630090 | 0.27 |
ENST00000357559.4
ENST00000305586.7 |
FXR1
|
fragile X mental retardation, autosomal homolog 1 |
| chr21_+_35445827 | 0.27 |
ENST00000608209.1
ENST00000381151.3 |
SLC5A3
SLC5A3
|
sodium/myo-inositol cotransporter solute carrier family 5 (sodium/myo-inositol cotransporter), member 3 |
| chr13_-_36920420 | 0.27 |
ENST00000438666.2
|
SPG20
|
spastic paraplegia 20 (Troyer syndrome) |
| chr2_+_32288725 | 0.26 |
ENST00000315285.3
|
SPAST
|
spastin |
| chr6_-_146135880 | 0.26 |
ENST00000237281.4
|
FBXO30
|
F-box protein 30 |
| chr5_+_174905398 | 0.26 |
ENST00000321442.5
|
SFXN1
|
sideroflexin 1 |
| chr17_-_71640227 | 0.26 |
ENST00000388726.3
ENST00000392650.3 |
SDK2
|
sidekick cell adhesion molecule 2 |
| chr16_+_9185450 | 0.26 |
ENST00000327827.7
|
C16orf72
|
chromosome 16 open reading frame 72 |
| chrX_+_9754461 | 0.26 |
ENST00000380913.3
|
SHROOM2
|
shroom family member 2 |
| chr11_+_111807863 | 0.25 |
ENST00000440460.2
|
DIXDC1
|
DIX domain containing 1 |
| chr9_-_15510989 | 0.25 |
ENST00000380715.1
ENST00000380716.4 ENST00000380738.4 ENST00000380733.4 |
PSIP1
|
PC4 and SFRS1 interacting protein 1 |
| chr8_-_67579418 | 0.25 |
ENST00000310421.4
|
VCPIP1
|
valosin containing protein (p97)/p47 complex interacting protein 1 |
| chr17_+_57274914 | 0.25 |
ENST00000582004.1
ENST00000577660.1 |
PRR11
CTD-2510F5.6
|
proline rich 11 Uncharacterized protein |
| chr17_-_63052929 | 0.25 |
ENST00000439174.2
|
GNA13
|
guanine nucleotide binding protein (G protein), alpha 13 |
| chr14_+_71374122 | 0.25 |
ENST00000304743.2
ENST00000238570.5 |
PCNX
|
pecanex homolog (Drosophila) |
| chr3_-_33686743 | 0.25 |
ENST00000333778.6
ENST00000539981.1 |
CLASP2
|
cytoplasmic linker associated protein 2 |
| chr1_+_185014496 | 0.25 |
ENST00000367510.3
|
RNF2
|
ring finger protein 2 |
| chrX_+_114827818 | 0.24 |
ENST00000420625.2
|
PLS3
|
plastin 3 |
| chr12_-_96794143 | 0.24 |
ENST00000543119.2
|
CDK17
|
cyclin-dependent kinase 17 |
| chr10_+_98592009 | 0.24 |
ENST00000540664.1
ENST00000371103.3 |
LCOR
|
ligand dependent nuclear receptor corepressor |
| chr5_-_41510656 | 0.24 |
ENST00000377801.3
|
PLCXD3
|
phosphatidylinositol-specific phospholipase C, X domain containing 3 |
| chr2_+_183989083 | 0.24 |
ENST00000295119.4
|
NUP35
|
nucleoporin 35kDa |
| chr14_-_73925225 | 0.24 |
ENST00000356296.4
ENST00000355058.3 ENST00000359560.3 ENST00000557597.1 ENST00000554394.1 ENST00000555238.1 ENST00000535282.1 ENST00000555987.1 ENST00000555394.1 ENST00000554546.1 |
NUMB
|
numb homolog (Drosophila) |
| chr1_+_193091080 | 0.24 |
ENST00000367435.3
|
CDC73
|
cell division cycle 73 |
| chr13_+_93879085 | 0.24 |
ENST00000377047.4
|
GPC6
|
glypican 6 |
| chr14_-_67982146 | 0.24 |
ENST00000557779.1
ENST00000557006.1 |
TMEM229B
|
transmembrane protein 229B |
| chr8_+_8860314 | 0.24 |
ENST00000250263.7
ENST00000519292.1 |
ERI1
|
exoribonuclease 1 |
| chr12_-_15942309 | 0.24 |
ENST00000544064.1
ENST00000543523.1 ENST00000536793.1 |
EPS8
|
epidermal growth factor receptor pathway substrate 8 |
| chr8_-_52811640 | 0.24 |
ENST00000360540.5
ENST00000521344.1 |
PCMTD1
|
protein-L-isoaspartate (D-aspartate) O-methyltransferase domain containing 1 |
| chrX_+_16804544 | 0.24 |
ENST00000380122.5
ENST00000398155.4 |
TXLNG
|
taxilin gamma |
| chr2_-_24149977 | 0.23 |
ENST00000238789.5
|
ATAD2B
|
ATPase family, AAA domain containing 2B |
| chr12_-_25403737 | 0.23 |
ENST00000256078.4
ENST00000556131.1 ENST00000311936.3 ENST00000557334.1 |
KRAS
|
Kirsten rat sarcoma viral oncogene homolog |
| chr2_+_60983361 | 0.23 |
ENST00000238714.3
|
PAPOLG
|
poly(A) polymerase gamma |
| chr7_-_94285511 | 0.23 |
ENST00000265735.7
|
SGCE
|
sarcoglycan, epsilon |
| chr3_-_138553594 | 0.23 |
ENST00000477593.1
ENST00000483968.1 |
PIK3CB
|
phosphatidylinositol-4,5-bisphosphate 3-kinase, catalytic subunit beta |
| chr5_+_56205081 | 0.23 |
ENST00000285947.2
ENST00000541720.1 |
SETD9
|
SET domain containing 9 |
| chr5_-_171433819 | 0.23 |
ENST00000296933.6
|
FBXW11
|
F-box and WD repeat domain containing 11 |
| chr5_-_137911049 | 0.23 |
ENST00000297185.3
|
HSPA9
|
heat shock 70kDa protein 9 (mortalin) |
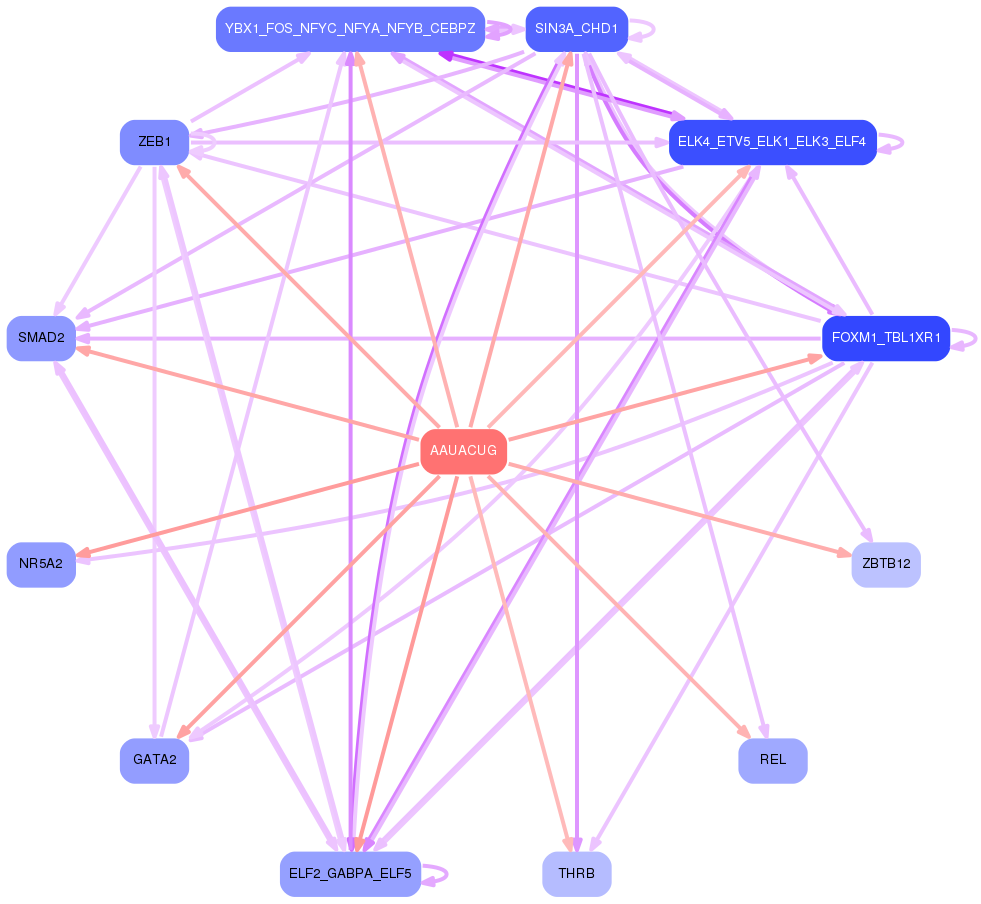
Network of associatons between targets according to the STRING database.

First level regulatory network of AAUACUG
Gene Ontology Analysis
Gene overrepresentation in biological_process category:
| Log-likelihood per target | Total log-likelihood | Term | Description |
|---|---|---|---|
| 0.3 | 1.2 | GO:1990926 | short-term synaptic potentiation(GO:1990926) |
| 0.2 | 0.9 | GO:0042796 | snRNA transcription from RNA polymerase III promoter(GO:0042796) |
| 0.2 | 0.2 | GO:0021896 | forebrain astrocyte differentiation(GO:0021896) forebrain astrocyte development(GO:0021897) |
| 0.2 | 0.6 | GO:0031106 | septin ring assembly(GO:0000921) septin ring organization(GO:0031106) |
| 0.2 | 0.2 | GO:0046619 | optic placode formation involved in camera-type eye formation(GO:0046619) |
| 0.2 | 0.5 | GO:0071879 | positive regulation of adrenergic receptor signaling pathway(GO:0071879) |
| 0.2 | 0.5 | GO:0001543 | ovarian follicle rupture(GO:0001543) |
| 0.2 | 0.6 | GO:1990737 | response to manganese-induced endoplasmic reticulum stress(GO:1990737) |
| 0.2 | 0.5 | GO:0010725 | regulation of primitive erythrocyte differentiation(GO:0010725) eosinophil fate commitment(GO:0035854) |
| 0.2 | 0.5 | GO:1903031 | regulation of microtubule plus-end binding(GO:1903031) positive regulation of microtubule plus-end binding(GO:1903033) |
| 0.1 | 0.4 | GO:0060300 | regulation of cytokine activity(GO:0060300) |
| 0.1 | 1.0 | GO:0035494 | SNARE complex disassembly(GO:0035494) |
| 0.1 | 0.7 | GO:0098746 | fast, calcium ion-dependent exocytosis of neurotransmitter(GO:0098746) |
| 0.1 | 0.3 | GO:0010845 | positive regulation of reciprocal meiotic recombination(GO:0010845) |
| 0.1 | 0.4 | GO:1990167 | protein K27-linked deubiquitination(GO:1990167) protein K33-linked deubiquitination(GO:1990168) |
| 0.1 | 1.2 | GO:0061299 | retina vasculature morphogenesis in camera-type eye(GO:0061299) |
| 0.1 | 0.2 | GO:0015917 | aminophospholipid transport(GO:0015917) |
| 0.1 | 0.6 | GO:0070417 | positive regulation of translational initiation in response to stress(GO:0032058) positive regulation of translation in response to endoplasmic reticulum stress(GO:0036493) cellular response to cold(GO:0070417) |
| 0.1 | 0.6 | GO:1904222 | regulation of CDP-diacylglycerol-serine O-phosphatidyltransferase activity(GO:1904217) positive regulation of CDP-diacylglycerol-serine O-phosphatidyltransferase activity(GO:1904219) positive regulation of serine C-palmitoyltransferase activity(GO:1904222) |
| 0.1 | 0.3 | GO:1903371 | regulation of endoplasmic reticulum tubular network organization(GO:1903371) |
| 0.1 | 0.7 | GO:2000567 | memory T cell activation(GO:0035709) regulation of memory T cell activation(GO:2000567) positive regulation of memory T cell activation(GO:2000568) |
| 0.1 | 0.5 | GO:0021764 | amygdala development(GO:0021764) |
| 0.1 | 0.3 | GO:0008057 | eye pigment granule organization(GO:0008057) |
| 0.1 | 0.4 | GO:0071224 | positive regulation of immature T cell proliferation(GO:0033091) cellular response to peptidoglycan(GO:0071224) |
| 0.1 | 0.8 | GO:0051013 | microtubule severing(GO:0051013) |
| 0.1 | 0.4 | GO:1900224 | positive regulation of nodal signaling pathway involved in determination of lateral mesoderm left/right asymmetry(GO:1900224) |
| 0.1 | 0.2 | GO:0034402 | recruitment of 3'-end processing factors to RNA polymerase II holoenzyme complex(GO:0034402) |
| 0.1 | 0.9 | GO:0032328 | alanine transport(GO:0032328) |
| 0.1 | 0.7 | GO:1904684 | negative regulation of metalloendopeptidase activity(GO:1904684) |
| 0.1 | 0.5 | GO:1902513 | regulation of organelle transport along microtubule(GO:1902513) |
| 0.1 | 0.6 | GO:0044565 | dendritic cell proliferation(GO:0044565) |
| 0.1 | 0.6 | GO:0032484 | Ral protein signal transduction(GO:0032484) regulation of Ral protein signal transduction(GO:0032485) |
| 0.1 | 0.6 | GO:0051461 | positive regulation of corticotropin secretion(GO:0051461) |
| 0.1 | 0.5 | GO:0061113 | pancreas morphogenesis(GO:0061113) |
| 0.1 | 0.2 | GO:0006679 | glucosylceramide biosynthetic process(GO:0006679) |
| 0.1 | 0.5 | GO:0061086 | negative regulation of histone H3-K27 methylation(GO:0061086) |
| 0.1 | 0.3 | GO:0045226 | extracellular polysaccharide biosynthetic process(GO:0045226) extracellular polysaccharide metabolic process(GO:0046379) |
| 0.1 | 0.2 | GO:1903984 | positive regulation of TRAIL-activated apoptotic signaling pathway(GO:1903984) |
| 0.1 | 0.9 | GO:0031936 | negative regulation of chromatin silencing(GO:0031936) |
| 0.1 | 0.3 | GO:0048698 | negative regulation of collateral sprouting in absence of injury(GO:0048698) |
| 0.1 | 1.4 | GO:1902083 | negative regulation of peptidyl-cysteine S-nitrosylation(GO:1902083) |
| 0.1 | 0.4 | GO:0052422 | modulation by symbiont of host molecular function(GO:0052055) modulation of catalytic activity in other organism involved in symbiotic interaction(GO:0052203) modulation by host of symbiont catalytic activity(GO:0052422) |
| 0.1 | 0.2 | GO:0060399 | positive regulation of growth hormone receptor signaling pathway(GO:0060399) |
| 0.1 | 0.3 | GO:1904565 | response to 1-oleoyl-sn-glycerol 3-phosphate(GO:1904565) cellular response to 1-oleoyl-sn-glycerol 3-phosphate(GO:1904566) |
| 0.1 | 0.2 | GO:0021849 | neuroblast division in subventricular zone(GO:0021849) |
| 0.1 | 0.2 | GO:1990828 | response to putrescine(GO:1904585) cellular response to putrescine(GO:1904586) hepatocyte dedifferentiation(GO:1990828) |
| 0.1 | 0.2 | GO:0032290 | peripheral nervous system myelin formation(GO:0032290) |
| 0.1 | 0.1 | GO:0048633 | positive regulation of skeletal muscle tissue growth(GO:0048633) |
| 0.1 | 0.9 | GO:1902902 | negative regulation of autophagosome assembly(GO:1902902) |
| 0.1 | 0.2 | GO:0019085 | early viral transcription(GO:0019085) |
| 0.1 | 0.2 | GO:0044028 | DNA hypomethylation(GO:0044028) hypomethylation of CpG island(GO:0044029) |
| 0.1 | 0.2 | GO:0070898 | RNA polymerase III transcriptional preinitiation complex assembly(GO:0070898) |
| 0.1 | 0.4 | GO:0016344 | meiotic chromosome movement towards spindle pole(GO:0016344) |
| 0.1 | 0.2 | GO:0042536 | negative regulation of tumor necrosis factor biosynthetic process(GO:0042536) |
| 0.1 | 0.4 | GO:0045204 | MAPK export from nucleus(GO:0045204) |
| 0.0 | 0.5 | GO:0010606 | positive regulation of cytoplasmic mRNA processing body assembly(GO:0010606) |
| 0.0 | 0.2 | GO:0014053 | negative regulation of gamma-aminobutyric acid secretion(GO:0014053) aspartate secretion(GO:0061528) regulation of aspartate secretion(GO:1904448) positive regulation of aspartate secretion(GO:1904450) |
| 0.0 | 0.4 | GO:0071651 | positive regulation of chemokine (C-C motif) ligand 5 production(GO:0071651) |
| 0.0 | 0.6 | GO:0060158 | phospholipase C-activating dopamine receptor signaling pathway(GO:0060158) |
| 0.0 | 1.0 | GO:0045116 | protein neddylation(GO:0045116) |
| 0.0 | 0.1 | GO:0046832 | negative regulation of nucleobase-containing compound transport(GO:0032240) negative regulation of RNA export from nucleus(GO:0046832) |
| 0.0 | 0.4 | GO:0042985 | negative regulation of amyloid precursor protein biosynthetic process(GO:0042985) |
| 0.0 | 0.2 | GO:1903347 | negative regulation of bicellular tight junction assembly(GO:1903347) |
| 0.0 | 0.1 | GO:2000687 | negative regulation of rubidium ion transport(GO:2000681) negative regulation of rubidium ion transmembrane transporter activity(GO:2000687) |
| 0.0 | 0.3 | GO:0034436 | glycoprotein transport(GO:0034436) |
| 0.0 | 0.3 | GO:0072642 | interferon-alpha secretion(GO:0072642) regulation of interferon-alpha secretion(GO:1902739) positive regulation of interferon-alpha secretion(GO:1902741) |
| 0.0 | 0.3 | GO:0071918 | urea transmembrane transport(GO:0071918) |
| 0.0 | 0.3 | GO:0035694 | mitochondrial protein catabolic process(GO:0035694) |
| 0.0 | 0.8 | GO:0000338 | protein deneddylation(GO:0000338) |
| 0.0 | 0.2 | GO:0036353 | histone H2A-K119 monoubiquitination(GO:0036353) |
| 0.0 | 0.7 | GO:0007379 | segment specification(GO:0007379) |
| 0.0 | 0.4 | GO:0045602 | negative regulation of endothelial cell differentiation(GO:0045602) |
| 0.0 | 0.2 | GO:0007621 | negative regulation of female receptivity(GO:0007621) |
| 0.0 | 0.3 | GO:0070358 | actin polymerization-dependent cell motility(GO:0070358) |
| 0.0 | 0.3 | GO:0015798 | myo-inositol transport(GO:0015798) |
| 0.0 | 0.6 | GO:2000643 | positive regulation of early endosome to late endosome transport(GO:2000643) |
| 0.0 | 0.2 | GO:0033031 | positive regulation of neutrophil apoptotic process(GO:0033031) |
| 0.0 | 0.2 | GO:0018032 | protein amidation(GO:0018032) |
| 0.0 | 0.1 | GO:0038107 | determination of left/right asymmetry in lateral mesoderm(GO:0003140) nodal signaling pathway involved in determination of left/right asymmetry(GO:0038107) regulation of transcription from RNA polymerase II promoter involved in determination of left/right symmetry(GO:1900094) nodal signaling pathway involved in determination of lateral mesoderm left/right asymmetry(GO:1900164) |
| 0.0 | 0.1 | GO:1904761 | negative regulation of myofibroblast differentiation(GO:1904761) |
| 0.0 | 0.3 | GO:0050957 | equilibrioception(GO:0050957) |
| 0.0 | 0.1 | GO:0050916 | sensory perception of sweet taste(GO:0050916) |
| 0.0 | 0.1 | GO:0043634 | polyadenylation-dependent ncRNA catabolic process(GO:0043634) |
| 0.0 | 0.3 | GO:0030579 | ubiquitin-dependent SMAD protein catabolic process(GO:0030579) |
| 0.0 | 0.3 | GO:0060339 | negative regulation of type I interferon-mediated signaling pathway(GO:0060339) |
| 0.0 | 0.6 | GO:1904293 | negative regulation of ERAD pathway(GO:1904293) |
| 0.0 | 0.6 | GO:0071786 | endoplasmic reticulum tubular network organization(GO:0071786) |
| 0.0 | 0.1 | GO:0031548 | regulation of brain-derived neurotrophic factor receptor signaling pathway(GO:0031548) |
| 0.0 | 0.4 | GO:0018317 | protein C-linked glycosylation(GO:0018103) peptidyl-tryptophan modification(GO:0018211) protein C-linked glycosylation via tryptophan(GO:0018317) protein C-linked glycosylation via 2'-alpha-mannosyl-L-tryptophan(GO:0018406) |
| 0.0 | 0.4 | GO:0015074 | DNA integration(GO:0015074) |
| 0.0 | 0.3 | GO:0000395 | mRNA 5'-splice site recognition(GO:0000395) |
| 0.0 | 0.4 | GO:0060613 | fat pad development(GO:0060613) |
| 0.0 | 0.1 | GO:1901382 | chorionic trophoblast cell proliferation(GO:0097360) regulation of chorionic trophoblast cell proliferation(GO:1901382) |
| 0.0 | 1.4 | GO:0019835 | cytolysis(GO:0019835) |
| 0.0 | 0.7 | GO:0032486 | Rap protein signal transduction(GO:0032486) |
| 0.0 | 0.2 | GO:0010890 | positive regulation of sequestering of triglyceride(GO:0010890) |
| 0.0 | 0.1 | GO:1901340 | negative regulation of store-operated calcium channel activity(GO:1901340) |
| 0.0 | 0.1 | GO:2001202 | regulation of substrate-dependent cell migration, cell attachment to substrate(GO:1904235) positive regulation of substrate-dependent cell migration, cell attachment to substrate(GO:1904237) negative regulation of transforming growth factor-beta secretion(GO:2001202) |
| 0.0 | 0.3 | GO:0035871 | protein K11-linked deubiquitination(GO:0035871) |
| 0.0 | 0.8 | GO:0070933 | histone H4 deacetylation(GO:0070933) |
| 0.0 | 0.2 | GO:0051414 | response to cortisol(GO:0051414) |
| 0.0 | 1.0 | GO:0046827 | positive regulation of protein export from nucleus(GO:0046827) |
| 0.0 | 0.1 | GO:0070837 | dehydroascorbic acid transport(GO:0070837) |
| 0.0 | 0.5 | GO:0061635 | regulation of protein complex stability(GO:0061635) |
| 0.0 | 0.2 | GO:1905150 | regulation of voltage-gated sodium channel activity(GO:1905150) |
| 0.0 | 0.4 | GO:0030043 | actin filament fragmentation(GO:0030043) |
| 0.0 | 0.5 | GO:1902373 | negative regulation of mRNA catabolic process(GO:1902373) |
| 0.0 | 0.2 | GO:0035093 | spermatogenesis, exchange of chromosomal proteins(GO:0035093) |
| 0.0 | 0.1 | GO:1904978 | regulation of endosome organization(GO:1904978) |
| 0.0 | 0.1 | GO:1903966 | monounsaturated fatty acid metabolic process(GO:1903964) monounsaturated fatty acid biosynthetic process(GO:1903966) |
| 0.0 | 0.6 | GO:0070734 | histone H3-K27 methylation(GO:0070734) |
| 0.0 | 0.2 | GO:0035879 | plasma membrane lactate transport(GO:0035879) |
| 0.0 | 0.1 | GO:0061084 | regulation of protein refolding(GO:0061083) negative regulation of protein refolding(GO:0061084) |
| 0.0 | 0.6 | GO:0007064 | mitotic sister chromatid cohesion(GO:0007064) |
| 0.0 | 0.1 | GO:2000639 | regulation of SREBP signaling pathway(GO:2000638) negative regulation of SREBP signaling pathway(GO:2000639) |
| 0.0 | 0.0 | GO:0051462 | cortisol secretion(GO:0043400) regulation of cortisol secretion(GO:0051462) |
| 0.0 | 0.2 | GO:0048102 | autophagic cell death(GO:0048102) |
| 0.0 | 0.3 | GO:0021869 | forebrain ventricular zone progenitor cell division(GO:0021869) |
| 0.0 | 0.8 | GO:0010569 | regulation of double-strand break repair via homologous recombination(GO:0010569) |
| 0.0 | 0.4 | GO:1904896 | ESCRT complex disassembly(GO:1904896) ESCRT III complex disassembly(GO:1904903) |
| 0.0 | 0.2 | GO:1903690 | negative regulation of wound healing, spreading of epidermal cells(GO:1903690) |
| 0.0 | 0.2 | GO:1902037 | negative regulation of hematopoietic stem cell differentiation(GO:1902037) |
| 0.0 | 0.7 | GO:0036152 | phosphatidylethanolamine acyl-chain remodeling(GO:0036152) |
| 0.0 | 0.2 | GO:0051694 | pointed-end actin filament capping(GO:0051694) |
| 0.0 | 0.7 | GO:0042276 | error-prone translesion synthesis(GO:0042276) |
| 0.0 | 0.2 | GO:0031125 | rRNA 3'-end processing(GO:0031125) |
| 0.0 | 0.2 | GO:0030242 | pexophagy(GO:0030242) |
| 0.0 | 0.3 | GO:0070389 | chaperone cofactor-dependent protein refolding(GO:0070389) |
| 0.0 | 0.1 | GO:0032511 | late endosome to vacuole transport via multivesicular body sorting pathway(GO:0032511) |
| 0.0 | 1.1 | GO:0070979 | protein K11-linked ubiquitination(GO:0070979) |
| 0.0 | 0.2 | GO:0051005 | negative regulation of lipoprotein lipase activity(GO:0051005) |
| 0.0 | 0.1 | GO:0097368 | histone H4-K20 trimethylation(GO:0034773) establishment of Sertoli cell barrier(GO:0097368) |
| 0.0 | 0.1 | GO:0043366 | beta selection(GO:0043366) |
| 0.0 | 0.1 | GO:0035624 | receptor transactivation(GO:0035624) |
| 0.0 | 0.1 | GO:0038165 | oncostatin-M-mediated signaling pathway(GO:0038165) |
| 0.0 | 0.1 | GO:0072658 | positive regulation of cell communication by electrical coupling(GO:0010650) maintenance of protein location in membrane(GO:0072658) maintenance of protein location in plasma membrane(GO:0072660) positive regulation of membrane depolarization during cardiac muscle cell action potential(GO:1900827) |
| 0.0 | 0.2 | GO:0036484 | trunk segmentation(GO:0035290) trunk neural crest cell migration(GO:0036484) ventral trunk neural crest cell migration(GO:0036486) neural crest cell migration involved in autonomic nervous system development(GO:1901166) |
| 0.0 | 0.1 | GO:0030311 | poly-N-acetyllactosamine biosynthetic process(GO:0030311) |
| 0.0 | 0.1 | GO:0086048 | membrane depolarization during bundle of His cell action potential(GO:0086048) |
| 0.0 | 0.4 | GO:2000587 | negative regulation of platelet-derived growth factor receptor-beta signaling pathway(GO:2000587) |
| 0.0 | 0.0 | GO:1902309 | negative regulation of peptidyl-serine dephosphorylation(GO:1902309) |
| 0.0 | 0.4 | GO:0060117 | auditory receptor cell development(GO:0060117) |
| 0.0 | 0.9 | GO:1900271 | regulation of long-term synaptic potentiation(GO:1900271) |
| 0.0 | 0.0 | GO:0070534 | protein K63-linked ubiquitination(GO:0070534) |
| 0.0 | 0.3 | GO:0021957 | corticospinal tract morphogenesis(GO:0021957) |
| 0.0 | 0.2 | GO:1901796 | regulation of signal transduction by p53 class mediator(GO:1901796) |
| 0.0 | 0.1 | GO:0009052 | pentose-phosphate shunt, non-oxidative branch(GO:0009052) |
| 0.0 | 0.3 | GO:0032688 | negative regulation of interferon-beta production(GO:0032688) |
| 0.0 | 0.0 | GO:0060458 | right lung development(GO:0060458) |
| 0.0 | 0.3 | GO:0031584 | activation of phospholipase D activity(GO:0031584) |
| 0.0 | 0.2 | GO:0071763 | nuclear membrane organization(GO:0071763) |
| 0.0 | 0.0 | GO:0021793 | chemorepulsion of branchiomotor axon(GO:0021793) |
| 0.0 | 0.1 | GO:0097211 | response to gonadotropin-releasing hormone(GO:0097210) cellular response to gonadotropin-releasing hormone(GO:0097211) |
| 0.0 | 0.1 | GO:0070120 | ciliary neurotrophic factor-mediated signaling pathway(GO:0070120) |
| 0.0 | 0.4 | GO:0071108 | protein K48-linked deubiquitination(GO:0071108) |
| 0.0 | 0.0 | GO:1903515 | regulation of calcium ion-dependent exocytosis of neurotransmitter(GO:1903233) calcium ion transport from cytosol to endoplasmic reticulum(GO:1903515) |
| 0.0 | 0.1 | GO:0051534 | negative regulation of NFAT protein import into nucleus(GO:0051534) |
| 0.0 | 0.3 | GO:0016180 | snRNA processing(GO:0016180) |
| 0.0 | 0.2 | GO:0042492 | gamma-delta T cell differentiation(GO:0042492) |
| 0.0 | 0.2 | GO:0071420 | cellular response to histamine(GO:0071420) |
| 0.0 | 0.2 | GO:0006451 | selenocysteine incorporation(GO:0001514) translational readthrough(GO:0006451) |
| 0.0 | 0.1 | GO:0070940 | dephosphorylation of RNA polymerase II C-terminal domain(GO:0070940) |
| 0.0 | 0.1 | GO:1902237 | positive regulation of endoplasmic reticulum stress-induced intrinsic apoptotic signaling pathway(GO:1902237) |
| 0.0 | 0.1 | GO:0030316 | osteoclast differentiation(GO:0030316) |
| 0.0 | 0.5 | GO:0045672 | positive regulation of osteoclast differentiation(GO:0045672) |
| 0.0 | 0.3 | GO:0043555 | regulation of translation in response to stress(GO:0043555) |
| 0.0 | 0.3 | GO:2000480 | negative regulation of cAMP-dependent protein kinase activity(GO:2000480) |
| 0.0 | 0.2 | GO:1902916 | positive regulation of protein polyubiquitination(GO:1902916) |
| 0.0 | 0.4 | GO:0071539 | protein localization to centrosome(GO:0071539) |
| 0.0 | 0.4 | GO:0000185 | activation of MAPKKK activity(GO:0000185) |
| 0.0 | 0.0 | GO:0021784 | postganglionic parasympathetic fiber development(GO:0021784) |
| 0.0 | 0.6 | GO:0050855 | regulation of B cell receptor signaling pathway(GO:0050855) |
| 0.0 | 0.2 | GO:0006999 | nuclear pore organization(GO:0006999) |
| 0.0 | 0.1 | GO:0010265 | SCF complex assembly(GO:0010265) |
| 0.0 | 0.2 | GO:0070935 | 3'-UTR-mediated mRNA stabilization(GO:0070935) |
| 0.0 | 0.5 | GO:0046039 | GTP metabolic process(GO:0046039) |
| 0.0 | 0.1 | GO:2000785 | regulation of autophagosome assembly(GO:2000785) |
| 0.0 | 0.1 | GO:1900028 | negative regulation of ruffle assembly(GO:1900028) |
Gene overrepresentation in cellular_component category:
| Log-likelihood per target | Total log-likelihood | Term | Description |
|---|---|---|---|
| 0.2 | 0.6 | GO:0043614 | multi-eIF complex(GO:0043614) translation preinitiation complex(GO:0070993) astrocyte end-foot(GO:0097450) glial limiting end-foot(GO:0097451) |
| 0.1 | 1.1 | GO:0070032 | synaptobrevin 2-SNAP-25-syntaxin-1a-complexin I complex(GO:0070032) |
| 0.1 | 1.1 | GO:0016272 | prefoldin complex(GO:0016272) |
| 0.1 | 0.3 | GO:0075341 | host cell PML body(GO:0075341) |
| 0.1 | 0.6 | GO:0031205 | endoplasmic reticulum Sec complex(GO:0031205) |
| 0.1 | 0.6 | GO:0005826 | actomyosin contractile ring(GO:0005826) |
| 0.1 | 0.4 | GO:0031251 | PAN complex(GO:0031251) |
| 0.1 | 0.4 | GO:0030289 | protein phosphatase 4 complex(GO:0030289) |
| 0.1 | 0.8 | GO:0001739 | sex chromatin(GO:0001739) |
| 0.1 | 0.7 | GO:0060200 | clathrin-sculpted acetylcholine transport vesicle(GO:0060200) clathrin-sculpted acetylcholine transport vesicle membrane(GO:0060201) clathrin-sculpted monoamine transport vesicle(GO:0070081) clathrin-sculpted monoamine transport vesicle membrane(GO:0070083) |
| 0.1 | 0.6 | GO:0051286 | cell tip(GO:0051286) |
| 0.1 | 0.5 | GO:0070695 | FHF complex(GO:0070695) |
| 0.1 | 0.4 | GO:0032444 | activin responsive factor complex(GO:0032444) |
| 0.1 | 0.4 | GO:0097442 | CA3 pyramidal cell dendrite(GO:0097442) |
| 0.0 | 0.2 | GO:0032144 | 4-aminobutyrate transaminase complex(GO:0032144) |
| 0.0 | 0.1 | GO:0005900 | oncostatin-M receptor complex(GO:0005900) |
| 0.0 | 0.9 | GO:0042588 | zymogen granule(GO:0042588) |
| 0.0 | 0.5 | GO:0098559 | cytoplasmic side of early endosome membrane(GO:0098559) |
| 0.0 | 0.2 | GO:0000126 | transcription factor TFIIIB complex(GO:0000126) |
| 0.0 | 0.4 | GO:0016602 | CCAAT-binding factor complex(GO:0016602) |
| 0.0 | 0.1 | GO:1990604 | IRE1-TRAF2-ASK1 complex(GO:1990604) |
| 0.0 | 0.3 | GO:0033503 | HULC complex(GO:0033503) |
| 0.0 | 0.1 | GO:0048179 | activin receptor complex(GO:0048179) |
| 0.0 | 0.4 | GO:0035102 | PRC1 complex(GO:0035102) |
| 0.0 | 0.2 | GO:0016012 | sarcoglycan complex(GO:0016012) |
| 0.0 | 0.2 | GO:0035032 | phosphatidylinositol 3-kinase complex, class III(GO:0035032) |
| 0.0 | 0.7 | GO:0030014 | CCR4-NOT complex(GO:0030014) |
| 0.0 | 0.2 | GO:0071204 | histone pre-mRNA 3'end processing complex(GO:0071204) |
| 0.0 | 0.4 | GO:0000124 | SAGA complex(GO:0000124) STAGA complex(GO:0030914) |
| 0.0 | 0.1 | GO:0097059 | CNTFR-CLCF1 complex(GO:0097059) |
| 0.0 | 0.6 | GO:0031235 | intrinsic component of the cytoplasmic side of the plasma membrane(GO:0031235) |
| 0.0 | 0.2 | GO:0005828 | kinetochore microtubule(GO:0005828) |
| 0.0 | 0.6 | GO:0005852 | eukaryotic translation initiation factor 3 complex(GO:0005852) |
| 0.0 | 0.2 | GO:0016593 | Cdc73/Paf1 complex(GO:0016593) |
| 0.0 | 0.3 | GO:0033256 | I-kappaB/NF-kappaB complex(GO:0033256) |
| 0.0 | 0.1 | GO:0000806 | Y chromosome(GO:0000806) cyclin A1-CDK2 complex(GO:0097123) cyclin E1-CDK2 complex(GO:0097134) |
| 0.0 | 0.1 | GO:0005726 | perichromatin fibrils(GO:0005726) |
| 0.0 | 0.2 | GO:1990111 | spermatoproteasome complex(GO:1990111) |
| 0.0 | 0.4 | GO:0044615 | nuclear pore nuclear basket(GO:0044615) |
| 0.0 | 0.7 | GO:0070822 | Sin3-type complex(GO:0070822) |
| 0.0 | 0.3 | GO:0032039 | integrator complex(GO:0032039) |
| 0.0 | 0.1 | GO:0097550 | transcriptional preinitiation complex(GO:0097550) |
| 0.0 | 0.7 | GO:0071782 | endoplasmic reticulum tubular network(GO:0071782) |
| 0.0 | 0.2 | GO:0017059 | serine C-palmitoyltransferase complex(GO:0017059) endoplasmic reticulum palmitoyltransferase complex(GO:0031211) |
| 0.0 | 1.0 | GO:0035861 | site of double-strand break(GO:0035861) |
| 0.0 | 0.4 | GO:0035327 | transcriptionally active chromatin(GO:0035327) |
| 0.0 | 0.3 | GO:0031464 | Cul4A-RING E3 ubiquitin ligase complex(GO:0031464) |
| 0.0 | 0.5 | GO:0035098 | ESC/E(Z) complex(GO:0035098) |
| 0.0 | 0.1 | GO:1990452 | Parkin-FBXW7-Cul1 ubiquitin ligase complex(GO:1990452) |
| 0.0 | 0.4 | GO:0005942 | phosphatidylinositol 3-kinase complex(GO:0005942) |
| 0.0 | 0.1 | GO:0016589 | NURF complex(GO:0016589) |
| 0.0 | 0.4 | GO:0043220 | Schmidt-Lanterman incisure(GO:0043220) |
| 0.0 | 0.1 | GO:0070545 | PeBoW complex(GO:0070545) |
| 0.0 | 0.3 | GO:0033391 | chromatoid body(GO:0033391) |
| 0.0 | 0.5 | GO:0031229 | integral component of nuclear inner membrane(GO:0005639) intrinsic component of nuclear inner membrane(GO:0031229) |
| 0.0 | 1.1 | GO:0031201 | SNARE complex(GO:0031201) |
| 0.0 | 0.3 | GO:0000815 | ESCRT III complex(GO:0000815) |
| 0.0 | 0.1 | GO:0033018 | sarcoplasmic reticulum lumen(GO:0033018) |
| 0.0 | 0.4 | GO:0005885 | Arp2/3 protein complex(GO:0005885) |
| 0.0 | 0.6 | GO:0005680 | anaphase-promoting complex(GO:0005680) |
| 0.0 | 0.1 | GO:0038039 | G-protein coupled receptor heterodimeric complex(GO:0038039) |
| 0.0 | 1.2 | GO:0034707 | chloride channel complex(GO:0034707) |
| 0.0 | 0.3 | GO:0005736 | DNA-directed RNA polymerase I complex(GO:0005736) |
| 0.0 | 0.2 | GO:0030981 | cortical microtubule cytoskeleton(GO:0030981) |
| 0.0 | 0.9 | GO:0005834 | heterotrimeric G-protein complex(GO:0005834) |
| 0.0 | 0.8 | GO:0008180 | COP9 signalosome(GO:0008180) |
| 0.0 | 1.1 | GO:0055038 | recycling endosome membrane(GO:0055038) |
| 0.0 | 0.4 | GO:0000242 | pericentriolar material(GO:0000242) |
| 0.0 | 0.0 | GO:0043293 | apoptosome(GO:0043293) |
| 0.0 | 0.1 | GO:0002178 | palmitoyltransferase complex(GO:0002178) |
| 0.0 | 1.3 | GO:0000118 | histone deacetylase complex(GO:0000118) |
| 0.0 | 0.1 | GO:0030430 | host cell cytoplasm(GO:0030430) host cell cytoplasm part(GO:0033655) |
| 0.0 | 0.3 | GO:0005952 | cAMP-dependent protein kinase complex(GO:0005952) |
| 0.0 | 0.3 | GO:0034385 | very-low-density lipoprotein particle(GO:0034361) triglyceride-rich lipoprotein particle(GO:0034385) |
| 0.0 | 0.2 | GO:0017146 | NMDA selective glutamate receptor complex(GO:0017146) |
| 0.0 | 0.2 | GO:0030008 | TRAPP complex(GO:0030008) |
| 0.0 | 0.0 | GO:1902737 | dendritic filopodium(GO:1902737) |
| 0.0 | 0.2 | GO:0010369 | chromocenter(GO:0010369) |
Gene overrepresentation in molecular_function category:
| Log-likelihood per target | Total log-likelihood | Term | Description |
|---|---|---|---|
| 0.3 | 1.0 | GO:0005483 | soluble NSF attachment protein activity(GO:0005483) |
| 0.2 | 0.9 | GO:1904455 | ubiquitin-specific protease activity involved in negative regulation of ERAD pathway(GO:1904455) |
| 0.2 | 0.5 | GO:0072591 | citrate-L-glutamate ligase activity(GO:0072591) |
| 0.1 | 0.4 | GO:0050613 | delta14-sterol reductase activity(GO:0050613) |
| 0.1 | 0.4 | GO:0046404 | ATP-dependent polydeoxyribonucleotide 5'-hydroxyl-kinase activity(GO:0046404) polydeoxyribonucleotide kinase activity(GO:0051733) ATP-dependent polynucleotide kinase activity(GO:0051734) |
| 0.1 | 0.7 | GO:0023030 | MHC class Ib protein complex binding(GO:0023025) MHC class Ib protein binding, via antigen binding groove(GO:0023030) |
| 0.1 | 0.8 | GO:0071535 | RING-like zinc finger domain binding(GO:0071535) |
| 0.1 | 0.6 | GO:0031826 | type 2A serotonin receptor binding(GO:0031826) |
| 0.1 | 0.3 | GO:0005365 | myo-inositol transmembrane transporter activity(GO:0005365) |
| 0.1 | 0.5 | GO:0016413 | O-acetyltransferase activity(GO:0016413) |
| 0.1 | 0.6 | GO:0004758 | serine C-palmitoyltransferase activity(GO:0004758) C-palmitoyltransferase activity(GO:0016454) |
| 0.1 | 0.2 | GO:0071207 | histone pre-mRNA stem-loop binding(GO:0071207) |
| 0.1 | 0.3 | GO:0034189 | very-low-density lipoprotein particle binding(GO:0034189) |
| 0.1 | 0.8 | GO:0008568 | microtubule-severing ATPase activity(GO:0008568) |
| 0.1 | 0.7 | GO:0030348 | syntaxin-3 binding(GO:0030348) |
| 0.1 | 0.6 | GO:0046976 | histone methyltransferase activity (H3-K27 specific)(GO:0046976) |
| 0.1 | 0.3 | GO:0031752 | D5 dopamine receptor binding(GO:0031752) |
| 0.1 | 0.3 | GO:0050501 | hyaluronan synthase activity(GO:0050501) |
| 0.1 | 0.5 | GO:0004839 | ubiquitin activating enzyme activity(GO:0004839) |
| 0.1 | 0.7 | GO:0047144 | 2-acylglycerol-3-phosphate O-acyltransferase activity(GO:0047144) |
| 0.1 | 0.7 | GO:0033592 | RNA strand annealing activity(GO:0033592) |
| 0.1 | 0.2 | GO:0001156 | TFIIIC-class transcription factor binding(GO:0001156) |
| 0.1 | 0.2 | GO:0051800 | phosphatidylinositol-3,4-bisphosphate 3-phosphatase activity(GO:0051800) |
| 0.1 | 0.3 | GO:0015265 | urea channel activity(GO:0015265) |
| 0.0 | 0.2 | GO:0032145 | 4-aminobutyrate transaminase activity(GO:0003867) succinate-semialdehyde dehydrogenase binding(GO:0032145) (S)-3-amino-2-methylpropionate transaminase activity(GO:0047298) |
| 0.0 | 0.1 | GO:0086057 | voltage-gated calcium channel activity involved in bundle of His cell action potential(GO:0086057) |
| 0.0 | 0.6 | GO:0030911 | TPR domain binding(GO:0030911) |
| 0.0 | 0.4 | GO:0035005 | 1-phosphatidylinositol-4-phosphate 3-kinase activity(GO:0035005) |
| 0.0 | 0.3 | GO:0004176 | ATP-dependent peptidase activity(GO:0004176) |
| 0.0 | 0.3 | GO:0031821 | G-protein coupled serotonin receptor binding(GO:0031821) |
| 0.0 | 1.0 | GO:0097602 | cullin family protein binding(GO:0097602) |
| 0.0 | 0.2 | GO:0004598 | peptidylglycine monooxygenase activity(GO:0004504) peptidylamidoglycolate lyase activity(GO:0004598) |
| 0.0 | 0.6 | GO:0022889 | L-serine transmembrane transporter activity(GO:0015194) serine transmembrane transporter activity(GO:0022889) |
| 0.0 | 0.2 | GO:0004719 | protein-L-isoaspartate (D-aspartate) O-methyltransferase activity(GO:0004719) |
| 0.0 | 0.3 | GO:0030274 | LIM domain binding(GO:0030274) |
| 0.0 | 0.3 | GO:0035727 | lysophosphatidic acid binding(GO:0035727) |
| 0.0 | 0.4 | GO:1990380 | Lys48-specific deubiquitinase activity(GO:1990380) |
| 0.0 | 0.9 | GO:0004535 | poly(A)-specific ribonuclease activity(GO:0004535) |
| 0.0 | 0.2 | GO:0035368 | selenocysteine insertion sequence binding(GO:0035368) |
| 0.0 | 0.2 | GO:0010465 | nerve growth factor receptor activity(GO:0010465) |
| 0.0 | 0.3 | GO:0002151 | G-quadruplex RNA binding(GO:0002151) |
| 0.0 | 0.1 | GO:0004711 | ribosomal protein S6 kinase activity(GO:0004711) |
| 0.0 | 0.4 | GO:0050291 | sphingosine N-acyltransferase activity(GO:0050291) |
| 0.0 | 0.1 | GO:0033300 | dehydroascorbic acid transporter activity(GO:0033300) |
| 0.0 | 2.5 | GO:0019003 | GDP binding(GO:0019003) |
| 0.0 | 0.2 | GO:1904929 | coreceptor activity involved in Wnt signaling pathway, planar cell polarity pathway(GO:1904929) |
| 0.0 | 0.2 | GO:0022851 | GABA-gated chloride ion channel activity(GO:0022851) |
| 0.0 | 1.2 | GO:0017075 | syntaxin-1 binding(GO:0017075) |
| 0.0 | 0.1 | GO:0004346 | glucose-6-phosphatase activity(GO:0004346) sugar-terminal-phosphatase activity(GO:0050309) |
| 0.0 | 0.3 | GO:0004652 | polynucleotide adenylyltransferase activity(GO:0004652) |
| 0.0 | 0.1 | GO:0004968 | gonadotropin-releasing hormone receptor activity(GO:0004968) |
| 0.0 | 0.1 | GO:0009019 | tRNA (guanine-N1-)-methyltransferase activity(GO:0009019) |
| 0.0 | 0.1 | GO:0048403 | brain-derived neurotrophic factor binding(GO:0048403) |
| 0.0 | 0.1 | GO:0050115 | myosin-light-chain-phosphatase activity(GO:0050115) |
| 0.0 | 0.1 | GO:0004924 | oncostatin-M receptor activity(GO:0004924) |
| 0.0 | 0.1 | GO:0008441 | 3'(2'),5'-bisphosphate nucleotidase activity(GO:0008441) |
| 0.0 | 0.4 | GO:0034713 | type I transforming growth factor beta receptor binding(GO:0034713) |
| 0.0 | 1.0 | GO:0004364 | glutathione transferase activity(GO:0004364) |
| 0.0 | 0.3 | GO:0097100 | supercoiled DNA binding(GO:0097100) |
| 0.0 | 0.1 | GO:0004692 | cGMP-dependent protein kinase activity(GO:0004692) |
| 0.0 | 0.2 | GO:0004861 | cyclin-dependent protein serine/threonine kinase inhibitor activity(GO:0004861) |
| 0.0 | 0.1 | GO:0016361 | activin receptor activity, type I(GO:0016361) |
| 0.0 | 0.4 | GO:0046527 | glucosyltransferase activity(GO:0046527) |
| 0.0 | 1.0 | GO:0061631 | ubiquitin conjugating enzyme activity(GO:0061631) ubiquitin-like protein conjugating enzyme activity(GO:0061650) |
| 0.0 | 0.1 | GO:0004897 | ciliary neurotrophic factor receptor activity(GO:0004897) |
| 0.0 | 0.2 | GO:0003680 | AT DNA binding(GO:0003680) |
| 0.0 | 0.1 | GO:0008532 | N-acetyllactosaminide beta-1,3-N-acetylglucosaminyltransferase activity(GO:0008532) |
| 0.0 | 0.1 | GO:0043812 | phosphatidylinositol-4-phosphate phosphatase activity(GO:0043812) |
| 0.0 | 0.3 | GO:0008301 | DNA binding, bending(GO:0008301) |
| 0.0 | 0.3 | GO:0030544 | Hsp70 protein binding(GO:0030544) |
| 0.0 | 0.5 | GO:0051787 | misfolded protein binding(GO:0051787) |
| 0.0 | 0.4 | GO:0008349 | MAP kinase kinase kinase kinase activity(GO:0008349) |
| 0.0 | 0.2 | GO:0004887 | thyroid hormone receptor activity(GO:0004887) |
| 0.0 | 0.3 | GO:0070016 | armadillo repeat domain binding(GO:0070016) |
| 0.0 | 0.0 | GO:0086039 | lutropin-choriogonadotropic hormone receptor binding(GO:0031775) calcium-transporting ATPase activity involved in regulation of cardiac muscle cell membrane potential(GO:0086039) |
| 0.0 | 0.5 | GO:0070742 | C2H2 zinc finger domain binding(GO:0070742) |
| 0.0 | 0.3 | GO:0001054 | RNA polymerase I activity(GO:0001054) |
| 0.0 | 0.5 | GO:0046965 | retinoid X receptor binding(GO:0046965) |
| 0.0 | 0.2 | GO:0019911 | structural constituent of myelin sheath(GO:0019911) |
| 0.0 | 0.4 | GO:0008510 | sodium:bicarbonate symporter activity(GO:0008510) |
| 0.0 | 0.2 | GO:0097322 | 7SK snRNA binding(GO:0097322) |
| 0.0 | 0.3 | GO:0015280 | ligand-gated sodium channel activity(GO:0015280) |
| 0.0 | 0.4 | GO:0005092 | GDP-dissociation inhibitor activity(GO:0005092) |
| 0.0 | 0.2 | GO:0019211 | phosphatase activator activity(GO:0019211) |
| 0.0 | 0.1 | GO:0015349 | thyroid hormone transmembrane transporter activity(GO:0015349) |
| 0.0 | 0.4 | GO:0017056 | structural constituent of nuclear pore(GO:0017056) |
| 0.0 | 0.0 | GO:0005173 | stem cell factor receptor binding(GO:0005173) |
| 0.0 | 0.2 | GO:0004726 | non-membrane spanning protein tyrosine phosphatase activity(GO:0004726) |
| 0.0 | 0.1 | GO:0008321 | Ral guanyl-nucleotide exchange factor activity(GO:0008321) |
| 0.0 | 0.4 | GO:0002162 | dystroglycan binding(GO:0002162) |
| 0.0 | 0.0 | GO:0016964 | alpha-2 macroglobulin receptor activity(GO:0016964) |
| 0.0 | 0.1 | GO:0004965 | G-protein coupled GABA receptor activity(GO:0004965) |
| 0.0 | 0.1 | GO:0036312 | phosphatidylinositol 3-kinase regulatory subunit binding(GO:0036312) |
| 0.0 | 0.5 | GO:0051959 | dynein light intermediate chain binding(GO:0051959) |
| 0.0 | 0.4 | GO:0017025 | TBP-class protein binding(GO:0017025) |
| 0.0 | 0.4 | GO:0000030 | mannosyltransferase activity(GO:0000030) |
| 0.0 | 0.3 | GO:0008603 | cAMP-dependent protein kinase regulator activity(GO:0008603) |
| 0.0 | 0.1 | GO:0097027 | ubiquitin-protein transferase activator activity(GO:0097027) |
| 0.0 | 0.2 | GO:0045294 | alpha-catenin binding(GO:0045294) |
| 0.0 | 0.1 | GO:0000774 | adenyl-nucleotide exchange factor activity(GO:0000774) |
| 0.0 | 0.0 | GO:0034736 | sterol O-acyltransferase activity(GO:0004772) cholesterol O-acyltransferase activity(GO:0034736) |
| 0.0 | 0.0 | GO:0032422 | purine-rich negative regulatory element binding(GO:0032422) |
Gene overrepresentation in C2:CP category:
| Log-likelihood per target | Total log-likelihood | Term | Description |
|---|---|---|---|
| 0.1 | 1.4 | PID THROMBIN PAR4 PATHWAY | PAR4-mediated thrombin signaling events |
| 0.0 | 0.3 | PID NFKAPPAB ATYPICAL PATHWAY | Atypical NF-kappaB pathway |
| 0.0 | 1.3 | SIG REGULATION OF THE ACTIN CYTOSKELETON BY RHO GTPASES | Genes related to regulation of the actin cytoskeleton |
| 0.0 | 0.7 | PID SMAD2 3PATHWAY | Regulation of cytoplasmic and nuclear SMAD2/3 signaling |
| 0.0 | 0.2 | PID S1P S1P4 PATHWAY | S1P4 pathway |
| 0.0 | 0.2 | SA REG CASCADE OF CYCLIN EXPR | Expression of cyclins regulates progression through the cell cycle by activating cyclin-dependent kinases. |
| 0.0 | 2.0 | PID MYC ACTIV PATHWAY | Validated targets of C-MYC transcriptional activation |
| 0.0 | 0.7 | PID ECADHERIN NASCENT AJ PATHWAY | E-cadherin signaling in the nascent adherens junction |
| 0.0 | 0.7 | PID NCADHERIN PATHWAY | N-cadherin signaling events |
| 0.0 | 0.1 | PID S1P S1P1 PATHWAY | S1P1 pathway |
| 0.0 | 0.8 | PID RAS PATHWAY | Regulation of Ras family activation |
Gene overrepresentation in C2:CP:REACTOME category:
| Log-likelihood per target | Total log-likelihood | Term | Description |
|---|---|---|---|
| 0.1 | 1.8 | REACTOME ACETYLCHOLINE NEUROTRANSMITTER RELEASE CYCLE | Genes involved in Acetylcholine Neurotransmitter Release Cycle |
| 0.1 | 1.1 | REACTOME GLUTAMATE NEUROTRANSMITTER RELEASE CYCLE | Genes involved in Glutamate Neurotransmitter Release Cycle |
| 0.0 | 0.3 | REACTOME APOBEC3G MEDIATED RESISTANCE TO HIV1 INFECTION | Genes involved in APOBEC3G mediated resistance to HIV-1 infection |
| 0.0 | 0.6 | REACTOME TRAF3 DEPENDENT IRF ACTIVATION PATHWAY | Genes involved in TRAF3-dependent IRF activation pathway |
| 0.0 | 0.7 | REACTOME ACYL CHAIN REMODELLING OF PE | Genes involved in Acyl chain remodelling of PE |
| 0.0 | 0.4 | REACTOME RAF MAP KINASE CASCADE | Genes involved in RAF/MAP kinase cascade |
| 0.0 | 1.2 | REACTOME SIGNALING BY BMP | Genes involved in Signaling by BMP |
| 0.0 | 1.2 | REACTOME SIGNAL AMPLIFICATION | Genes involved in Signal amplification |
| 0.0 | 1.1 | REACTOME PREFOLDIN MEDIATED TRANSFER OF SUBSTRATE TO CCT TRIC | Genes involved in Prefoldin mediated transfer of substrate to CCT/TriC |
| 0.0 | 0.6 | REACTOME PLATELET SENSITIZATION BY LDL | Genes involved in Platelet sensitization by LDL |
| 0.0 | 0.2 | REACTOME SCFSKP2 MEDIATED DEGRADATION OF P27 P21 | Genes involved in SCF(Skp2)-mediated degradation of p27/p21 |
| 0.0 | 0.8 | REACTOME RNA POL III TRANSCRIPTION INITIATION FROM TYPE 3 PROMOTER | Genes involved in RNA Polymerase III Transcription Initiation From Type 3 Promoter |
| 0.0 | 0.4 | REACTOME RECRUITMENT OF NUMA TO MITOTIC CENTROSOMES | Genes involved in Recruitment of NuMA to mitotic centrosomes |
| 0.0 | 0.9 | REACTOME PERK REGULATED GENE EXPRESSION | Genes involved in PERK regulated gene expression |
| 0.0 | 0.6 | REACTOME PHOSPHORYLATION OF THE APC C | Genes involved in Phosphorylation of the APC/C |
| 0.0 | 0.6 | REACTOME GRB2 SOS PROVIDES LINKAGE TO MAPK SIGNALING FOR INTERGRINS | Genes involved in GRB2:SOS provides linkage to MAPK signaling for Intergrins |
| 0.0 | 0.2 | REACTOME DESTABILIZATION OF MRNA BY AUF1 HNRNP D0 | Genes involved in Destabilization of mRNA by AUF1 (hnRNP D0) |
| 0.0 | 0.2 | REACTOME RECEPTOR LIGAND BINDING INITIATES THE SECOND PROTEOLYTIC CLEAVAGE OF NOTCH RECEPTOR | Genes involved in Receptor-ligand binding initiates the second proteolytic cleavage of Notch receptor |
| 0.0 | 0.6 | REACTOME ELONGATION ARREST AND RECOVERY | Genes involved in Elongation arrest and recovery |
| 0.0 | 0.5 | REACTOME SIGNALING BY NODAL | Genes involved in Signaling by NODAL |
| 0.0 | 0.8 | REACTOME DEADENYLATION OF MRNA | Genes involved in Deadenylation of mRNA |
| 0.0 | 0.6 | REACTOME RNA POL II TRANSCRIPTION PRE INITIATION AND PROMOTER OPENING | Genes involved in RNA Polymerase II Transcription Pre-Initiation And Promoter Opening |
| 0.0 | 0.2 | REACTOME P75NTR RECRUITS SIGNALLING COMPLEXES | Genes involved in p75NTR recruits signalling complexes |
| 0.0 | 0.4 | REACTOME ENDOSOMAL SORTING COMPLEX REQUIRED FOR TRANSPORT ESCRT | Genes involved in Endosomal Sorting Complex Required For Transport (ESCRT) |
| 0.0 | 0.3 | REACTOME ACTIVATION OF NF KAPPAB IN B CELLS | Genes involved in Activation of NF-kappaB in B Cells |
| 0.0 | 0.7 | REACTOME RECYCLING PATHWAY OF L1 | Genes involved in Recycling pathway of L1 |
| 0.0 | 0.3 | REACTOME TIE2 SIGNALING | Genes involved in Tie2 Signaling |
| 0.0 | 0.3 | REACTOME HYALURONAN METABOLISM | Genes involved in Hyaluronan metabolism |
| 0.0 | 0.4 | REACTOME CHOLESTEROL BIOSYNTHESIS | Genes involved in Cholesterol biosynthesis |