Project
avrg: A549 cells infected with RSV Analysis Results (GEO series: GSE147507)
Navigation
Downloads
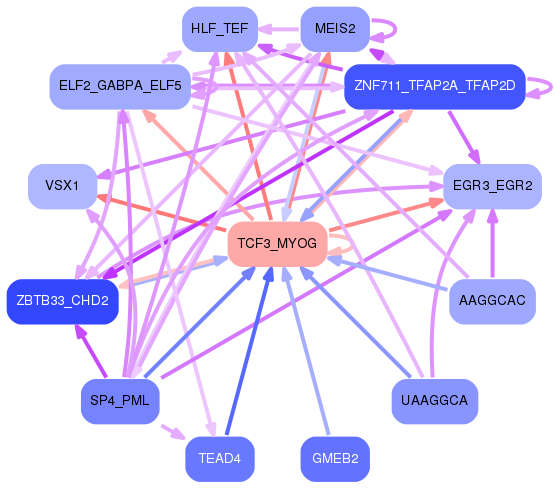
Results for TCF3_MYOG
Z-value: 1.21
Motif logo
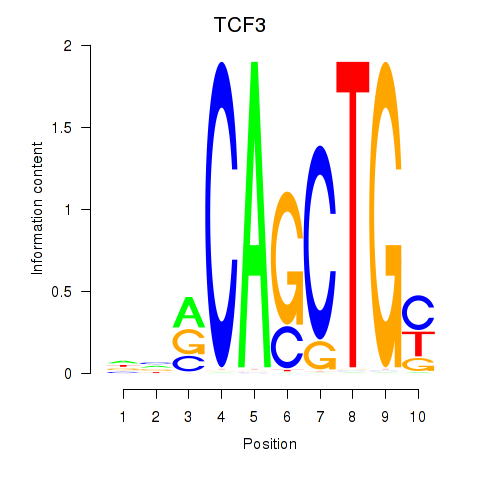
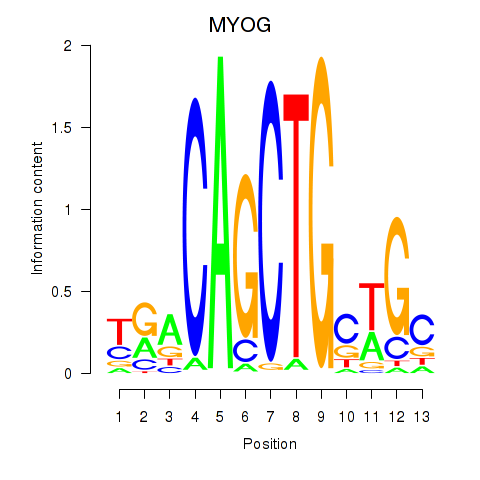
Transcription factors associated with TCF3_MYOG
| Gene Symbol | Gene ID | Gene Info |
|---|---|---|
|
TCF3
|
ENSG00000071564.10 | transcription factor 3 |
|
MYOG
|
ENSG00000122180.4 | myogenin |
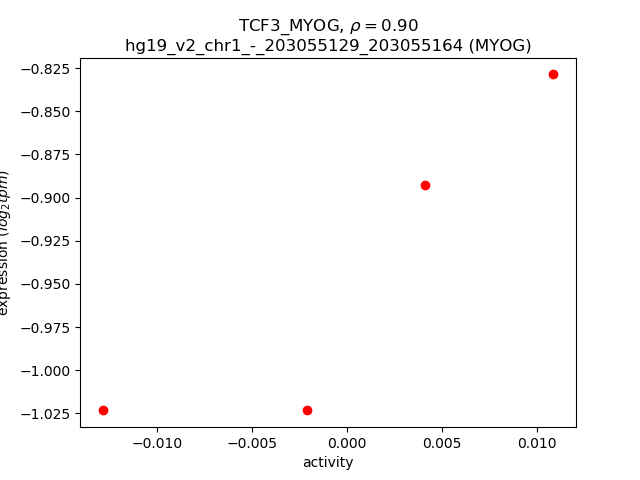
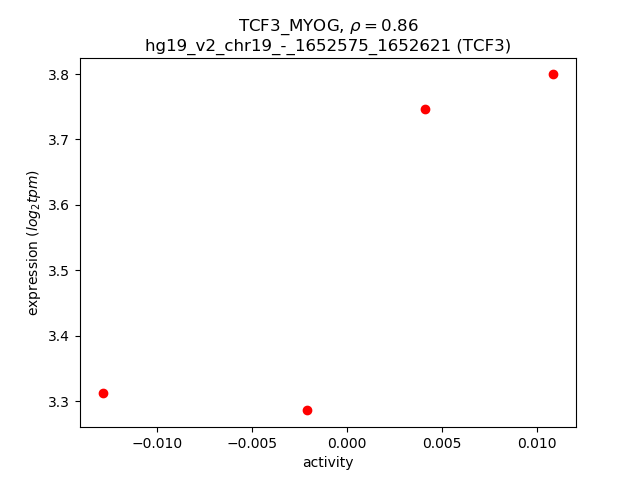
Activity-expression correlation:
| Gene | Promoter | Pearson corr. coef. | P-value | Plot |
|---|---|---|---|---|
| MYOG | hg19_v2_chr1_-_203055129_203055164 | 0.90 | 1.0e-01 | Click! |
| TCF3 | hg19_v2_chr19_-_1652575_1652621 | 0.86 | 1.4e-01 | Click! |