Project
avrg: A549 cells infected with RSV Analysis Results (GEO series: GSE147507)
Navigation
Downloads
Results for HIC1
Z-value: 0.94
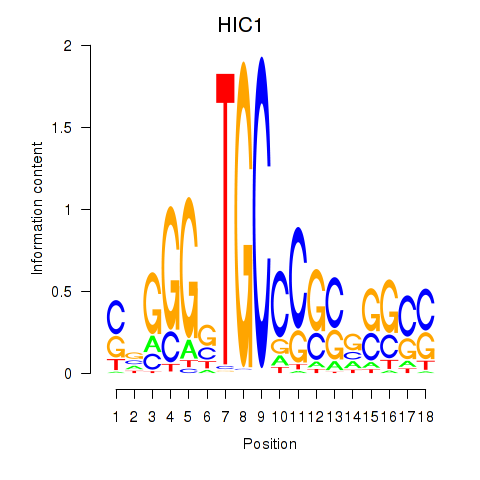
Motif logo
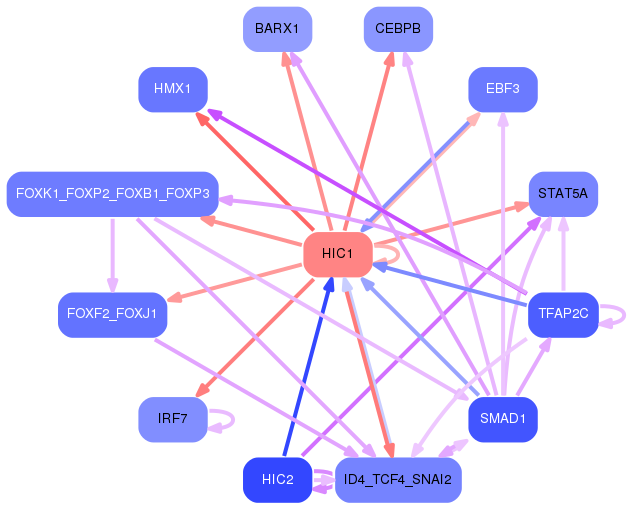
Transcription factors associated with HIC1
| Gene Symbol | Gene ID | Gene Info |
|---|---|---|
|
HIC1
|
ENSG00000177374.8 | HIC ZBTB transcriptional repressor 1 |
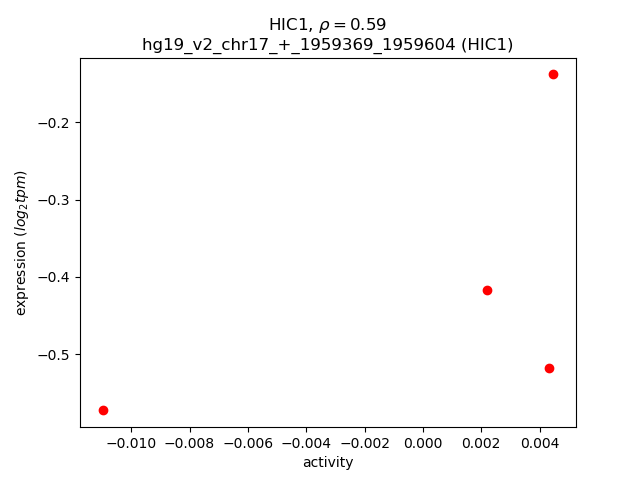
Activity-expression correlation:
| Gene | Promoter | Pearson corr. coef. | P-value | Plot |
|---|---|---|---|---|
| HIC1 | hg19_v2_chr17_+_1959369_1959604 | 0.59 | 4.1e-01 | Click! |