Project
avrg: A549 cells infected with RSV Analysis Results (GEO series: GSE147507)
Navigation
Downloads
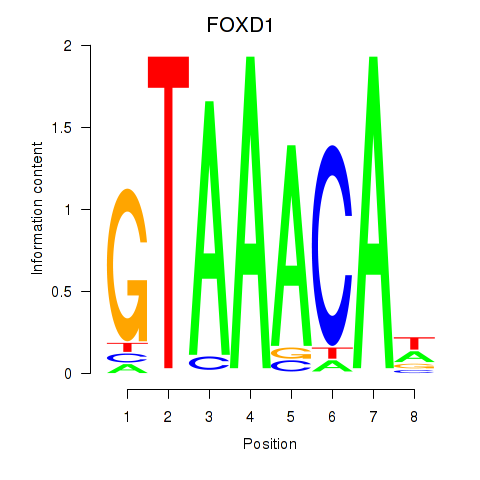
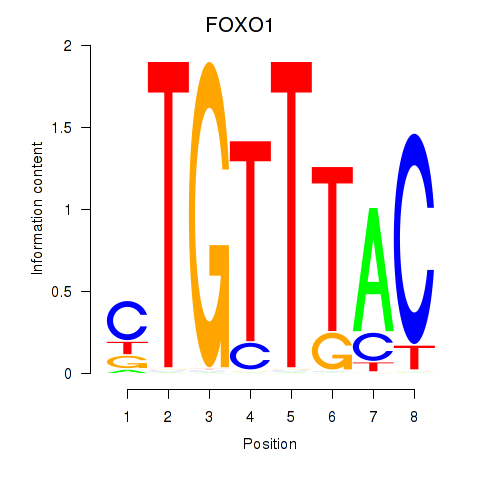
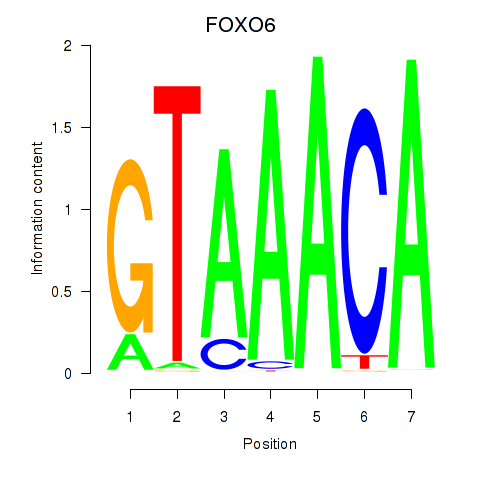
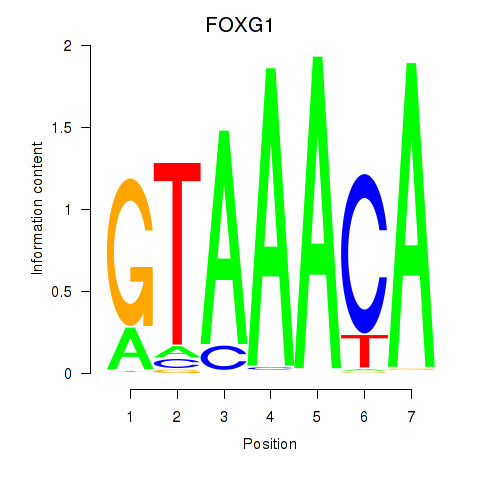
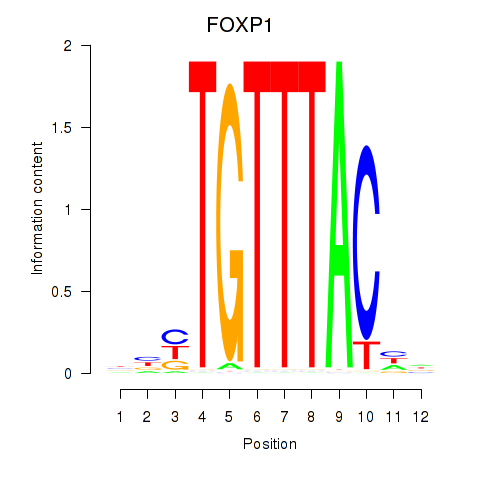
Results for FOXD1_FOXO1_FOXO6_FOXG1_FOXP1
Z-value: 0.91
Motif logo
Transcription factors associated with FOXD1_FOXO1_FOXO6_FOXG1_FOXP1
| Gene Symbol | Gene ID | Gene Info |
|---|---|---|
|
FOXD1
|
ENSG00000251493.2 | forkhead box D1 |
|
FOXO1
|
ENSG00000150907.6 | forkhead box O1 |
|
FOXO6
|
ENSG00000204060.4 | forkhead box O6 |
|
FOXG1
|
ENSG00000176165.7 | forkhead box G1 |
|
FOXP1
|
ENSG00000114861.14 | forkhead box P1 |
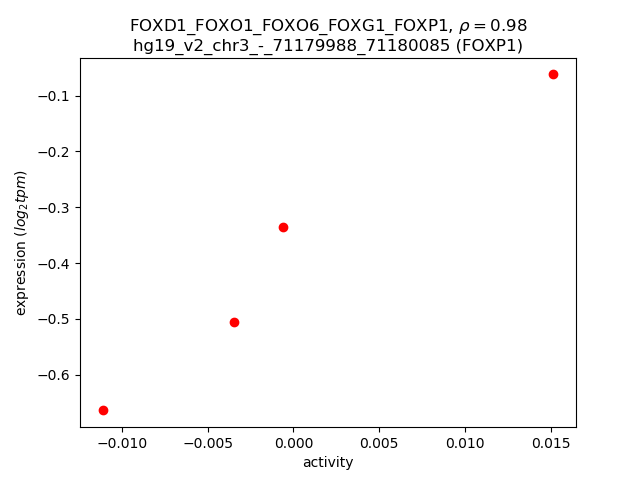
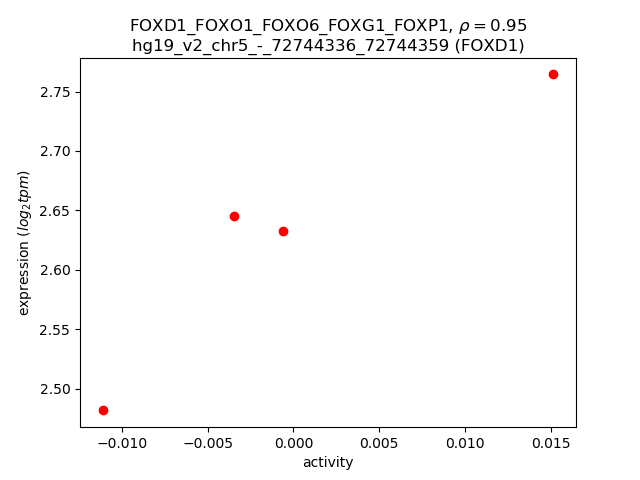
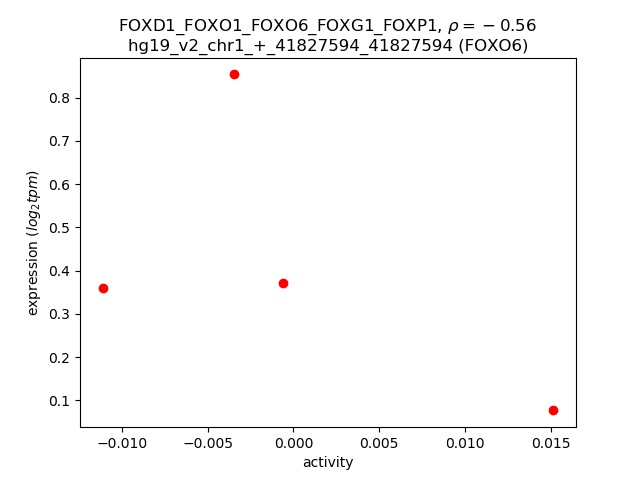
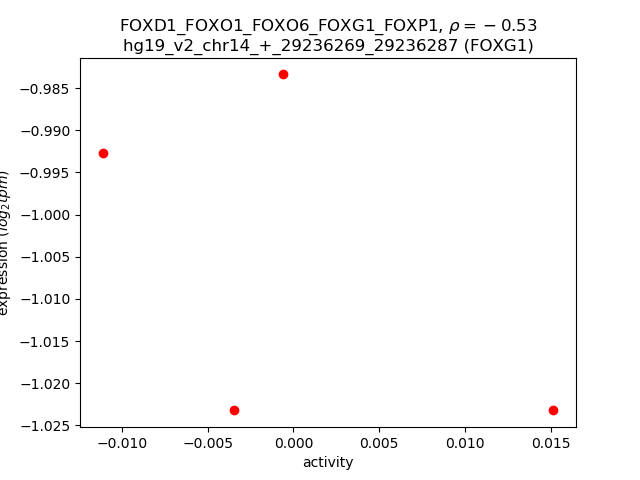
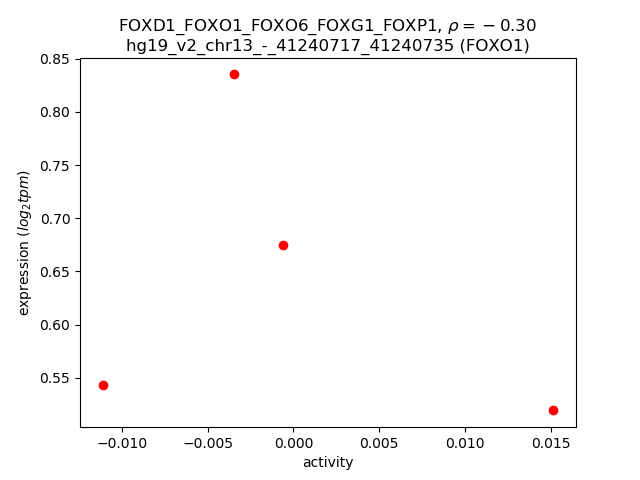
Activity-expression correlation:
| Gene | Promoter | Pearson corr. coef. | P-value | Plot |
|---|---|---|---|---|
| FOXP1 | hg19_v2_chr3_-_71179988_71180085 | 0.98 | 1.7e-02 | Click! |
| FOXD1 | hg19_v2_chr5_-_72744336_72744359 | 0.95 | 5.4e-02 | Click! |
| FOXO6 | hg19_v2_chr1_+_41827594_41827594 | -0.56 | 4.4e-01 | Click! |
| FOXG1 | hg19_v2_chr14_+_29236269_29236287 | -0.53 | 4.7e-01 | Click! |
| FOXO1 | hg19_v2_chr13_-_41240717_41240735 | -0.30 | 7.0e-01 | Click! |