Project
A549 cells infected with IAV Analysis Results (GEO series: GSE147507)
Navigation
Downloads
Results for UGCAUAG
Z-value: 0.71
Motif logo

miRNA associated with seed UGCAUAG
| Name | miRBASE accession |
|---|---|
|
hsa-miR-153-3p
|
MIMAT0000439 |
Activity profile of UGCAUAG motif
Sorted Z-values of UGCAUAG motif
| Promoter | Log-likelihood | Transcript | Gene | Gene Info |
|---|---|---|---|---|
| chr8_-_25315905 | 0.26 |
ENST00000221200.4
|
KCTD9
|
potassium channel tetramerization domain containing 9 |
| chr13_-_77601282 | 0.23 |
ENST00000355619.5
|
FBXL3
|
F-box and leucine-rich repeat protein 3 |
| chr17_-_4269768 | 0.20 |
ENST00000396981.2
|
UBE2G1
|
ubiquitin-conjugating enzyme E2G 1 |
| chr19_+_34919257 | 0.20 |
ENST00000246548.4
ENST00000590048.2 |
UBA2
|
ubiquitin-like modifier activating enzyme 2 |
| chr4_+_184426147 | 0.20 |
ENST00000302327.3
|
ING2
|
inhibitor of growth family, member 2 |
| chr4_+_57774042 | 0.19 |
ENST00000309042.7
|
REST
|
RE1-silencing transcription factor |
| chr20_+_48599506 | 0.18 |
ENST00000244050.2
|
SNAI1
|
snail family zinc finger 1 |
| chr8_+_87354945 | 0.18 |
ENST00000517970.1
|
WWP1
|
WW domain containing E3 ubiquitin protein ligase 1 |
| chr14_+_53196872 | 0.18 |
ENST00000442123.2
ENST00000354586.4 |
STYX
|
serine/threonine/tyrosine interacting protein |
| chr3_+_67048721 | 0.18 |
ENST00000295568.4
ENST00000484414.1 ENST00000460576.1 ENST00000417314.2 |
KBTBD8
|
kelch repeat and BTB (POZ) domain containing 8 |
| chr11_-_123065989 | 0.17 |
ENST00000448775.2
|
CLMP
|
CXADR-like membrane protein |
| chr17_-_31620006 | 0.17 |
ENST00000225823.2
|
ASIC2
|
acid-sensing (proton-gated) ion channel 2 |
| chr4_+_99916765 | 0.16 |
ENST00000296411.6
|
METAP1
|
methionyl aminopeptidase 1 |
| chr21_+_37692481 | 0.16 |
ENST00000400485.1
|
MORC3
|
MORC family CW-type zinc finger 3 |
| chr10_-_119806085 | 0.16 |
ENST00000355624.3
|
RAB11FIP2
|
RAB11 family interacting protein 2 (class I) |
| chr13_-_107187462 | 0.16 |
ENST00000245323.4
|
EFNB2
|
ephrin-B2 |
| chr6_+_11094266 | 0.16 |
ENST00000416247.2
|
SMIM13
|
small integral membrane protein 13 |
| chr2_-_11484710 | 0.16 |
ENST00000315872.6
|
ROCK2
|
Rho-associated, coiled-coil containing protein kinase 2 |
| chr8_-_144512576 | 0.16 |
ENST00000333480.2
|
MAFA
|
v-maf avian musculoaponeurotic fibrosarcoma oncogene homolog A |
| chr2_-_201828356 | 0.15 |
ENST00000234296.2
|
ORC2
|
origin recognition complex, subunit 2 |
| chr17_-_37764128 | 0.15 |
ENST00000302584.4
|
NEUROD2
|
neuronal differentiation 2 |
| chr4_+_39046615 | 0.15 |
ENST00000261425.3
ENST00000508137.2 |
KLHL5
|
kelch-like family member 5 |
| chrX_-_15353629 | 0.15 |
ENST00000333590.4
ENST00000428964.1 ENST00000542278.1 |
PIGA
|
phosphatidylinositol glycan anchor biosynthesis, class A |
| chr13_+_73632897 | 0.15 |
ENST00000377687.4
|
KLF5
|
Kruppel-like factor 5 (intestinal) |
| chr2_+_46926048 | 0.15 |
ENST00000306503.5
|
SOCS5
|
suppressor of cytokine signaling 5 |
| chr5_-_114880533 | 0.15 |
ENST00000274457.3
|
FEM1C
|
fem-1 homolog c (C. elegans) |
| chr15_-_73925651 | 0.15 |
ENST00000545878.1
ENST00000287226.8 ENST00000345330.4 |
NPTN
|
neuroplastin |
| chr20_+_8112824 | 0.15 |
ENST00000378641.3
|
PLCB1
|
phospholipase C, beta 1 (phosphoinositide-specific) |
| chr13_-_45563571 | 0.15 |
ENST00000379161.4
|
NUFIP1
|
nuclear fragile X mental retardation protein interacting protein 1 |
| chr10_-_124768300 | 0.15 |
ENST00000368886.5
|
IKZF5
|
IKAROS family zinc finger 5 (Pegasus) |
| chr5_+_34656331 | 0.14 |
ENST00000265109.3
|
RAI14
|
retinoic acid induced 14 |
| chr2_-_106810783 | 0.14 |
ENST00000283148.7
|
UXS1
|
UDP-glucuronate decarboxylase 1 |
| chr17_-_41836153 | 0.14 |
ENST00000301691.2
|
SOST
|
sclerostin |
| chr5_-_56247935 | 0.13 |
ENST00000381199.3
ENST00000381226.3 ENST00000381213.3 |
MIER3
|
mesoderm induction early response 1, family member 3 |
| chr5_+_179125907 | 0.13 |
ENST00000247461.4
ENST00000452673.2 ENST00000502498.1 ENST00000507307.1 ENST00000513246.1 ENST00000502673.1 ENST00000506654.1 ENST00000512607.2 ENST00000510810.1 |
CANX
|
calnexin |
| chr1_+_43148059 | 0.13 |
ENST00000321358.7
ENST00000332220.6 |
YBX1
|
Y box binding protein 1 |
| chr10_+_86088381 | 0.13 |
ENST00000224756.8
ENST00000372088.2 |
CCSER2
|
coiled-coil serine-rich protein 2 |
| chr6_-_139695757 | 0.13 |
ENST00000367651.2
|
CITED2
|
Cbp/p300-interacting transactivator, with Glu/Asp-rich carboxy-terminal domain, 2 |
| chr2_-_202316260 | 0.13 |
ENST00000332624.3
|
TRAK2
|
trafficking protein, kinesin binding 2 |
| chr4_-_5894777 | 0.13 |
ENST00000324989.7
|
CRMP1
|
collapsin response mediator protein 1 |
| chr1_-_222885770 | 0.13 |
ENST00000355727.2
ENST00000340020.6 |
AIDA
|
axin interactor, dorsalization associated |
| chr4_+_144257915 | 0.13 |
ENST00000262995.4
|
GAB1
|
GRB2-associated binding protein 1 |
| chr1_-_95392635 | 0.13 |
ENST00000538964.1
ENST00000394202.4 ENST00000370206.4 |
CNN3
|
calponin 3, acidic |
| chr17_-_48785216 | 0.12 |
ENST00000285243.6
|
ANKRD40
|
ankyrin repeat domain 40 |
| chr15_-_52861394 | 0.12 |
ENST00000563277.1
ENST00000566423.1 |
ARPP19
|
cAMP-regulated phosphoprotein, 19kDa |
| chr17_+_29421900 | 0.12 |
ENST00000358273.4
ENST00000356175.3 |
NF1
|
neurofibromin 1 |
| chr2_-_178128528 | 0.12 |
ENST00000397063.4
ENST00000421929.1 |
NFE2L2
|
nuclear factor, erythroid 2-like 2 |
| chr2_+_109204909 | 0.12 |
ENST00000393310.1
|
LIMS1
|
LIM and senescent cell antigen-like domains 1 |
| chr2_+_70056762 | 0.12 |
ENST00000282570.3
|
GMCL1
|
germ cell-less, spermatogenesis associated 1 |
| chr15_+_38544476 | 0.12 |
ENST00000299084.4
|
SPRED1
|
sprouty-related, EVH1 domain containing 1 |
| chr1_+_182992545 | 0.12 |
ENST00000258341.4
|
LAMC1
|
laminin, gamma 1 (formerly LAMB2) |
| chr1_+_159141397 | 0.12 |
ENST00000368124.4
ENST00000368125.4 ENST00000416746.1 |
CADM3
|
cell adhesion molecule 3 |
| chrX_-_19905703 | 0.12 |
ENST00000397821.3
|
SH3KBP1
|
SH3-domain kinase binding protein 1 |
| chr12_+_110719032 | 0.12 |
ENST00000395494.2
|
ATP2A2
|
ATPase, Ca++ transporting, cardiac muscle, slow twitch 2 |
| chr17_-_30669138 | 0.12 |
ENST00000225805.4
ENST00000577809.1 |
C17orf75
|
chromosome 17 open reading frame 75 |
| chr5_-_179780312 | 0.12 |
ENST00000253778.8
|
GFPT2
|
glutamine-fructose-6-phosphate transaminase 2 |
| chr5_+_67511524 | 0.12 |
ENST00000521381.1
ENST00000521657.1 |
PIK3R1
|
phosphoinositide-3-kinase, regulatory subunit 1 (alpha) |
| chr8_-_74884511 | 0.12 |
ENST00000518127.1
|
TCEB1
|
transcription elongation factor B (SIII), polypeptide 1 (15kDa, elongin C) |
| chr3_+_179065474 | 0.11 |
ENST00000471841.1
ENST00000280653.7 |
MFN1
|
mitofusin 1 |
| chr17_+_65821780 | 0.11 |
ENST00000321892.4
ENST00000335221.5 ENST00000306378.6 |
BPTF
|
bromodomain PHD finger transcription factor |
| chr10_+_180987 | 0.11 |
ENST00000381591.1
|
ZMYND11
|
zinc finger, MYND-type containing 11 |
| chr8_+_79578282 | 0.11 |
ENST00000263849.4
|
ZC2HC1A
|
zinc finger, C2HC-type containing 1A |
| chr2_+_109335929 | 0.11 |
ENST00000283195.6
|
RANBP2
|
RAN binding protein 2 |
| chr2_+_219283815 | 0.11 |
ENST00000248444.5
ENST00000454069.1 ENST00000392114.2 |
VIL1
|
villin 1 |
| chr4_+_108745711 | 0.11 |
ENST00000394684.4
|
SGMS2
|
sphingomyelin synthase 2 |
| chr2_-_148778258 | 0.11 |
ENST00000392857.5
ENST00000457954.1 ENST00000392858.1 ENST00000542387.1 |
ORC4
|
origin recognition complex, subunit 4 |
| chr12_+_93965451 | 0.11 |
ENST00000548537.1
|
SOCS2
|
suppressor of cytokine signaling 2 |
| chr7_-_139876812 | 0.11 |
ENST00000397560.2
|
JHDM1D
|
lysine (K)-specific demethylase 7A |
| chr13_+_108870714 | 0.11 |
ENST00000375898.3
|
ABHD13
|
abhydrolase domain containing 13 |
| chr4_+_48343339 | 0.11 |
ENST00000264313.6
|
SLAIN2
|
SLAIN motif family, member 2 |
| chr5_-_133968529 | 0.11 |
ENST00000402673.2
|
SAR1B
|
SAR1 homolog B (S. cerevisiae) |
| chrX_+_146993449 | 0.10 |
ENST00000218200.8
ENST00000370471.3 ENST00000370477.1 |
FMR1
|
fragile X mental retardation 1 |
| chr2_+_54683419 | 0.10 |
ENST00000356805.4
|
SPTBN1
|
spectrin, beta, non-erythrocytic 1 |
| chr7_+_89841000 | 0.10 |
ENST00000287908.3
|
STEAP2
|
STEAP family member 2, metalloreductase |
| chr21_-_43430440 | 0.10 |
ENST00000398505.3
ENST00000310826.5 ENST00000449949.1 ENST00000398499.1 ENST00000398497.2 ENST00000398511.3 |
ZBTB21
|
zinc finger and BTB domain containing 21 |
| chr3_+_128444965 | 0.10 |
ENST00000265062.3
|
RAB7A
|
RAB7A, member RAS oncogene family |
| chr3_+_111717511 | 0.10 |
ENST00000478951.1
ENST00000393917.2 |
TAGLN3
|
transgelin 3 |
| chr11_-_18656028 | 0.10 |
ENST00000336349.5
|
SPTY2D1
|
SPT2, Suppressor of Ty, domain containing 1 (S. cerevisiae) |
| chr20_-_10654639 | 0.10 |
ENST00000254958.5
|
JAG1
|
jagged 1 |
| chr15_-_72612470 | 0.10 |
ENST00000287202.5
|
CELF6
|
CUGBP, Elav-like family member 6 |
| chr8_-_57906362 | 0.10 |
ENST00000262644.4
|
IMPAD1
|
inositol monophosphatase domain containing 1 |
| chr6_+_116601265 | 0.10 |
ENST00000452085.3
|
DSE
|
dermatan sulfate epimerase |
| chr2_-_180129484 | 0.09 |
ENST00000428443.3
|
SESTD1
|
SEC14 and spectrin domains 1 |
| chr16_+_66914264 | 0.09 |
ENST00000311765.2
ENST00000568869.1 ENST00000561704.1 ENST00000568398.1 ENST00000566776.1 |
PDP2
|
pyruvate dehyrogenase phosphatase catalytic subunit 2 |
| chr11_+_33278811 | 0.09 |
ENST00000303296.4
ENST00000379016.3 |
HIPK3
|
homeodomain interacting protein kinase 3 |
| chr14_+_103058948 | 0.09 |
ENST00000262241.6
|
RCOR1
|
REST corepressor 1 |
| chr5_+_86564739 | 0.09 |
ENST00000456692.2
ENST00000512763.1 ENST00000506290.1 |
RASA1
|
RAS p21 protein activator (GTPase activating protein) 1 |
| chr19_+_36706024 | 0.09 |
ENST00000443387.2
|
ZNF146
|
zinc finger protein 146 |
| chr1_+_41249539 | 0.09 |
ENST00000347132.5
ENST00000509682.2 |
KCNQ4
|
potassium voltage-gated channel, KQT-like subfamily, member 4 |
| chr3_-_101232019 | 0.09 |
ENST00000394095.2
ENST00000394091.1 ENST00000394094.2 ENST00000358203.3 ENST00000348610.3 ENST00000314261.7 |
SENP7
|
SUMO1/sentrin specific peptidase 7 |
| chr2_-_37193606 | 0.09 |
ENST00000379213.2
ENST00000263918.4 |
STRN
|
striatin, calmodulin binding protein |
| chr6_-_84140757 | 0.09 |
ENST00000541327.1
ENST00000369705.3 ENST00000543031.1 |
ME1
|
malic enzyme 1, NADP(+)-dependent, cytosolic |
| chr20_+_10199468 | 0.09 |
ENST00000254976.2
ENST00000304886.2 |
SNAP25
|
synaptosomal-associated protein, 25kDa |
| chr11_+_9406169 | 0.09 |
ENST00000379719.3
ENST00000527431.1 |
IPO7
|
importin 7 |
| chr12_+_54402790 | 0.09 |
ENST00000040584.4
|
HOXC8
|
homeobox C8 |
| chr12_+_4918342 | 0.09 |
ENST00000280684.3
ENST00000433855.1 |
KCNA6
|
potassium voltage-gated channel, shaker-related subfamily, member 6 |
| chr4_+_77870856 | 0.09 |
ENST00000264893.6
ENST00000502584.1 ENST00000510641.1 |
SEPT11
|
septin 11 |
| chr10_-_75634260 | 0.09 |
ENST00000372765.1
ENST00000351293.3 |
CAMK2G
|
calcium/calmodulin-dependent protein kinase II gamma |
| chr3_+_180630090 | 0.09 |
ENST00000357559.4
ENST00000305586.7 |
FXR1
|
fragile X mental retardation, autosomal homolog 1 |
| chr3_+_197476621 | 0.08 |
ENST00000241502.4
|
FYTTD1
|
forty-two-three domain containing 1 |
| chr10_-_94333784 | 0.08 |
ENST00000265986.6
|
IDE
|
insulin-degrading enzyme |
| chr4_-_90758227 | 0.08 |
ENST00000506691.1
ENST00000394986.1 ENST00000506244.1 ENST00000394989.2 ENST00000394991.3 |
SNCA
|
synuclein, alpha (non A4 component of amyloid precursor) |
| chr5_+_80256453 | 0.08 |
ENST00000265080.4
|
RASGRF2
|
Ras protein-specific guanine nucleotide-releasing factor 2 |
| chr4_+_26862400 | 0.08 |
ENST00000467011.1
ENST00000412829.2 |
STIM2
|
stromal interaction molecule 2 |
| chr13_-_36705425 | 0.08 |
ENST00000255448.4
ENST00000360631.3 ENST00000379892.4 |
DCLK1
|
doublecortin-like kinase 1 |
| chr3_-_171178157 | 0.08 |
ENST00000465393.1
ENST00000436636.2 ENST00000369326.5 ENST00000538048.1 ENST00000341852.6 |
TNIK
|
TRAF2 and NCK interacting kinase |
| chr1_+_78470530 | 0.08 |
ENST00000370763.5
|
DNAJB4
|
DnaJ (Hsp40) homolog, subfamily B, member 4 |
| chr14_-_53417732 | 0.08 |
ENST00000399304.3
ENST00000395631.2 ENST00000341590.3 ENST00000343279.4 |
FERMT2
|
fermitin family member 2 |
| chr21_-_34144157 | 0.08 |
ENST00000331923.4
|
PAXBP1
|
PAX3 and PAX7 binding protein 1 |
| chr10_-_32636106 | 0.08 |
ENST00000263062.8
ENST00000319778.6 |
EPC1
|
enhancer of polycomb homolog 1 (Drosophila) |
| chr2_-_242212227 | 0.08 |
ENST00000427007.1
ENST00000458564.1 ENST00000452065.1 ENST00000427183.2 ENST00000426343.1 ENST00000422080.1 ENST00000449504.1 ENST00000449864.1 ENST00000391975.1 |
HDLBP
|
high density lipoprotein binding protein |
| chr2_+_148602058 | 0.08 |
ENST00000241416.7
ENST00000535787.1 ENST00000404590.1 |
ACVR2A
|
activin A receptor, type IIA |
| chr15_-_42840961 | 0.08 |
ENST00000563454.1
ENST00000397130.3 ENST00000570160.1 ENST00000323443.2 |
LRRC57
|
leucine rich repeat containing 57 |
| chr4_-_25032501 | 0.08 |
ENST00000382114.4
|
LGI2
|
leucine-rich repeat LGI family, member 2 |
| chr5_-_59189545 | 0.08 |
ENST00000340635.6
|
PDE4D
|
phosphodiesterase 4D, cAMP-specific |
| chr11_+_129939779 | 0.08 |
ENST00000533195.1
ENST00000533713.1 ENST00000528499.1 ENST00000539648.1 ENST00000263574.5 |
APLP2
|
amyloid beta (A4) precursor-like protein 2 |
| chr8_-_133493200 | 0.08 |
ENST00000388996.4
|
KCNQ3
|
potassium voltage-gated channel, KQT-like subfamily, member 3 |
| chr2_-_24583168 | 0.08 |
ENST00000361999.3
|
ITSN2
|
intersectin 2 |
| chr15_-_52821247 | 0.08 |
ENST00000399231.3
ENST00000399233.2 |
MYO5A
|
myosin VA (heavy chain 12, myoxin) |
| chr2_-_64371546 | 0.08 |
ENST00000358912.4
|
PELI1
|
pellino E3 ubiquitin protein ligase 1 |
| chr18_-_18691739 | 0.08 |
ENST00000399799.2
|
ROCK1
|
Rho-associated, coiled-coil containing protein kinase 1 |
| chr5_+_112043186 | 0.08 |
ENST00000509732.1
ENST00000457016.1 ENST00000507379.1 |
APC
|
adenomatous polyposis coli |
| chr7_+_7606497 | 0.08 |
ENST00000340080.4
ENST00000405785.1 ENST00000433635.1 |
MIOS
|
missing oocyte, meiosis regulator, homolog (Drosophila) |
| chrX_+_16804544 | 0.08 |
ENST00000380122.5
ENST00000398155.4 |
TXLNG
|
taxilin gamma |
| chr1_+_95582881 | 0.08 |
ENST00000370203.4
ENST00000456991.1 |
TMEM56
|
transmembrane protein 56 |
| chr1_+_24829384 | 0.08 |
ENST00000374395.4
ENST00000436717.2 |
RCAN3
|
RCAN family member 3 |
| chr4_+_174089904 | 0.08 |
ENST00000265000.4
|
GALNT7
|
UDP-N-acetyl-alpha-D-galactosamine:polypeptide N-acetylgalactosaminyltransferase 7 (GalNAc-T7) |
| chr9_-_125693757 | 0.08 |
ENST00000373656.3
|
ZBTB26
|
zinc finger and BTB domain containing 26 |
| chr1_-_6259641 | 0.08 |
ENST00000234875.4
|
RPL22
|
ribosomal protein L22 |
| chr2_+_179345173 | 0.08 |
ENST00000234453.5
|
PLEKHA3
|
pleckstrin homology domain containing, family A (phosphoinositide binding specific) member 3 |
| chr13_+_51796497 | 0.08 |
ENST00000322475.8
ENST00000280057.6 |
FAM124A
|
family with sequence similarity 124A |
| chr10_-_103599591 | 0.08 |
ENST00000348850.5
|
KCNIP2
|
Kv channel interacting protein 2 |
| chr5_-_98262240 | 0.08 |
ENST00000284049.3
|
CHD1
|
chromodomain helicase DNA binding protein 1 |
| chr13_-_41240717 | 0.07 |
ENST00000379561.5
|
FOXO1
|
forkhead box O1 |
| chr3_+_128997648 | 0.07 |
ENST00000509042.1
ENST00000383463.4 ENST00000417226.2 ENST00000510314.1 |
HMCES
|
5-hydroxymethylcytosine (hmC) binding, ES cell-specific |
| chr7_+_5085452 | 0.07 |
ENST00000353796.3
ENST00000396912.1 ENST00000396904.2 |
RBAK
RBAK-RBAKDN
|
RB-associated KRAB zinc finger RBAK-RBAKDN readthrough |
| chr7_+_21467642 | 0.07 |
ENST00000222584.3
ENST00000432066.2 |
SP4
|
Sp4 transcription factor |
| chr8_-_41655107 | 0.07 |
ENST00000347528.4
ENST00000289734.7 ENST00000379758.2 ENST00000396945.1 ENST00000396942.1 ENST00000352337.4 |
ANK1
|
ankyrin 1, erythrocytic |
| chr1_+_228270361 | 0.07 |
ENST00000272102.5
ENST00000540651.1 |
ARF1
|
ADP-ribosylation factor 1 |
| chr4_+_2845547 | 0.07 |
ENST00000264758.7
ENST00000446856.1 ENST00000398125.1 |
ADD1
|
adducin 1 (alpha) |
| chr18_-_61034743 | 0.07 |
ENST00000406396.3
|
KDSR
|
3-ketodihydrosphingosine reductase |
| chr15_+_101142722 | 0.07 |
ENST00000332783.7
ENST00000558747.1 ENST00000343276.4 |
ASB7
|
ankyrin repeat and SOCS box containing 7 |
| chr2_-_222436988 | 0.07 |
ENST00000409854.1
ENST00000281821.2 ENST00000392071.4 ENST00000443796.1 |
EPHA4
|
EPH receptor A4 |
| chr9_+_91150016 | 0.07 |
ENST00000375854.3
ENST00000375855.3 |
NXNL2
|
nucleoredoxin-like 2 |
| chr1_-_212004090 | 0.07 |
ENST00000366997.4
|
LPGAT1
|
lysophosphatidylglycerol acyltransferase 1 |
| chr10_-_114206649 | 0.07 |
ENST00000369404.3
ENST00000369405.3 |
ZDHHC6
|
zinc finger, DHHC-type containing 6 |
| chr8_+_17013515 | 0.07 |
ENST00000262096.8
|
ZDHHC2
|
zinc finger, DHHC-type containing 2 |
| chr1_+_213123915 | 0.07 |
ENST00000366968.4
ENST00000490792.1 |
VASH2
|
vasohibin 2 |
| chr5_+_134181625 | 0.07 |
ENST00000394976.3
|
C5orf24
|
chromosome 5 open reading frame 24 |
| chr1_+_179851410 | 0.07 |
ENST00000271583.3
ENST00000606911.2 |
TOR1AIP1
|
torsin A interacting protein 1 |
| chr9_+_129567282 | 0.07 |
ENST00000449886.1
ENST00000373464.4 ENST00000450858.1 |
ZBTB43
|
zinc finger and BTB domain containing 43 |
| chr8_+_37620097 | 0.07 |
ENST00000328195.3
ENST00000523358.1 ENST00000523187.1 |
PROSC
|
proline synthetase co-transcribed homolog (bacterial) |
| chr18_-_23670546 | 0.07 |
ENST00000542743.1
ENST00000545952.1 ENST00000539849.1 ENST00000415083.2 |
SS18
|
synovial sarcoma translocation, chromosome 18 |
| chr9_+_125703282 | 0.07 |
ENST00000373647.4
ENST00000402311.1 |
RABGAP1
|
RAB GTPase activating protein 1 |
| chr14_+_103243813 | 0.07 |
ENST00000560371.1
ENST00000347662.4 ENST00000392745.2 ENST00000539721.1 ENST00000560463.1 |
TRAF3
|
TNF receptor-associated factor 3 |
| chr8_-_74791051 | 0.07 |
ENST00000453587.2
ENST00000602969.1 ENST00000602593.1 ENST00000419880.3 ENST00000517608.1 |
UBE2W
|
ubiquitin-conjugating enzyme E2W (putative) |
| chr4_-_185395672 | 0.07 |
ENST00000393593.3
|
IRF2
|
interferon regulatory factor 2 |
| chr21_-_19191703 | 0.07 |
ENST00000284881.4
ENST00000400559.3 ENST00000400558.3 |
C21orf91
|
chromosome 21 open reading frame 91 |
| chr17_+_58677539 | 0.07 |
ENST00000305921.3
|
PPM1D
|
protein phosphatase, Mg2+/Mn2+ dependent, 1D |
| chr5_+_137514687 | 0.07 |
ENST00000394894.3
|
KIF20A
|
kinesin family member 20A |
| chr5_-_39425068 | 0.06 |
ENST00000515700.1
ENST00000339788.6 |
DAB2
|
Dab, mitogen-responsive phosphoprotein, homolog 2 (Drosophila) |
| chr1_+_89149905 | 0.06 |
ENST00000316005.7
ENST00000370521.3 ENST00000370505.3 |
PKN2
|
protein kinase N2 |
| chr7_+_115850547 | 0.06 |
ENST00000358204.4
ENST00000455989.1 ENST00000537767.1 |
TES
|
testis derived transcript (3 LIM domains) |
| chr8_-_105601134 | 0.06 |
ENST00000276654.5
ENST00000424843.2 |
LRP12
|
low density lipoprotein receptor-related protein 12 |
| chr13_+_47127293 | 0.06 |
ENST00000311191.6
|
LRCH1
|
leucine-rich repeats and calponin homology (CH) domain containing 1 |
| chr12_-_106641728 | 0.06 |
ENST00000378026.4
|
CKAP4
|
cytoskeleton-associated protein 4 |
| chr21_-_27542972 | 0.06 |
ENST00000346798.3
ENST00000439274.2 ENST00000354192.3 ENST00000348990.5 ENST00000357903.3 ENST00000358918.3 ENST00000359726.3 |
APP
|
amyloid beta (A4) precursor protein |
| chr2_+_179059365 | 0.06 |
ENST00000190611.4
|
OSBPL6
|
oxysterol binding protein-like 6 |
| chr1_-_236445251 | 0.06 |
ENST00000354619.5
ENST00000327333.8 |
ERO1LB
|
ERO1-like beta (S. cerevisiae) |
| chr17_-_49337392 | 0.06 |
ENST00000376381.2
ENST00000586178.1 |
MBTD1
|
mbt domain containing 1 |
| chr11_+_120382417 | 0.06 |
ENST00000527524.2
ENST00000375081.2 |
GRIK4
AP002348.1
|
glutamate receptor, ionotropic, kainate 4 Uncharacterized protein |
| chr3_-_123304017 | 0.06 |
ENST00000383657.5
|
PTPLB
|
protein tyrosine phosphatase-like (proline instead of catalytic arginine), member b |
| chr8_+_28351707 | 0.06 |
ENST00000537916.1
ENST00000523546.1 ENST00000240093.3 |
FZD3
|
frizzled family receptor 3 |
| chr9_+_108210279 | 0.06 |
ENST00000374716.4
ENST00000374710.3 ENST00000481272.1 ENST00000484973.1 ENST00000394926.3 ENST00000539376.1 |
FSD1L
|
fibronectin type III and SPRY domain containing 1-like |
| chr20_-_60640866 | 0.06 |
ENST00000252996.4
|
TAF4
|
TAF4 RNA polymerase II, TATA box binding protein (TBP)-associated factor, 135kDa |
| chr12_-_49110613 | 0.06 |
ENST00000261900.3
|
CCNT1
|
cyclin T1 |
| chr14_+_36295504 | 0.06 |
ENST00000216807.7
|
BRMS1L
|
breast cancer metastasis-suppressor 1-like |
| chr1_+_228870824 | 0.06 |
ENST00000366691.3
|
RHOU
|
ras homolog family member U |
| chr5_-_77590480 | 0.06 |
ENST00000519295.1
ENST00000255194.6 |
AP3B1
|
adaptor-related protein complex 3, beta 1 subunit |
| chr1_-_57889687 | 0.06 |
ENST00000371236.2
ENST00000371230.1 |
DAB1
|
Dab, reelin signal transducer, homolog 1 (Drosophila) |
| chr5_-_2751762 | 0.06 |
ENST00000302057.5
ENST00000382611.6 |
IRX2
|
iroquois homeobox 2 |
| chrX_-_18372792 | 0.06 |
ENST00000251900.4
|
SCML2
|
sex comb on midleg-like 2 (Drosophila) |
| chr6_+_64345698 | 0.06 |
ENST00000506783.1
ENST00000481385.2 ENST00000515594.1 ENST00000494284.2 ENST00000262043.3 |
PHF3
|
PHD finger protein 3 |
| chr12_-_46662772 | 0.06 |
ENST00000549049.1
ENST00000439706.1 ENST00000398637.5 |
SLC38A1
|
solute carrier family 38, member 1 |
| chr4_-_21699380 | 0.06 |
ENST00000382148.3
|
KCNIP4
|
Kv channel interacting protein 4 |
| chr18_+_60190226 | 0.06 |
ENST00000269499.5
|
ZCCHC2
|
zinc finger, CCHC domain containing 2 |
| chr6_-_71666732 | 0.06 |
ENST00000230053.6
|
B3GAT2
|
beta-1,3-glucuronyltransferase 2 (glucuronosyltransferase S) |
| chr1_+_40505891 | 0.06 |
ENST00000372797.3
ENST00000372802.1 ENST00000449311.1 |
CAP1
|
CAP, adenylate cyclase-associated protein 1 (yeast) |
| chr1_+_110091189 | 0.06 |
ENST00000369851.4
|
GNAI3
|
guanine nucleotide binding protein (G protein), alpha inhibiting activity polypeptide 3 |
| chr12_-_67072714 | 0.06 |
ENST00000545666.1
ENST00000398016.3 ENST00000359742.4 ENST00000286445.7 ENST00000538211.1 |
GRIP1
|
glutamate receptor interacting protein 1 |
| chr4_-_41216619 | 0.06 |
ENST00000508676.1
ENST00000506352.1 ENST00000295974.8 |
APBB2
|
amyloid beta (A4) precursor protein-binding, family B, member 2 |
| chr1_+_197881592 | 0.06 |
ENST00000367391.1
ENST00000367390.3 |
LHX9
|
LIM homeobox 9 |
| chr2_-_64881018 | 0.06 |
ENST00000313349.3
|
SERTAD2
|
SERTA domain containing 2 |
| chr6_-_99395787 | 0.06 |
ENST00000369244.2
ENST00000229971.1 |
FBXL4
|
F-box and leucine-rich repeat protein 4 |
| chr4_+_184020398 | 0.06 |
ENST00000403733.3
ENST00000378925.3 |
WWC2
|
WW and C2 domain containing 2 |
| chr13_+_25875662 | 0.05 |
ENST00000381736.3
ENST00000463407.1 ENST00000381718.3 |
NUPL1
|
nucleoporin like 1 |
| chrX_+_12156582 | 0.05 |
ENST00000380682.1
|
FRMPD4
|
FERM and PDZ domain containing 4 |
| chr11_-_94227029 | 0.05 |
ENST00000323977.3
ENST00000536754.1 ENST00000323929.3 |
MRE11A
|
MRE11 meiotic recombination 11 homolog A (S. cerevisiae) |
| chr6_-_106773491 | 0.05 |
ENST00000360666.4
|
ATG5
|
autophagy related 5 |
| chr2_-_174830430 | 0.05 |
ENST00000310015.6
ENST00000455789.2 |
SP3
|
Sp3 transcription factor |
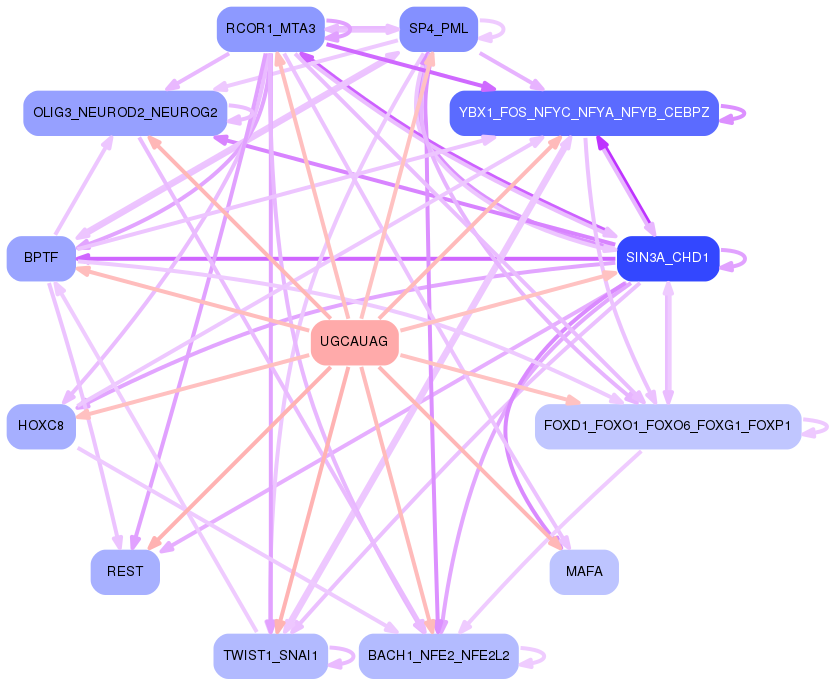
Network of associatons between targets according to the STRING database.

First level regulatory network of UGCAUAG
Gene Ontology Analysis
Gene overrepresentation in biological_process category:
| Log-likelihood per target | Total log-likelihood | Term | Description |
|---|---|---|---|
| 0.1 | 0.2 | GO:2000705 | dense core granule biogenesis(GO:0061110) regulation of dense core granule biogenesis(GO:2000705) |
| 0.0 | 0.1 | GO:0035696 | monocyte extravasation(GO:0035696) regulation of fertilization(GO:0080154) activation of meiosis(GO:0090427) regulation of monocyte extravasation(GO:2000437) |
| 0.0 | 0.1 | GO:0033320 | UDP-D-xylose metabolic process(GO:0033319) UDP-D-xylose biosynthetic process(GO:0033320) |
| 0.0 | 0.2 | GO:1903347 | negative regulation of bicellular tight junction assembly(GO:1903347) |
| 0.0 | 0.1 | GO:0098939 | dendritic transport of mitochondrion(GO:0098939) anterograde dendritic transport of mitochondrion(GO:0098972) |
| 0.0 | 0.1 | GO:1904530 | negative regulation of actin filament binding(GO:1904530) negative regulation of actin binding(GO:1904617) |
| 0.0 | 0.1 | GO:0061534 | gamma-aminobutyric acid secretion, neurotransmission(GO:0061534) |
| 0.0 | 0.2 | GO:0048133 | germ-line stem cell division(GO:0042078) male germ-line stem cell asymmetric division(GO:0048133) germline stem cell asymmetric division(GO:0098728) |
| 0.0 | 0.1 | GO:1903515 | calcium ion transport from cytosol to endoplasmic reticulum(GO:1903515) |
| 0.0 | 0.1 | GO:1902683 | positive regulation of long-term neuronal synaptic plasticity(GO:0048170) regulation of receptor localization to synapse(GO:1902683) |
| 0.0 | 0.1 | GO:1901254 | modulation by host of viral RNA genome replication(GO:0044830) positive regulation of intracellular transport of viral material(GO:1901254) |
| 0.0 | 0.1 | GO:2000053 | regulation of Wnt signaling pathway involved in dorsal/ventral axis specification(GO:2000053) |
| 0.0 | 0.1 | GO:0061073 | ciliary body morphogenesis(GO:0061073) |
| 0.0 | 0.2 | GO:0060800 | regulation of cell differentiation involved in embryonic placenta development(GO:0060800) |
| 0.0 | 0.2 | GO:0050915 | sensory perception of sour taste(GO:0050915) |
| 0.0 | 0.1 | GO:0090526 | regulation of gluconeogenesis involved in cellular glucose homeostasis(GO:0090526) |
| 0.0 | 0.1 | GO:0035262 | gonad morphogenesis(GO:0035262) |
| 0.0 | 0.1 | GO:0051795 | positive regulation of catagen(GO:0051795) |
| 0.0 | 0.1 | GO:0035802 | adrenal cortex development(GO:0035801) adrenal cortex formation(GO:0035802) |
| 0.0 | 0.2 | GO:0045204 | MAPK export from nucleus(GO:0045204) |
| 0.0 | 0.1 | GO:1903542 | negative regulation of exosomal secretion(GO:1903542) |
| 0.0 | 0.1 | GO:1902824 | cleavage furrow ingression(GO:0036090) positive regulation of late endosome to lysosome transport(GO:1902824) |
| 0.0 | 0.1 | GO:0060979 | vasculogenesis involved in coronary vascular morphogenesis(GO:0060979) |
| 0.0 | 0.1 | GO:0097156 | fasciculation of motor neuron axon(GO:0097156) |
| 0.0 | 0.1 | GO:1990926 | short-term synaptic potentiation(GO:1990926) |
| 0.0 | 0.1 | GO:1901143 | insulin catabolic process(GO:1901143) |
| 0.0 | 0.1 | GO:0008063 | Toll signaling pathway(GO:0008063) |
| 0.0 | 0.1 | GO:0010847 | regulation of chromatin assembly(GO:0010847) |
| 0.0 | 0.1 | GO:0048003 | antigen processing and presentation of lipid antigen via MHC class Ib(GO:0048003) antigen processing and presentation, exogenous lipid antigen via MHC class Ib(GO:0048007) |
| 0.0 | 0.1 | GO:0021577 | hindbrain structural organization(GO:0021577) cerebellum structural organization(GO:0021589) spinal cord motor neuron migration(GO:0097476) lateral motor column neuron migration(GO:0097477) |
| 0.0 | 0.1 | GO:0072081 | proximal/distal pattern formation involved in nephron development(GO:0072047) specification of nephron tubule identity(GO:0072081) pattern specification involved in metanephros development(GO:0072268) |
| 0.0 | 0.1 | GO:0046223 | mycotoxin catabolic process(GO:0043387) aflatoxin catabolic process(GO:0046223) organic heteropentacyclic compound catabolic process(GO:1901377) regulation of glutathione biosynthetic process(GO:1903786) positive regulation of glutathione biosynthetic process(GO:1903788) |
| 0.0 | 0.1 | GO:1900042 | positive regulation of interleukin-2 secretion(GO:1900042) |
| 0.0 | 0.1 | GO:0051945 | negative regulation of dopamine uptake involved in synaptic transmission(GO:0051585) norepinephrine uptake(GO:0051620) regulation of norepinephrine uptake(GO:0051621) negative regulation of norepinephrine uptake(GO:0051622) negative regulation of catecholamine uptake involved in synaptic transmission(GO:0051945) regulation of glutathione peroxidase activity(GO:1903282) positive regulation of glutathione peroxidase activity(GO:1903284) positive regulation of hydrogen peroxide catabolic process(GO:1903285) positive regulation of peroxidase activity(GO:2000470) |
| 0.0 | 0.2 | GO:0045629 | negative regulation of T-helper 2 cell differentiation(GO:0045629) |
| 0.0 | 0.1 | GO:0060011 | Sertoli cell proliferation(GO:0060011) |
| 0.0 | 0.1 | GO:1902896 | terminal web assembly(GO:1902896) |
| 0.0 | 0.2 | GO:0032534 | regulation of microvillus assembly(GO:0032534) |
| 0.0 | 0.0 | GO:0098904 | left ventricular cardiac muscle tissue morphogenesis(GO:0003220) regulation of AV node cell action potential(GO:0098904) positive regulation of calcium-transporting ATPase activity(GO:1901896) |
| 0.0 | 0.2 | GO:1903608 | protein localization to cytoplasmic stress granule(GO:1903608) |
| 0.0 | 0.1 | GO:2000619 | negative regulation of histone H4-K16 acetylation(GO:2000619) |
| 0.0 | 0.1 | GO:1904885 | beta-catenin destruction complex assembly(GO:1904885) |
| 0.0 | 0.1 | GO:0051643 | regulation of inositol 1,4,5-trisphosphate-sensitive calcium-release channel activity(GO:0031585) endoplasmic reticulum localization(GO:0051643) |
| 0.0 | 0.1 | GO:0098706 | ferric iron import into cell(GO:0097461) ferric iron import across plasma membrane(GO:0098706) |
| 0.0 | 0.0 | GO:0018008 | N-terminal peptidyl-glycine N-myristoylation(GO:0018008) |
| 0.0 | 0.1 | GO:1902031 | regulation of NADP metabolic process(GO:1902031) |
| 0.0 | 0.2 | GO:0014029 | neural crest formation(GO:0014029) |
| 0.0 | 0.1 | GO:0045163 | clustering of voltage-gated potassium channels(GO:0045163) |
| 0.0 | 0.1 | GO:0035947 | regulation of gluconeogenesis by regulation of transcription from RNA polymerase II promoter(GO:0035947) |
| 0.0 | 0.1 | GO:0071874 | cellular response to norepinephrine stimulus(GO:0071874) |
| 0.0 | 0.2 | GO:0018206 | peptidyl-methionine modification(GO:0018206) |
| 0.0 | 0.2 | GO:0010839 | negative regulation of keratinocyte proliferation(GO:0010839) |
| 0.0 | 0.1 | GO:1904693 | negative regulation of mitotic cell cycle, embryonic(GO:0045976) midbrain morphogenesis(GO:1904693) |
| 0.0 | 0.1 | GO:0061074 | regulation of neural retina development(GO:0061074) |
| 0.0 | 0.1 | GO:0007256 | activation of JNKK activity(GO:0007256) |
| 0.0 | 0.0 | GO:0033693 | neurofilament bundle assembly(GO:0033693) |
| 0.0 | 0.1 | GO:0051835 | positive regulation of synapse structural plasticity(GO:0051835) |
| 0.0 | 0.1 | GO:0035026 | leading edge cell differentiation(GO:0035026) |
| 0.0 | 0.1 | GO:0006021 | inositol biosynthetic process(GO:0006021) |
| 0.0 | 0.2 | GO:0043508 | negative regulation of JUN kinase activity(GO:0043508) |
| 0.0 | 0.0 | GO:0006091 | generation of precursor metabolites and energy(GO:0006091) |
Gene overrepresentation in cellular_component category:
| Log-likelihood per target | Total log-likelihood | Term | Description |
|---|---|---|---|
| 0.1 | 0.2 | GO:0000939 | condensed chromosome inner kinetochore(GO:0000939) |
| 0.0 | 0.2 | GO:0031510 | SUMO activating enzyme complex(GO:0031510) |
| 0.0 | 0.1 | GO:1990723 | cytoplasmic periphery of the nuclear pore complex(GO:1990723) |
| 0.0 | 0.1 | GO:1902737 | dendritic filopodium(GO:1902737) |
| 0.0 | 0.1 | GO:0005726 | perichromatin fibrils(GO:0005726) |
| 0.0 | 0.1 | GO:0005606 | laminin-1 complex(GO:0005606) laminin-11 complex(GO:0043260) |
| 0.0 | 0.2 | GO:0016602 | CCAAT-binding factor complex(GO:0016602) |
| 0.0 | 0.2 | GO:0055038 | recycling endosome membrane(GO:0055038) |
| 0.0 | 0.1 | GO:0034673 | inhibin-betaglycan-ActRII complex(GO:0034673) |
| 0.0 | 0.1 | GO:0071204 | histone pre-mRNA 3'end processing complex(GO:0071204) |
| 0.0 | 0.1 | GO:1990578 | perinuclear endoplasmic reticulum membrane(GO:1990578) |
| 0.0 | 0.1 | GO:0016589 | NURF complex(GO:0016589) |
| 0.0 | 0.2 | GO:0032433 | filopodium tip(GO:0032433) |
| 0.0 | 0.2 | GO:0044233 | ER-mitochondrion membrane contact site(GO:0044233) |
| 0.0 | 0.2 | GO:0000506 | glycosylphosphatidylinositol-N-acetylglucosaminyltransferase (GPI-GnT) complex(GO:0000506) |
Gene overrepresentation in molecular_function category:
| Log-likelihood per target | Total log-likelihood | Term | Description |
|---|---|---|---|
| 0.1 | 0.2 | GO:0019948 | SUMO activating enzyme activity(GO:0019948) |
| 0.0 | 0.1 | GO:0048040 | UDP-glucuronate decarboxylase activity(GO:0048040) |
| 0.0 | 0.1 | GO:0031775 | lutropin-choriogonadotropic hormone receptor binding(GO:0031775) calcium-transporting ATPase activity involved in regulation of cardiac muscle cell membrane potential(GO:0086039) |
| 0.0 | 0.2 | GO:0044736 | acid-sensing ion channel activity(GO:0044736) |
| 0.0 | 0.1 | GO:0008441 | 3'(2'),5'-bisphosphate nucleotidase activity(GO:0008441) |
| 0.0 | 0.1 | GO:0005173 | stem cell factor receptor binding(GO:0005173) |
| 0.0 | 0.1 | GO:0005105 | type 1 fibroblast growth factor receptor binding(GO:0005105) |
| 0.0 | 0.1 | GO:0031626 | beta-endorphin binding(GO:0031626) |
| 0.0 | 0.1 | GO:0008597 | calcium-dependent protein serine/threonine phosphatase regulator activity(GO:0008597) |
| 0.0 | 0.1 | GO:0048763 | calcium-induced calcium release activity(GO:0048763) |
| 0.0 | 0.1 | GO:0047757 | chondroitin-glucuronate 5-epimerase activity(GO:0047757) |
| 0.0 | 0.1 | GO:0060961 | phospholipase D inhibitor activity(GO:0060961) |
| 0.0 | 0.2 | GO:0015271 | outward rectifier potassium channel activity(GO:0015271) |
| 0.0 | 0.1 | GO:0047493 | sphingomyelin synthase activity(GO:0033188) ceramide cholinephosphotransferase activity(GO:0047493) |
| 0.0 | 0.2 | GO:0033592 | RNA strand annealing activity(GO:0033592) |
| 0.0 | 0.0 | GO:0004119 | cGMP-inhibited cyclic-nucleotide phosphodiesterase activity(GO:0004119) |
| 0.0 | 0.1 | GO:0008269 | JAK pathway signal transduction adaptor activity(GO:0008269) |
| 0.0 | 0.1 | GO:0004741 | [pyruvate dehydrogenase (lipoamide)] phosphatase activity(GO:0004741) |
| 0.0 | 0.1 | GO:0052851 | cupric reductase activity(GO:0008823) ferric-chelate reductase (NADPH) activity(GO:0052851) |
| 0.0 | 0.1 | GO:0015018 | galactosylgalactosylxylosylprotein 3-beta-glucuronosyltransferase activity(GO:0015018) |
| 0.0 | 0.1 | GO:0034714 | type III transforming growth factor beta receptor binding(GO:0034714) |
| 0.0 | 0.0 | GO:0019107 | glycylpeptide N-tetradecanoyltransferase activity(GO:0004379) myristoyltransferase activity(GO:0019107) |
| 0.0 | 0.1 | GO:0004471 | malate dehydrogenase (decarboxylating) (NAD+) activity(GO:0004471) malate dehydrogenase (decarboxylating) (NADP+) activity(GO:0004473) |
| 0.0 | 0.2 | GO:0017176 | phosphatidylinositol N-acetylglucosaminyltransferase activity(GO:0017176) |
| 0.0 | 0.1 | GO:0035727 | lysophosphatidic acid binding(GO:0035727) |
| 0.0 | 0.1 | GO:0098821 | BMP receptor activity(GO:0098821) |
| 0.0 | 0.1 | GO:1904929 | coreceptor activity involved in Wnt signaling pathway, planar cell polarity pathway(GO:1904929) |
| 0.0 | 0.3 | GO:0003688 | DNA replication origin binding(GO:0003688) |
| 0.0 | 0.1 | GO:0015277 | kainate selective glutamate receptor activity(GO:0015277) |
Gene overrepresentation in C2:CP category:
| Log-likelihood per target | Total log-likelihood | Term | Description |
|---|---|---|---|
| 0.0 | 0.2 | PID THROMBIN PAR4 PATHWAY | PAR4-mediated thrombin signaling events |
| 0.0 | 0.1 | PID IL2 1PATHWAY | IL2-mediated signaling events |
| 0.0 | 0.1 | PID ER NONGENOMIC PATHWAY | Plasma membrane estrogen receptor signaling |
Gene overrepresentation in C2:CP:REACTOME category:
| Log-likelihood per target | Total log-likelihood | Term | Description |
|---|---|---|---|
| 0.0 | 0.3 | REACTOME CDC6 ASSOCIATION WITH THE ORC ORIGIN COMPLEX | Genes involved in CDC6 association with the ORC:origin complex |
| 0.0 | 0.1 | REACTOME REGULATION OF INSULIN SECRETION BY ACETYLCHOLINE | Genes involved in Regulation of Insulin Secretion by Acetylcholine |