Project
A549 cells infected with IAV Analysis Results (GEO series: GSE147507)
Navigation
Downloads
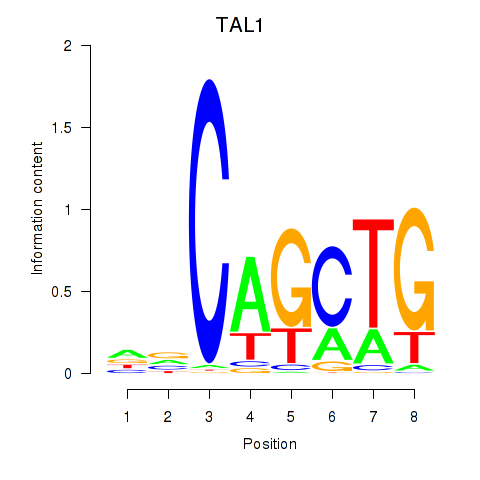
Results for TAL1
Z-value: 1.09
Motif logo
Transcription factors associated with TAL1
| Gene Symbol | Gene ID | Gene Info |
|---|---|---|
|
TAL1
|
ENSG00000162367.7 | TAL bHLH transcription factor 1, erythroid differentiation factor |
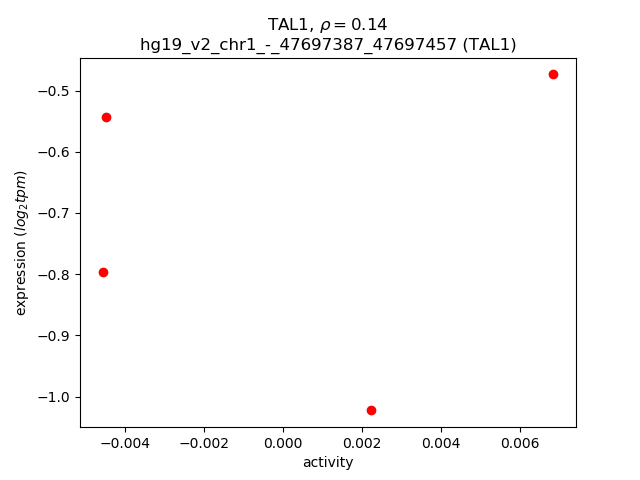
Activity-expression correlation:
| Gene | Promoter | Pearson corr. coef. | P-value | Plot |
|---|---|---|---|---|
| TAL1 | hg19_v2_chr1_-_47697387_47697457 | 0.14 | 8.6e-01 | Click! |
Activity profile of TAL1 motif
Sorted Z-values of TAL1 motif
| Promoter | Log-likelihood | Transcript | Gene | Gene Info |
|---|---|---|---|---|
| chr10_+_91061712 | 0.72 |
ENST00000371826.3
|
IFIT2
|
interferon-induced protein with tetratricopeptide repeats 2 |
| chr19_-_39735646 | 0.69 |
ENST00000413851.2
|
IFNL3
|
interferon, lambda 3 |
| chr22_+_22556057 | 0.65 |
ENST00000390286.2
|
IGLV11-55
|
immunoglobulin lambda variable 11-55 (non-functional) |
| chr16_+_23847339 | 0.46 |
ENST00000303531.7
|
PRKCB
|
protein kinase C, beta |
| chr11_-_10920838 | 0.43 |
ENST00000503469.2
|
CTD-2003C8.2
|
CTD-2003C8.2 |
| chr16_-_81110683 | 0.43 |
ENST00000565253.1
ENST00000378611.4 ENST00000299578.5 |
C16orf46
|
chromosome 16 open reading frame 46 |
| chr17_-_79623597 | 0.40 |
ENST00000574024.1
ENST00000331056.5 |
PDE6G
|
phosphodiesterase 6G, cGMP-specific, rod, gamma |
| chr19_-_38743878 | 0.40 |
ENST00000587515.1
|
PPP1R14A
|
protein phosphatase 1, regulatory (inhibitor) subunit 14A |
| chr1_+_161494036 | 0.37 |
ENST00000309758.4
|
HSPA6
|
heat shock 70kDa protein 6 (HSP70B') |
| chr10_-_46342675 | 0.37 |
ENST00000492347.1
|
AGAP4
|
ArfGAP with GTPase domain, ankyrin repeat and PH domain 4 |
| chr19_-_13068012 | 0.37 |
ENST00000316939.1
|
GADD45GIP1
|
growth arrest and DNA-damage-inducible, gamma interacting protein 1 |
| chr20_-_35274548 | 0.37 |
ENST00000262866.4
|
SLA2
|
Src-like-adaptor 2 |
| chr19_+_35773242 | 0.37 |
ENST00000222304.3
|
HAMP
|
hepcidin antimicrobial peptide |
| chr19_+_39759154 | 0.37 |
ENST00000331982.5
|
IFNL2
|
interferon, lambda 2 |
| chr22_+_23029188 | 0.36 |
ENST00000390305.2
|
IGLV3-25
|
immunoglobulin lambda variable 3-25 |
| chr17_-_15469590 | 0.36 |
ENST00000312127.2
|
CDRT1
|
CMT duplicated region transcript 1; Uncharacterized protein |
| chr19_-_48016023 | 0.35 |
ENST00000598615.1
ENST00000597118.1 |
NAPA
|
N-ethylmaleimide-sensitive factor attachment protein, alpha |
| chr17_-_40264321 | 0.34 |
ENST00000430773.1
ENST00000413196.2 |
DHX58
|
DEXH (Asp-Glu-X-His) box polypeptide 58 |
| chr6_-_31651817 | 0.34 |
ENST00000375863.3
ENST00000375860.2 |
LY6G5C
|
lymphocyte antigen 6 complex, locus G5C |
| chr4_-_80994210 | 0.34 |
ENST00000403729.2
|
ANTXR2
|
anthrax toxin receptor 2 |
| chr12_-_74686314 | 0.29 |
ENST00000551210.1
ENST00000515416.2 ENST00000549905.1 |
RP11-81H3.2
|
RP11-81H3.2 |
| chr12_+_52643077 | 0.29 |
ENST00000553310.2
ENST00000544024.1 |
KRT86
|
keratin 86 |
| chr1_-_238108575 | 0.29 |
ENST00000604646.1
|
MTRNR2L11
|
MT-RNR2-like 11 (pseudogene) |
| chr20_-_25207370 | 0.29 |
ENST00000593352.1
|
AL035252.1
|
HCG2018895; Uncharacterized protein |
| chr17_-_34207295 | 0.29 |
ENST00000463941.1
ENST00000293272.3 |
CCL5
|
chemokine (C-C motif) ligand 5 |
| chrX_-_71497148 | 0.28 |
ENST00000316084.6
|
RPS4X
|
ribosomal protein S4, X-linked |
| chr1_+_192778161 | 0.28 |
ENST00000235382.5
|
RGS2
|
regulator of G-protein signaling 2, 24kDa |
| chr12_+_79357815 | 0.28 |
ENST00000547046.1
|
SYT1
|
synaptotagmin I |
| chr6_-_31689456 | 0.28 |
ENST00000495859.1
ENST00000375819.2 |
LY6G6C
|
lymphocyte antigen 6 complex, locus G6C |
| chr6_+_84563295 | 0.28 |
ENST00000369687.1
|
RIPPLY2
|
ripply transcriptional repressor 2 |
| chr19_+_3224700 | 0.28 |
ENST00000292672.2
ENST00000541430.2 |
CELF5
|
CUGBP, Elav-like family member 5 |
| chr1_-_114429997 | 0.28 |
ENST00000471267.1
ENST00000393320.3 |
BCL2L15
|
BCL2-like 15 |
| chr9_+_78505581 | 0.28 |
ENST00000376767.3
ENST00000376752.4 |
PCSK5
|
proprotein convertase subtilisin/kexin type 5 |
| chr14_+_93813510 | 0.27 |
ENST00000342144.2
|
COX8C
|
cytochrome c oxidase subunit VIIIC |
| chr6_+_47445467 | 0.27 |
ENST00000359314.5
|
CD2AP
|
CD2-associated protein |
| chr3_+_49977440 | 0.27 |
ENST00000442092.1
ENST00000266022.4 ENST00000443081.1 |
RBM6
|
RNA binding motif protein 6 |
| chr10_+_135340859 | 0.27 |
ENST00000252945.3
ENST00000421586.1 ENST00000418356.1 |
CYP2E1
|
cytochrome P450, family 2, subfamily E, polypeptide 1 |
| chr12_+_147052 | 0.26 |
ENST00000594563.1
|
AC026369.1
|
Uncharacterized protein |
| chr10_-_90967063 | 0.26 |
ENST00000371852.2
|
CH25H
|
cholesterol 25-hydroxylase |
| chr2_+_30369859 | 0.26 |
ENST00000402003.3
|
YPEL5
|
yippee-like 5 (Drosophila) |
| chr5_+_49962772 | 0.26 |
ENST00000281631.5
ENST00000513738.1 ENST00000503665.1 ENST00000514067.2 ENST00000503046.1 |
PARP8
|
poly (ADP-ribose) polymerase family, member 8 |
| chr10_+_35416223 | 0.26 |
ENST00000489321.1
ENST00000427847.2 ENST00000345491.3 ENST00000395895.2 ENST00000374728.3 ENST00000487132.1 |
CREM
|
cAMP responsive element modulator |
| chr8_-_134501873 | 0.26 |
ENST00000523634.1
|
ST3GAL1
|
ST3 beta-galactoside alpha-2,3-sialyltransferase 1 |
| chr20_+_58533471 | 0.25 |
ENST00000244047.5
ENST00000348616.4 |
CDH26
|
cadherin 26 |
| chr20_+_57466629 | 0.25 |
ENST00000371081.1
ENST00000338783.6 |
GNAS
|
GNAS complex locus |
| chr1_+_207494853 | 0.25 |
ENST00000367064.3
ENST00000367063.2 ENST00000391921.4 ENST00000367067.4 ENST00000314754.8 ENST00000367065.5 ENST00000391920.4 ENST00000367062.4 ENST00000343420.6 |
CD55
|
CD55 molecule, decay accelerating factor for complement (Cromer blood group) |
| chr15_-_78526942 | 0.25 |
ENST00000258873.4
|
ACSBG1
|
acyl-CoA synthetase bubblegum family member 1 |
| chr4_+_154387480 | 0.25 |
ENST00000409663.3
ENST00000440693.1 ENST00000409959.3 |
KIAA0922
|
KIAA0922 |
| chr19_+_1452188 | 0.24 |
ENST00000587149.1
|
APC2
|
adenomatosis polyposis coli 2 |
| chr12_-_121476750 | 0.24 |
ENST00000543677.1
|
OASL
|
2'-5'-oligoadenylate synthetase-like |
| chr20_+_52824367 | 0.24 |
ENST00000371419.2
|
PFDN4
|
prefoldin subunit 4 |
| chr12_+_6309517 | 0.24 |
ENST00000382519.4
ENST00000009180.4 |
CD9
|
CD9 molecule |
| chr17_-_42875115 | 0.24 |
ENST00000591137.1
|
CTC-296K1.4
|
CTC-296K1.4 |
| chr8_-_134501937 | 0.24 |
ENST00000519924.1
|
ST3GAL1
|
ST3 beta-galactoside alpha-2,3-sialyltransferase 1 |
| chr9_-_21077939 | 0.24 |
ENST00000380232.2
|
IFNB1
|
interferon, beta 1, fibroblast |
| chr4_-_48018680 | 0.24 |
ENST00000513178.1
|
CNGA1
|
cyclic nucleotide gated channel alpha 1 |
| chr22_+_32753854 | 0.23 |
ENST00000249007.4
|
RFPL3
|
ret finger protein-like 3 |
| chr14_+_61447927 | 0.23 |
ENST00000451406.1
|
SLC38A6
|
solute carrier family 38, member 6 |
| chr19_-_10450328 | 0.23 |
ENST00000160262.5
|
ICAM3
|
intercellular adhesion molecule 3 |
| chr17_-_40264692 | 0.23 |
ENST00000591220.1
ENST00000251642.3 |
DHX58
|
DEXH (Asp-Glu-X-His) box polypeptide 58 |
| chr10_+_26986582 | 0.23 |
ENST00000376215.5
ENST00000376203.5 |
PDSS1
|
prenyl (decaprenyl) diphosphate synthase, subunit 1 |
| chr5_+_176692466 | 0.23 |
ENST00000508029.1
ENST00000503056.1 |
NSD1
|
nuclear receptor binding SET domain protein 1 |
| chr16_+_81528948 | 0.23 |
ENST00000539778.2
|
CMIP
|
c-Maf inducing protein |
| chr12_-_110511424 | 0.23 |
ENST00000548191.1
|
C12orf76
|
chromosome 12 open reading frame 76 |
| chr3_+_69134124 | 0.23 |
ENST00000478935.1
|
ARL6IP5
|
ADP-ribosylation-like factor 6 interacting protein 5 |
| chr2_+_29001711 | 0.23 |
ENST00000418910.1
|
PPP1CB
|
protein phosphatase 1, catalytic subunit, beta isozyme |
| chr1_+_25071848 | 0.23 |
ENST00000374379.4
|
CLIC4
|
chloride intracellular channel 4 |
| chr2_+_30369807 | 0.23 |
ENST00000379520.3
ENST00000379519.3 ENST00000261353.4 |
YPEL5
|
yippee-like 5 (Drosophila) |
| chr22_+_31277661 | 0.22 |
ENST00000454145.1
ENST00000453621.1 ENST00000431368.1 ENST00000535268.1 |
OSBP2
|
oxysterol binding protein 2 |
| chr12_+_72058130 | 0.22 |
ENST00000547843.1
|
THAP2
|
THAP domain containing, apoptosis associated protein 2 |
| chr2_+_85822857 | 0.22 |
ENST00000306368.4
ENST00000414390.1 ENST00000456023.1 |
RNF181
|
ring finger protein 181 |
| chr22_-_44708731 | 0.22 |
ENST00000381176.4
|
KIAA1644
|
KIAA1644 |
| chr3_-_48659193 | 0.22 |
ENST00000330862.3
|
TMEM89
|
transmembrane protein 89 |
| chr8_-_101719159 | 0.22 |
ENST00000520868.1
ENST00000522658.1 |
PABPC1
|
poly(A) binding protein, cytoplasmic 1 |
| chr4_-_4291761 | 0.22 |
ENST00000513174.1
|
LYAR
|
Ly1 antibody reactive |
| chr5_+_95998746 | 0.22 |
ENST00000508608.1
|
CAST
|
calpastatin |
| chr2_-_105953912 | 0.22 |
ENST00000610036.1
|
RP11-332H14.2
|
RP11-332H14.2 |
| chr20_+_62185491 | 0.22 |
ENST00000370097.1
|
C20orf195
|
chromosome 20 open reading frame 195 |
| chr6_-_30080863 | 0.22 |
ENST00000540829.1
|
TRIM31
|
tripartite motif containing 31 |
| chr5_-_145483932 | 0.22 |
ENST00000311450.4
|
PLAC8L1
|
PLAC8-like 1 |
| chr19_-_54726850 | 0.22 |
ENST00000245620.9
ENST00000346401.6 ENST00000424807.1 ENST00000445347.1 |
LILRB3
|
leukocyte immunoglobulin-like receptor, subfamily B (with TM and ITIM domains), member 3 |
| chr11_-_74204692 | 0.22 |
ENST00000528085.1
|
LIPT2
|
lipoyl(octanoyl) transferase 2 (putative) |
| chr4_-_165305086 | 0.22 |
ENST00000507270.1
ENST00000514618.1 ENST00000503008.1 |
MARCH1
|
membrane-associated ring finger (C3HC4) 1, E3 ubiquitin protein ligase |
| chr15_+_78857870 | 0.22 |
ENST00000559554.1
|
CHRNA5
|
cholinergic receptor, nicotinic, alpha 5 (neuronal) |
| chr2_+_85822839 | 0.22 |
ENST00000441634.1
|
RNF181
|
ring finger protein 181 |
| chr10_+_18948311 | 0.22 |
ENST00000377275.3
|
ARL5B
|
ADP-ribosylation factor-like 5B |
| chr17_+_32582293 | 0.22 |
ENST00000580907.1
ENST00000225831.4 |
CCL2
|
chemokine (C-C motif) ligand 2 |
| chr3_-_183146369 | 0.21 |
ENST00000482017.1
|
MCF2L2
|
MCF.2 cell line derived transforming sequence-like 2 |
| chr22_+_38071615 | 0.21 |
ENST00000215909.5
|
LGALS1
|
lectin, galactoside-binding, soluble, 1 |
| chr15_+_78857849 | 0.21 |
ENST00000299565.5
|
CHRNA5
|
cholinergic receptor, nicotinic, alpha 5 (neuronal) |
| chr13_+_37581115 | 0.21 |
ENST00000481013.1
|
EXOSC8
|
exosome component 8 |
| chr1_-_153588765 | 0.21 |
ENST00000368701.1
ENST00000344616.2 |
S100A14
|
S100 calcium binding protein A14 |
| chr6_+_126112001 | 0.21 |
ENST00000392477.2
|
NCOA7
|
nuclear receptor coactivator 7 |
| chr3_-_52869205 | 0.21 |
ENST00000446157.2
|
MUSTN1
|
musculoskeletal, embryonic nuclear protein 1 |
| chr1_+_2005126 | 0.21 |
ENST00000495347.1
|
PRKCZ
|
protein kinase C, zeta |
| chr20_-_524362 | 0.21 |
ENST00000460062.2
ENST00000608066.1 |
CSNK2A1
|
casein kinase 2, alpha 1 polypeptide |
| chr12_-_123752624 | 0.21 |
ENST00000542174.1
ENST00000535796.1 |
CDK2AP1
|
cyclin-dependent kinase 2 associated protein 1 |
| chr9_-_113018746 | 0.21 |
ENST00000374515.5
|
TXN
|
thioredoxin |
| chr16_+_33629600 | 0.20 |
ENST00000562905.2
|
IGHV3OR16-13
|
immunoglobulin heavy variable 3/OR16-13 (non-functional) |
| chr19_-_6199521 | 0.20 |
ENST00000592883.1
|
RFX2
|
regulatory factor X, 2 (influences HLA class II expression) |
| chr6_+_31691121 | 0.20 |
ENST00000480039.1
ENST00000375810.4 ENST00000375805.2 ENST00000375809.3 ENST00000375804.2 ENST00000375814.3 ENST00000375806.2 |
C6orf25
|
chromosome 6 open reading frame 25 |
| chr14_+_93357749 | 0.20 |
ENST00000557689.1
|
RP11-862G15.1
|
RP11-862G15.1 |
| chr4_-_89619386 | 0.20 |
ENST00000323061.5
|
NAP1L5
|
nucleosome assembly protein 1-like 5 |
| chr12_-_123459105 | 0.20 |
ENST00000543935.1
|
ABCB9
|
ATP-binding cassette, sub-family B (MDR/TAP), member 9 |
| chr18_+_57567180 | 0.20 |
ENST00000316660.6
ENST00000269518.9 |
PMAIP1
|
phorbol-12-myristate-13-acetate-induced protein 1 |
| chr5_-_36152031 | 0.20 |
ENST00000296603.4
|
LMBRD2
|
LMBR1 domain containing 2 |
| chr22_+_19950060 | 0.20 |
ENST00000449653.1
|
COMT
|
catechol-O-methyltransferase |
| chr17_+_42925270 | 0.20 |
ENST00000253410.2
ENST00000587021.1 |
HIGD1B
|
HIG1 hypoxia inducible domain family, member 1B |
| chr4_+_38511367 | 0.20 |
ENST00000507056.1
|
RP11-213G21.1
|
RP11-213G21.1 |
| chr3_+_119421849 | 0.20 |
ENST00000273390.5
ENST00000463700.1 |
MAATS1
|
MYCBP-associated, testis expressed 1 |
| chr3_+_49977490 | 0.20 |
ENST00000539992.1
|
RBM6
|
RNA binding motif protein 6 |
| chr4_-_104119528 | 0.20 |
ENST00000380026.3
ENST00000503705.1 ENST00000265148.3 |
CENPE
|
centromere protein E, 312kDa |
| chr8_-_91618285 | 0.20 |
ENST00000517505.1
|
LINC01030
|
long intergenic non-protein coding RNA 1030 |
| chr1_-_11918988 | 0.20 |
ENST00000376468.3
|
NPPB
|
natriuretic peptide B |
| chr4_-_141348763 | 0.20 |
ENST00000509477.1
|
CLGN
|
calmegin |
| chr9_-_37384431 | 0.20 |
ENST00000452923.1
|
RP11-397D12.4
|
RP11-397D12.4 |
| chr19_+_7571968 | 0.19 |
ENST00000599312.1
|
CTD-2207O23.12
|
Uncharacterized protein |
| chr15_+_72947079 | 0.19 |
ENST00000421285.3
|
GOLGA6B
|
golgin A6 family, member B |
| chr21_-_46330545 | 0.19 |
ENST00000320216.6
ENST00000397852.1 |
ITGB2
|
integrin, beta 2 (complement component 3 receptor 3 and 4 subunit) |
| chr1_+_153750622 | 0.19 |
ENST00000532853.1
|
SLC27A3
|
solute carrier family 27 (fatty acid transporter), member 3 |
| chr17_-_58499766 | 0.19 |
ENST00000588898.1
|
USP32
|
ubiquitin specific peptidase 32 |
| chr7_+_116139744 | 0.19 |
ENST00000343213.2
|
CAV2
|
caveolin 2 |
| chr16_+_85832146 | 0.19 |
ENST00000565078.1
|
COX4I1
|
cytochrome c oxidase subunit IV isoform 1 |
| chr7_-_104567066 | 0.19 |
ENST00000453666.1
|
RP11-325F22.5
|
RP11-325F22.5 |
| chr10_+_103348031 | 0.19 |
ENST00000370151.4
ENST00000370147.1 ENST00000370148.2 |
DPCD
|
deleted in primary ciliary dyskinesia homolog (mouse) |
| chr3_-_138048631 | 0.19 |
ENST00000484930.1
ENST00000475751.1 |
NME9
|
NME/NM23 family member 9 |
| chr3_-_158390282 | 0.19 |
ENST00000264265.3
|
LXN
|
latexin |
| chr10_+_94833642 | 0.19 |
ENST00000224356.4
ENST00000394139.1 |
CYP26A1
|
cytochrome P450, family 26, subfamily A, polypeptide 1 |
| chr22_+_32754139 | 0.19 |
ENST00000382088.3
|
RFPL3
|
ret finger protein-like 3 |
| chr8_-_119634141 | 0.19 |
ENST00000409003.4
ENST00000526328.1 ENST00000314727.4 ENST00000526765.1 |
SAMD12
|
sterile alpha motif domain containing 12 |
| chr3_+_159570722 | 0.19 |
ENST00000482804.1
|
SCHIP1
|
schwannomin interacting protein 1 |
| chr16_-_2004683 | 0.19 |
ENST00000268661.7
|
RPL3L
|
ribosomal protein L3-like |
| chr8_-_56986768 | 0.19 |
ENST00000523936.1
|
RPS20
|
ribosomal protein S20 |
| chr4_-_170679024 | 0.19 |
ENST00000393381.2
|
C4orf27
|
chromosome 4 open reading frame 27 |
| chr14_+_104710541 | 0.19 |
ENST00000419115.1
|
C14orf144
|
chromosome 14 open reading frame 144 |
| chr17_+_77681075 | 0.19 |
ENST00000397549.2
|
CTD-2116F7.1
|
CTD-2116F7.1 |
| chr3_+_49977523 | 0.19 |
ENST00000422955.1
|
RBM6
|
RNA binding motif protein 6 |
| chr16_+_84209539 | 0.19 |
ENST00000569735.1
|
DNAAF1
|
dynein, axonemal, assembly factor 1 |
| chr12_-_8088773 | 0.19 |
ENST00000544291.1
|
SLC2A3
|
solute carrier family 2 (facilitated glucose transporter), member 3 |
| chr1_-_11107280 | 0.18 |
ENST00000400897.3
ENST00000400898.3 |
MASP2
|
mannan-binding lectin serine peptidase 2 |
| chr4_-_14889791 | 0.18 |
ENST00000509654.1
ENST00000515031.1 ENST00000505089.2 |
LINC00504
|
long intergenic non-protein coding RNA 504 |
| chr22_-_23922410 | 0.18 |
ENST00000249053.3
|
IGLL1
|
immunoglobulin lambda-like polypeptide 1 |
| chr2_-_219146839 | 0.18 |
ENST00000425694.1
|
TMBIM1
|
transmembrane BAX inhibitor motif containing 1 |
| chr6_-_33663474 | 0.18 |
ENST00000594414.1
|
SBP1
|
SBP1; Uncharacterized protein |
| chr19_-_10450287 | 0.18 |
ENST00000589261.1
ENST00000590569.1 ENST00000589580.1 ENST00000589249.1 |
ICAM3
|
intercellular adhesion molecule 3 |
| chr14_+_61447832 | 0.18 |
ENST00000354886.2
ENST00000267488.4 |
SLC38A6
|
solute carrier family 38, member 6 |
| chr12_-_120663792 | 0.18 |
ENST00000546532.1
ENST00000548912.1 |
PXN
|
paxillin |
| chr4_-_176828307 | 0.18 |
ENST00000513365.1
ENST00000513667.1 ENST00000503563.1 |
GPM6A
|
glycoprotein M6A |
| chr9_-_140142222 | 0.18 |
ENST00000344774.4
ENST00000388932.2 |
FAM166A
|
family with sequence similarity 166, member A |
| chr1_+_161719552 | 0.18 |
ENST00000367943.4
|
DUSP12
|
dual specificity phosphatase 12 |
| chr18_-_54305658 | 0.18 |
ENST00000586262.1
ENST00000217515.6 |
TXNL1
|
thioredoxin-like 1 |
| chr2_-_95831158 | 0.18 |
ENST00000447814.1
|
ZNF514
|
zinc finger protein 514 |
| chr4_-_2243839 | 0.18 |
ENST00000511885.2
ENST00000506763.1 ENST00000514395.1 ENST00000502440.1 ENST00000243706.4 ENST00000443786.2 |
POLN
HAUS3
|
polymerase (DNA directed) nu HAUS augmin-like complex, subunit 3 |
| chr2_-_241831424 | 0.18 |
ENST00000402775.2
ENST00000307486.8 |
C2orf54
|
chromosome 2 open reading frame 54 |
| chr17_+_6900201 | 0.18 |
ENST00000480801.1
|
ALOX12
|
arachidonate 12-lipoxygenase |
| chr6_+_126112074 | 0.18 |
ENST00000453302.1
ENST00000417494.1 ENST00000229634.9 |
NCOA7
|
nuclear receptor coactivator 7 |
| chr21_-_47613673 | 0.17 |
ENST00000594486.1
|
AP001468.1
|
Protein LOC101060037 |
| chr9_+_114393634 | 0.17 |
ENST00000556107.1
ENST00000374294.3 |
DNAJC25
DNAJC25-GNG10
|
DnaJ (Hsp40) homolog, subfamily C , member 25 DNAJC25-GNG10 readthrough |
| chr4_-_186317034 | 0.17 |
ENST00000505916.1
|
LRP2BP
|
LRP2 binding protein |
| chrX_-_71497077 | 0.17 |
ENST00000373626.3
|
RPS4X
|
ribosomal protein S4, X-linked |
| chr7_-_35734176 | 0.17 |
ENST00000413517.1
ENST00000438224.1 |
HERPUD2
|
HERPUD family member 2 |
| chr8_-_112248400 | 0.17 |
ENST00000519506.1
ENST00000522778.1 |
RP11-946L20.4
|
RP11-946L20.4 |
| chr12_-_57146095 | 0.17 |
ENST00000550770.1
ENST00000338193.6 |
PRIM1
|
primase, DNA, polypeptide 1 (49kDa) |
| chr4_-_15939963 | 0.17 |
ENST00000259988.2
|
FGFBP1
|
fibroblast growth factor binding protein 1 |
| chr11_-_62457371 | 0.17 |
ENST00000317449.4
|
LRRN4CL
|
LRRN4 C-terminal like |
| chr5_+_59726565 | 0.17 |
ENST00000412930.2
|
FKSG52
|
FKSG52 |
| chr1_+_185014496 | 0.17 |
ENST00000367510.3
|
RNF2
|
ring finger protein 2 |
| chr11_+_86085778 | 0.17 |
ENST00000354755.1
ENST00000278487.3 ENST00000531271.1 ENST00000445632.2 |
CCDC81
|
coiled-coil domain containing 81 |
| chr19_-_6670128 | 0.17 |
ENST00000245912.3
|
TNFSF14
|
tumor necrosis factor (ligand) superfamily, member 14 |
| chr10_+_51187938 | 0.17 |
ENST00000311663.5
|
FAM21D
|
family with sequence similarity 21, member D |
| chr1_-_85666688 | 0.17 |
ENST00000341460.5
|
SYDE2
|
synapse defective 1, Rho GTPase, homolog 2 (C. elegans) |
| chr7_+_116139424 | 0.17 |
ENST00000222693.4
|
CAV2
|
caveolin 2 |
| chr11_+_71259466 | 0.17 |
ENST00000528743.2
|
KRTAP5-9
|
keratin associated protein 5-9 |
| chr7_-_6066183 | 0.17 |
ENST00000422786.1
|
EIF2AK1
|
eukaryotic translation initiation factor 2-alpha kinase 1 |
| chrX_-_92928557 | 0.17 |
ENST00000373079.3
ENST00000475430.2 |
NAP1L3
|
nucleosome assembly protein 1-like 3 |
| chr9_+_33264861 | 0.17 |
ENST00000223500.8
|
CHMP5
|
charged multivesicular body protein 5 |
| chr19_+_11877838 | 0.17 |
ENST00000357901.4
ENST00000454339.2 |
ZNF441
|
zinc finger protein 441 |
| chr2_+_200472779 | 0.17 |
ENST00000427045.1
ENST00000419243.1 |
AC093590.1
|
AC093590.1 |
| chr3_-_47324008 | 0.17 |
ENST00000425853.1
|
KIF9
|
kinesin family member 9 |
| chr7_-_155437075 | 0.17 |
ENST00000401694.1
|
AC009403.2
|
Protein LOC100506302 |
| chr3_+_158288999 | 0.17 |
ENST00000482628.1
ENST00000478894.2 ENST00000392822.3 ENST00000466246.1 |
MLF1
|
myeloid leukemia factor 1 |
| chrX_-_55187588 | 0.17 |
ENST00000472571.2
ENST00000332132.4 ENST00000425133.2 ENST00000358460.4 |
FAM104B
|
family with sequence similarity 104, member B |
| chr14_+_21359558 | 0.17 |
ENST00000304639.3
|
RNASE3
|
ribonuclease, RNase A family, 3 |
| chr10_+_89124746 | 0.17 |
ENST00000465545.1
|
NUTM2D
|
NUT family member 2D |
| chr7_-_101272576 | 0.17 |
ENST00000223167.4
|
MYL10
|
myosin, light chain 10, regulatory |
| chr11_+_44069531 | 0.17 |
ENST00000378832.1
|
ACCSL
|
1-aminocyclopropane-1-carboxylate synthase homolog (Arabidopsis)(non-functional)-like |
| chr6_-_13711773 | 0.16 |
ENST00000011619.3
|
RANBP9
|
RAN binding protein 9 |
| chr6_+_24775641 | 0.16 |
ENST00000378054.2
ENST00000476555.1 |
GMNN
|
geminin, DNA replication inhibitor |
| chr19_+_4304685 | 0.16 |
ENST00000601006.1
|
FSD1
|
fibronectin type III and SPRY domain containing 1 |
| chr2_+_74120094 | 0.16 |
ENST00000409731.3
ENST00000345517.3 ENST00000409918.1 ENST00000442912.1 ENST00000409624.1 |
ACTG2
|
actin, gamma 2, smooth muscle, enteric |
| chr11_+_118826999 | 0.16 |
ENST00000264031.2
|
UPK2
|
uroplakin 2 |
| chr1_-_40237020 | 0.16 |
ENST00000327582.5
|
OXCT2
|
3-oxoacid CoA transferase 2 |
| chr11_-_88070920 | 0.16 |
ENST00000524463.1
ENST00000227266.5 |
CTSC
|
cathepsin C |
| chr3_+_167453493 | 0.16 |
ENST00000295777.5
ENST00000472747.2 |
SERPINI1
|
serpin peptidase inhibitor, clade I (neuroserpin), member 1 |
| chr1_+_44401479 | 0.16 |
ENST00000438616.3
|
ARTN
|
artemin |
| chr9_-_128003606 | 0.16 |
ENST00000324460.6
|
HSPA5
|
heat shock 70kDa protein 5 (glucose-regulated protein, 78kDa) |
| chr3_-_68981685 | 0.16 |
ENST00000495737.1
ENST00000295569.7 |
FAM19A4
|
family with sequence similarity 19 (chemokine (C-C motif)-like), member A4 |
| chr4_+_15683404 | 0.16 |
ENST00000422728.2
|
FAM200B
|
family with sequence similarity 200, member B |
| chr6_+_138188378 | 0.16 |
ENST00000420009.1
|
TNFAIP3
|
tumor necrosis factor, alpha-induced protein 3 |
| chr8_-_94928861 | 0.16 |
ENST00000607097.1
|
MIR378D2
|
microRNA 378d-2 |
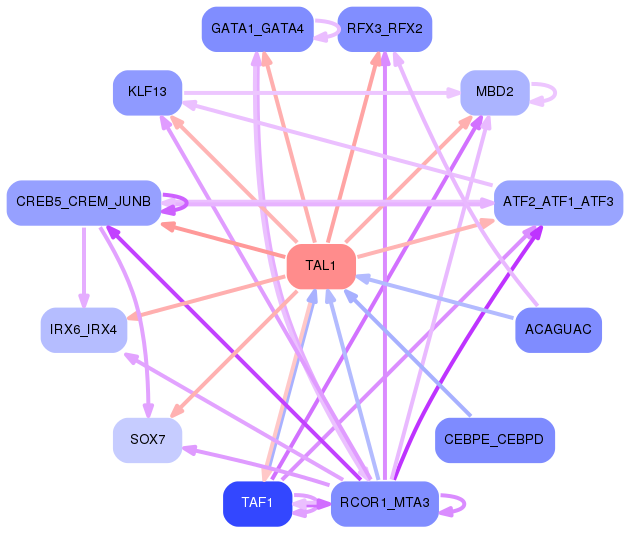
Network of associatons between targets according to the STRING database.

First level regulatory network of TAL1
Gene Ontology Analysis
Gene overrepresentation in biological_process category:
| Log-likelihood per target | Total log-likelihood | Term | Description |
|---|---|---|---|
| 0.1 | 0.7 | GO:0039534 | negative regulation of MDA-5 signaling pathway(GO:0039534) |
| 0.1 | 0.4 | GO:1990641 | response to iron ion starvation(GO:1990641) |
| 0.1 | 0.5 | GO:2000501 | regulation of natural killer cell chemotaxis(GO:2000501) |
| 0.1 | 0.1 | GO:0060491 | regulation of cell projection assembly(GO:0060491) |
| 0.1 | 0.1 | GO:1903169 | regulation of calcium ion transmembrane transport(GO:1903169) |
| 0.1 | 0.4 | GO:0090291 | negative regulation of osteoclast proliferation(GO:0090291) |
| 0.1 | 0.2 | GO:0002725 | negative regulation of T cell cytokine production(GO:0002725) |
| 0.1 | 0.5 | GO:0036111 | very long-chain fatty-acyl-CoA metabolic process(GO:0036111) |
| 0.1 | 0.3 | GO:0046452 | dihydrofolate metabolic process(GO:0046452) |
| 0.1 | 0.1 | GO:0034761 | positive regulation of iron ion transport(GO:0034758) positive regulation of iron ion transmembrane transport(GO:0034761) regulation of iron ion import(GO:1900390) regulation of ferrous iron import into cell(GO:1903989) positive regulation of ferrous iron import into cell(GO:1903991) regulation of ferrous iron binding(GO:1904432) positive regulation of ferrous iron binding(GO:1904434) regulation of transferrin receptor binding(GO:1904435) positive regulation of transferrin receptor binding(GO:1904437) regulation of ferrous iron import across plasma membrane(GO:1904438) positive regulation of ferrous iron import across plasma membrane(GO:1904440) |
| 0.1 | 0.2 | GO:0097195 | pilomotor reflex(GO:0097195) |
| 0.1 | 0.1 | GO:0007021 | tubulin complex assembly(GO:0007021) |
| 0.1 | 0.3 | GO:0021966 | corticospinal neuron axon guidance(GO:0021966) |
| 0.1 | 0.4 | GO:0098746 | fast, calcium ion-dependent exocytosis of neurotransmitter(GO:0098746) |
| 0.1 | 0.1 | GO:0061110 | dense core granule biogenesis(GO:0061110) regulation of dense core granule biogenesis(GO:2000705) |
| 0.1 | 0.2 | GO:2001247 | positive regulation of phosphatidylcholine biosynthetic process(GO:2001247) |
| 0.1 | 0.3 | GO:2000563 | positive regulation of CD4-positive, alpha-beta T cell proliferation(GO:2000563) |
| 0.1 | 0.2 | GO:1901896 | positive regulation of calcium-transporting ATPase activity(GO:1901896) |
| 0.1 | 0.3 | GO:0006542 | glutamine biosynthetic process(GO:0006542) |
| 0.1 | 0.1 | GO:0010543 | regulation of platelet activation(GO:0010543) |
| 0.1 | 0.1 | GO:0036476 | neuron death in response to hydrogen peroxide(GO:0036476) regulation of hydrogen peroxide-induced neuron death(GO:1903207) negative regulation of hydrogen peroxide-induced neuron death(GO:1903208) |
| 0.1 | 0.2 | GO:0002894 | positive regulation of type IIa hypersensitivity(GO:0001798) positive regulation of type II hypersensitivity(GO:0002894) |
| 0.1 | 0.2 | GO:0033488 | cholesterol biosynthetic process via 24,25-dihydrolanosterol(GO:0033488) |
| 0.1 | 0.2 | GO:0007388 | anterior compartment pattern formation(GO:0007387) posterior compartment specification(GO:0007388) |
| 0.1 | 0.6 | GO:0035494 | SNARE complex disassembly(GO:0035494) |
| 0.1 | 0.4 | GO:1903862 | positive regulation of oxidative phosphorylation(GO:1903862) |
| 0.1 | 0.3 | GO:0097501 | stress response to metal ion(GO:0097501) |
| 0.1 | 0.1 | GO:0035739 | CD4-positive, alpha-beta T cell proliferation(GO:0035739) regulation of CD4-positive, alpha-beta T cell proliferation(GO:2000561) negative regulation of CD4-positive, alpha-beta T cell proliferation(GO:2000562) |
| 0.1 | 0.2 | GO:0071449 | cellular response to lipid hydroperoxide(GO:0071449) |
| 0.1 | 0.2 | GO:0038193 | thromboxane A2 signaling pathway(GO:0038193) |
| 0.1 | 0.1 | GO:0030300 | regulation of intestinal cholesterol absorption(GO:0030300) regulation of intestinal lipid absorption(GO:1904729) |
| 0.1 | 0.2 | GO:0007341 | penetration of zona pellucida(GO:0007341) |
| 0.1 | 0.1 | GO:0046110 | xanthine metabolic process(GO:0046110) |
| 0.1 | 0.2 | GO:0017186 | peptidyl-pyroglutamic acid biosynthetic process, using glutaminyl-peptide cyclotransferase(GO:0017186) |
| 0.1 | 0.2 | GO:0006423 | cysteinyl-tRNA aminoacylation(GO:0006423) |
| 0.1 | 0.4 | GO:0007079 | mitotic chromosome movement towards spindle pole(GO:0007079) |
| 0.1 | 0.2 | GO:0071048 | nuclear mRNA surveillance of spliceosomal pre-mRNA splicing(GO:0071030) nuclear retention of unspliced pre-mRNA at the site of transcription(GO:0071048) |
| 0.1 | 0.2 | GO:2001301 | lipoxin biosynthetic process(GO:2001301) lipoxin A4 metabolic process(GO:2001302) lipoxin A4 biosynthetic process(GO:2001303) |
| 0.1 | 0.3 | GO:0034371 | chylomicron remodeling(GO:0034371) |
| 0.1 | 0.1 | GO:0032461 | positive regulation of protein oligomerization(GO:0032461) |
| 0.1 | 0.5 | GO:0046826 | negative regulation of protein export from nucleus(GO:0046826) |
| 0.1 | 0.2 | GO:0007008 | outer mitochondrial membrane organization(GO:0007008) |
| 0.1 | 0.2 | GO:0071301 | cellular response to vitamin B1(GO:0071301) response to formaldehyde(GO:1904404) |
| 0.1 | 0.2 | GO:0046168 | glycerol-3-phosphate catabolic process(GO:0046168) |
| 0.1 | 0.2 | GO:0050917 | sensory perception of umami taste(GO:0050917) |
| 0.1 | 0.3 | GO:0010193 | response to ozone(GO:0010193) |
| 0.1 | 0.2 | GO:0003289 | septum primum development(GO:0003284) atrial septum primum morphogenesis(GO:0003289) |
| 0.1 | 0.3 | GO:0036353 | histone H2A-K119 monoubiquitination(GO:0036353) |
| 0.1 | 0.4 | GO:0010286 | heat acclimation(GO:0010286) cellular heat acclimation(GO:0070370) |
| 0.1 | 0.2 | GO:0002636 | positive regulation of germinal center formation(GO:0002636) |
| 0.1 | 0.2 | GO:0006097 | glyoxylate cycle(GO:0006097) |
| 0.1 | 0.2 | GO:0034476 | U1 snRNA 3'-end processing(GO:0034473) U5 snRNA 3'-end processing(GO:0034476) |
| 0.1 | 0.3 | GO:0009107 | lipoate biosynthetic process(GO:0009107) |
| 0.1 | 0.7 | GO:0035457 | cellular response to interferon-alpha(GO:0035457) |
| 0.1 | 0.2 | GO:0070837 | dehydroascorbic acid transport(GO:0070837) |
| 0.1 | 0.2 | GO:0060437 | lung growth(GO:0060437) |
| 0.1 | 0.1 | GO:0019372 | lipoxygenase pathway(GO:0019372) |
| 0.1 | 0.2 | GO:1903609 | negative regulation of peptidyl-tyrosine autophosphorylation(GO:1900085) negative regulation of inward rectifier potassium channel activity(GO:1903609) |
| 0.1 | 0.2 | GO:0031106 | septin ring assembly(GO:0000921) septin ring organization(GO:0031106) |
| 0.0 | 0.1 | GO:1901899 | positive regulation of relaxation of cardiac muscle(GO:1901899) |
| 0.0 | 0.0 | GO:1902299 | pre-replicative complex assembly involved in nuclear cell cycle DNA replication(GO:0006267) pre-replicative complex assembly(GO:0036388) pre-replicative complex assembly involved in cell cycle DNA replication(GO:1902299) |
| 0.0 | 0.0 | GO:0033173 | calcineurin-NFAT signaling cascade(GO:0033173) |
| 0.0 | 0.0 | GO:1901079 | positive regulation of relaxation of muscle(GO:1901079) |
| 0.0 | 0.2 | GO:0006546 | glycine catabolic process(GO:0006546) glycine decarboxylation via glycine cleavage system(GO:0019464) |
| 0.0 | 0.2 | GO:0097089 | methyl-branched fatty acid metabolic process(GO:0097089) |
| 0.0 | 0.2 | GO:0030886 | negative regulation of myeloid dendritic cell activation(GO:0030886) |
| 0.0 | 0.0 | GO:0003186 | tricuspid valve morphogenesis(GO:0003186) |
| 0.0 | 0.1 | GO:1900073 | regulation of neuromuscular synaptic transmission(GO:1900073) positive regulation of neuromuscular synaptic transmission(GO:1900075) |
| 0.0 | 0.0 | GO:0060081 | membrane hyperpolarization(GO:0060081) |
| 0.0 | 0.1 | GO:0098939 | dendritic transport of mitochondrion(GO:0098939) anterograde dendritic transport of mitochondrion(GO:0098972) |
| 0.0 | 0.2 | GO:1900110 | negative regulation of histone H3-K9 dimethylation(GO:1900110) |
| 0.0 | 0.2 | GO:0044501 | modulation of signal transduction in other organism(GO:0044501) modulation by symbiont of host signal transduction pathway(GO:0052027) modulation of signal transduction in other organism involved in symbiotic interaction(GO:0052250) modulation by symbiont of host I-kappaB kinase/NF-kappaB cascade(GO:0085032) |
| 0.0 | 0.3 | GO:0060399 | positive regulation of growth hormone receptor signaling pathway(GO:0060399) |
| 0.0 | 0.6 | GO:2000623 | regulation of nuclear-transcribed mRNA catabolic process, nonsense-mediated decay(GO:2000622) negative regulation of nuclear-transcribed mRNA catabolic process, nonsense-mediated decay(GO:2000623) |
| 0.0 | 0.1 | GO:0046116 | queuosine biosynthetic process(GO:0008616) queuosine metabolic process(GO:0046116) |
| 0.0 | 0.0 | GO:1901624 | negative regulation of lymphocyte chemotaxis(GO:1901624) |
| 0.0 | 0.2 | GO:0001969 | activation of membrane attack complex(GO:0001905) regulation of activation of membrane attack complex(GO:0001969) |
| 0.0 | 0.7 | GO:0010917 | negative regulation of mitochondrial membrane potential(GO:0010917) |
| 0.0 | 0.4 | GO:0071877 | regulation of adrenergic receptor signaling pathway(GO:0071877) |
| 0.0 | 0.4 | GO:0040032 | post-embryonic body morphogenesis(GO:0040032) |
| 0.0 | 0.0 | GO:1902954 | regulation of early endosome to recycling endosome transport(GO:1902954) |
| 0.0 | 0.0 | GO:0021648 | vestibulocochlear nerve morphogenesis(GO:0021648) vestibulocochlear nerve formation(GO:0021650) |
| 0.0 | 0.4 | GO:0035815 | positive regulation of renal sodium excretion(GO:0035815) |
| 0.0 | 0.3 | GO:0050666 | regulation of sulfur amino acid metabolic process(GO:0031335) regulation of homocysteine metabolic process(GO:0050666) |
| 0.0 | 0.2 | GO:0071506 | response to mycophenolic acid(GO:0071505) cellular response to mycophenolic acid(GO:0071506) |
| 0.0 | 0.2 | GO:0043606 | histidine catabolic process to glutamate and formamide(GO:0019556) histidine catabolic process to glutamate and formate(GO:0019557) formamide metabolic process(GO:0043606) |
| 0.0 | 0.3 | GO:0001999 | renal response to blood flow involved in circulatory renin-angiotensin regulation of systemic arterial blood pressure(GO:0001999) renin secretion into blood stream(GO:0002001) |
| 0.0 | 0.1 | GO:2000510 | positive regulation of dendritic cell chemotaxis(GO:2000510) |
| 0.0 | 0.3 | GO:0033133 | positive regulation of glucokinase activity(GO:0033133) positive regulation of hexokinase activity(GO:1903301) |
| 0.0 | 0.2 | GO:0001188 | RNA polymerase I transcriptional preinitiation complex assembly(GO:0001188) RNA polymerase I transcriptional preinitiation complex assembly at the promoter for the nuclear large rRNA transcript(GO:0001189) |
| 0.0 | 0.1 | GO:0035281 | pre-miRNA export from nucleus(GO:0035281) |
| 0.0 | 0.0 | GO:0048627 | myoblast development(GO:0048627) |
| 0.0 | 0.3 | GO:0002318 | myeloid progenitor cell differentiation(GO:0002318) |
| 0.0 | 0.2 | GO:0001928 | regulation of exocyst assembly(GO:0001928) regulation of exocyst localization(GO:0060178) |
| 0.0 | 0.0 | GO:0010847 | regulation of chromatin assembly(GO:0010847) |
| 0.0 | 0.3 | GO:0006269 | DNA replication, synthesis of RNA primer(GO:0006269) |
| 0.0 | 0.3 | GO:1905150 | regulation of voltage-gated sodium channel activity(GO:1905150) |
| 0.0 | 0.0 | GO:2000617 | positive regulation of histone H3-K9 acetylation(GO:2000617) |
| 0.0 | 0.1 | GO:0002881 | negative regulation of chronic inflammatory response to non-antigenic stimulus(GO:0002881) |
| 0.0 | 0.2 | GO:1903751 | regulation of intrinsic apoptotic signaling pathway in response to hydrogen peroxide(GO:1903750) negative regulation of intrinsic apoptotic signaling pathway in response to hydrogen peroxide(GO:1903751) |
| 0.0 | 0.0 | GO:0018879 | biphenyl metabolic process(GO:0018879) |
| 0.0 | 0.4 | GO:0009414 | response to water deprivation(GO:0009414) |
| 0.0 | 0.2 | GO:0044837 | assembly of actomyosin apparatus involved in cytokinesis(GO:0000912) actomyosin contractile ring assembly(GO:0000915) actomyosin contractile ring organization(GO:0044837) |
| 0.0 | 0.2 | GO:2000402 | negative regulation of lymphocyte migration(GO:2000402) |
| 0.0 | 0.1 | GO:0061158 | 3'-UTR-mediated mRNA destabilization(GO:0061158) |
| 0.0 | 0.2 | GO:0035723 | interleukin-15-mediated signaling pathway(GO:0035723) cellular response to interleukin-15(GO:0071350) |
| 0.0 | 0.1 | GO:0090403 | oxidative stress-induced premature senescence(GO:0090403) |
| 0.0 | 0.1 | GO:0051685 | maintenance of ER location(GO:0051685) |
| 0.0 | 0.2 | GO:0006789 | bilirubin conjugation(GO:0006789) |
| 0.0 | 0.1 | GO:1900027 | regulation of ruffle assembly(GO:1900027) |
| 0.0 | 0.1 | GO:0097267 | omega-hydroxylase P450 pathway(GO:0097267) |
| 0.0 | 0.1 | GO:0072717 | cellular response to actinomycin D(GO:0072717) |
| 0.0 | 0.0 | GO:0051562 | negative regulation of mitochondrial calcium ion concentration(GO:0051562) |
| 0.0 | 0.1 | GO:0006433 | glutamyl-tRNA aminoacylation(GO:0006424) prolyl-tRNA aminoacylation(GO:0006433) |
| 0.0 | 0.2 | GO:0002270 | plasmacytoid dendritic cell activation(GO:0002270) regulation of restriction endodeoxyribonuclease activity(GO:0032072) T-helper 1 cell activation(GO:0035711) negative regulation of apoptotic cell clearance(GO:2000426) |
| 0.0 | 0.2 | GO:0035026 | leading edge cell differentiation(GO:0035026) |
| 0.0 | 0.2 | GO:0006997 | nucleus organization(GO:0006997) |
| 0.0 | 0.1 | GO:1901741 | regulation of myoblast fusion(GO:1901739) positive regulation of myoblast fusion(GO:1901741) |
| 0.0 | 0.2 | GO:0009052 | pentose-phosphate shunt, non-oxidative branch(GO:0009052) |
| 0.0 | 0.1 | GO:0061394 | regulation of transcription from RNA polymerase II promoter in response to arsenic-containing substance(GO:0061394) |
| 0.0 | 0.2 | GO:0097021 | lymphocyte migration into lymphoid organs(GO:0097021) |
| 0.0 | 0.3 | GO:0060136 | embryonic process involved in female pregnancy(GO:0060136) |
| 0.0 | 0.4 | GO:0035405 | histone-threonine phosphorylation(GO:0035405) |
| 0.0 | 0.1 | GO:0006781 | succinyl-CoA pathway(GO:0006781) |
| 0.0 | 0.1 | GO:0033484 | nitric oxide homeostasis(GO:0033484) |
| 0.0 | 0.2 | GO:2000491 | positive regulation of hepatic stellate cell activation(GO:2000491) |
| 0.0 | 0.3 | GO:0001867 | complement activation, lectin pathway(GO:0001867) |
| 0.0 | 0.2 | GO:0035900 | response to isolation stress(GO:0035900) |
| 0.0 | 0.4 | GO:2001181 | positive regulation of interleukin-10 secretion(GO:2001181) |
| 0.0 | 0.1 | GO:0014734 | skeletal muscle hypertrophy(GO:0014734) |
| 0.0 | 0.1 | GO:0002361 | CD4-positive, CD25-positive, alpha-beta regulatory T cell differentiation(GO:0002361) |
| 0.0 | 0.1 | GO:0001812 | positive regulation of type I hypersensitivity(GO:0001812) |
| 0.0 | 0.1 | GO:2000669 | gamma-delta T cell activation involved in immune response(GO:0002290) negative regulation of interferon-beta secretion(GO:0035548) negative regulation of dendritic cell apoptotic process(GO:2000669) negative regulation of CD8-positive, alpha-beta T cell activation(GO:2001186) regulation of gamma-delta T cell activation involved in immune response(GO:2001191) positive regulation of gamma-delta T cell activation involved in immune response(GO:2001193) |
| 0.0 | 0.2 | GO:0045229 | cell envelope organization(GO:0043163) external encapsulating structure organization(GO:0045229) |
| 0.0 | 0.1 | GO:2000418 | positive regulation of eosinophil migration(GO:2000418) |
| 0.0 | 0.2 | GO:1901907 | diadenosine polyphosphate catabolic process(GO:0015961) diphosphoinositol polyphosphate metabolic process(GO:0071543) diadenosine pentaphosphate metabolic process(GO:1901906) diadenosine pentaphosphate catabolic process(GO:1901907) diadenosine hexaphosphate metabolic process(GO:1901908) diadenosine hexaphosphate catabolic process(GO:1901909) adenosine 5'-(hexahydrogen pentaphosphate) metabolic process(GO:1901910) adenosine 5'-(hexahydrogen pentaphosphate) catabolic process(GO:1901911) |
| 0.0 | 0.2 | GO:0032213 | regulation of telomere maintenance via semi-conservative replication(GO:0032213) negative regulation of telomere maintenance via semi-conservative replication(GO:0032214) |
| 0.0 | 0.3 | GO:0042866 | pyruvate biosynthetic process(GO:0042866) |
| 0.0 | 0.1 | GO:0010259 | multicellular organism aging(GO:0010259) |
| 0.0 | 0.4 | GO:0061299 | retina vasculature morphogenesis in camera-type eye(GO:0061299) |
| 0.0 | 0.2 | GO:0071163 | DNA replication preinitiation complex assembly(GO:0071163) |
| 0.0 | 0.0 | GO:0031125 | rRNA 3'-end processing(GO:0031125) |
| 0.0 | 0.1 | GO:0070101 | positive regulation of chemokine-mediated signaling pathway(GO:0070101) |
| 0.0 | 0.1 | GO:0014055 | acetylcholine secretion, neurotransmission(GO:0014055) regulation of acetylcholine secretion, neurotransmission(GO:0014056) |
| 0.0 | 0.1 | GO:0050976 | detection of mechanical stimulus involved in sensory perception of touch(GO:0050976) |
| 0.0 | 0.2 | GO:0097428 | protein maturation by iron-sulfur cluster transfer(GO:0097428) |
| 0.0 | 0.2 | GO:0035455 | response to interferon-alpha(GO:0035455) |
| 0.0 | 0.1 | GO:0048203 | vesicle targeting, trans-Golgi to endosome(GO:0048203) |
| 0.0 | 0.2 | GO:0046391 | 5-phosphoribose 1-diphosphate biosynthetic process(GO:0006015) 5-phosphoribose 1-diphosphate metabolic process(GO:0046391) |
| 0.0 | 0.2 | GO:0008218 | bioluminescence(GO:0008218) |
| 0.0 | 0.1 | GO:0009386 | translational attenuation(GO:0009386) |
| 0.0 | 0.0 | GO:0060411 | cardiac septum morphogenesis(GO:0060411) |
| 0.0 | 0.2 | GO:0034653 | diterpenoid catabolic process(GO:0016103) retinoic acid catabolic process(GO:0034653) |
| 0.0 | 0.2 | GO:0048496 | maintenance of organ identity(GO:0048496) |
| 0.0 | 0.1 | GO:1903674 | regulation of cap-dependent translational initiation(GO:1903674) positive regulation of cap-dependent translational initiation(GO:1903676) |
| 0.0 | 0.1 | GO:0045081 | negative regulation of interleukin-10 biosynthetic process(GO:0045081) |
| 0.0 | 0.1 | GO:0051102 | DNA ligation involved in DNA recombination(GO:0051102) |
| 0.0 | 0.2 | GO:0019065 | receptor-mediated endocytosis of virus by host cell(GO:0019065) endocytosis involved in viral entry into host cell(GO:0075509) |
| 0.0 | 0.3 | GO:0002227 | innate immune response in mucosa(GO:0002227) |
| 0.0 | 0.1 | GO:0032290 | peripheral nervous system myelin formation(GO:0032290) |
| 0.0 | 0.1 | GO:0045715 | negative regulation of low-density lipoprotein particle receptor biosynthetic process(GO:0045715) |
| 0.0 | 0.6 | GO:0002523 | leukocyte migration involved in inflammatory response(GO:0002523) |
| 0.0 | 0.1 | GO:0021502 | neural fold elevation formation(GO:0021502) allantois development(GO:1905069) |
| 0.0 | 0.2 | GO:0051490 | negative regulation of filopodium assembly(GO:0051490) |
| 0.0 | 0.0 | GO:0060236 | regulation of mitotic spindle organization(GO:0060236) regulation of spindle organization(GO:0090224) |
| 0.0 | 0.2 | GO:0006543 | glutamine catabolic process(GO:0006543) |
| 0.0 | 0.0 | GO:0033591 | response to L-ascorbic acid(GO:0033591) |
| 0.0 | 0.1 | GO:0030327 | prenylated protein catabolic process(GO:0030327) |
| 0.0 | 0.1 | GO:1901053 | sarcosine metabolic process(GO:1901052) sarcosine catabolic process(GO:1901053) |
| 0.0 | 0.1 | GO:2000687 | negative regulation of rubidium ion transport(GO:2000681) negative regulation of rubidium ion transmembrane transporter activity(GO:2000687) |
| 0.0 | 0.1 | GO:0040009 | regulation of growth rate(GO:0040009) |
| 0.0 | 0.1 | GO:0048936 | peripheral nervous system neuron axonogenesis(GO:0048936) |
| 0.0 | 0.3 | GO:0098967 | exocytic insertion of neurotransmitter receptor to plasma membrane(GO:0098881) exocytic insertion of neurotransmitter receptor to postsynaptic membrane(GO:0098967) |
| 0.0 | 0.2 | GO:0006930 | substrate-dependent cell migration, cell extension(GO:0006930) |
| 0.0 | 0.1 | GO:1902283 | negative regulation of primary amine oxidase activity(GO:1902283) |
| 0.0 | 0.2 | GO:0038183 | bile acid signaling pathway(GO:0038183) |
| 0.0 | 0.1 | GO:0048213 | Golgi vesicle prefusion complex stabilization(GO:0048213) |
| 0.0 | 0.1 | GO:0007057 | spindle assembly involved in female meiosis I(GO:0007057) |
| 0.0 | 0.2 | GO:0019856 | 'de novo' pyrimidine nucleobase biosynthetic process(GO:0006207) pyrimidine nucleobase biosynthetic process(GO:0019856) |
| 0.0 | 0.9 | GO:0022400 | regulation of rhodopsin mediated signaling pathway(GO:0022400) |
| 0.0 | 0.1 | GO:0044245 | polysaccharide digestion(GO:0044245) |
| 0.0 | 0.0 | GO:0071496 | cellular response to external stimulus(GO:0071496) |
| 0.0 | 0.1 | GO:0070681 | glutaminyl-tRNAGln biosynthesis via transamidation(GO:0070681) |
| 0.0 | 0.3 | GO:0010957 | negative regulation of vitamin D biosynthetic process(GO:0010957) |
| 0.0 | 0.1 | GO:0031642 | negative regulation of myelination(GO:0031642) |
| 0.0 | 0.3 | GO:0050703 | interleukin-1 alpha secretion(GO:0050703) |
| 0.0 | 0.1 | GO:2001187 | positive regulation of CD8-positive, alpha-beta T cell activation(GO:2001187) |
| 0.0 | 0.1 | GO:0016999 | antibiotic metabolic process(GO:0016999) cellular amide catabolic process(GO:0043605) |
| 0.0 | 0.1 | GO:0090158 | endoplasmic reticulum membrane organization(GO:0090158) |
| 0.0 | 0.1 | GO:0006533 | aspartate catabolic process(GO:0006533) |
| 0.0 | 0.2 | GO:0003065 | positive regulation of heart rate by epinephrine(GO:0003065) |
| 0.0 | 0.1 | GO:0060166 | olfactory pit development(GO:0060166) |
| 0.0 | 0.1 | GO:0001808 | negative regulation of type IV hypersensitivity(GO:0001808) |
| 0.0 | 0.0 | GO:0070232 | regulation of T cell apoptotic process(GO:0070232) |
| 0.0 | 0.2 | GO:0010324 | phagocytosis, engulfment(GO:0006911) membrane invagination(GO:0010324) |
| 0.0 | 0.1 | GO:0042116 | macrophage activation(GO:0042116) |
| 0.0 | 0.1 | GO:0008355 | olfactory learning(GO:0008355) |
| 0.0 | 0.1 | GO:2000051 | negative regulation of non-canonical Wnt signaling pathway(GO:2000051) |
| 0.0 | 0.1 | GO:0008052 | sensory organ boundary specification(GO:0008052) formation of organ boundary(GO:0010160) taste bud development(GO:0061193) |
| 0.0 | 0.2 | GO:2000158 | positive regulation of ubiquitin-specific protease activity(GO:2000158) |
| 0.0 | 0.2 | GO:0090131 | mesenchyme migration(GO:0090131) |
| 0.0 | 0.1 | GO:0030382 | sperm mitochondrion organization(GO:0030382) |
| 0.0 | 0.2 | GO:0098912 | membrane depolarization during atrial cardiac muscle cell action potential(GO:0098912) |
| 0.0 | 0.6 | GO:0071624 | positive regulation of granulocyte chemotaxis(GO:0071624) |
| 0.0 | 0.1 | GO:0090086 | negative regulation of protein deubiquitination(GO:0090086) |
| 0.0 | 0.1 | GO:0051780 | mevalonate transport(GO:0015728) behavioral response to nutrient(GO:0051780) |
| 0.0 | 0.2 | GO:0090309 | positive regulation of methylation-dependent chromatin silencing(GO:0090309) |
| 0.0 | 0.2 | GO:0006177 | GMP biosynthetic process(GO:0006177) |
| 0.0 | 1.2 | GO:0018146 | keratan sulfate biosynthetic process(GO:0018146) |
| 0.0 | 0.1 | GO:1903410 | lysine import(GO:0034226) L-lysine import(GO:0061461) L-lysine import into cell(GO:1903410) |
| 0.0 | 0.1 | GO:1903597 | negative regulation of gap junction assembly(GO:1903597) |
| 0.0 | 0.1 | GO:0060931 | sinoatrial node cell development(GO:0060931) |
| 0.0 | 0.2 | GO:0038195 | urokinase plasminogen activator signaling pathway(GO:0038195) |
| 0.0 | 0.3 | GO:0021678 | third ventricle development(GO:0021678) |
| 0.0 | 0.1 | GO:0000472 | endonucleolytic cleavage to generate mature 5'-end of SSU-rRNA from (SSU-rRNA, 5.8S rRNA, LSU-rRNA)(GO:0000472) rRNA 5'-end processing(GO:0000967) ncRNA 5'-end processing(GO:0034471) |
| 0.0 | 0.1 | GO:1900222 | regulation of very-low-density lipoprotein particle clearance(GO:0010915) negative regulation of very-low-density lipoprotein particle clearance(GO:0010916) negative regulation of beta-amyloid clearance(GO:1900222) |
| 0.0 | 0.1 | GO:1900226 | negative regulation of NLRP3 inflammasome complex assembly(GO:1900226) |
| 0.0 | 0.3 | GO:0035095 | behavioral response to nicotine(GO:0035095) |
| 0.0 | 0.4 | GO:0035878 | nail development(GO:0035878) |
| 0.0 | 0.1 | GO:0045658 | regulation of neutrophil differentiation(GO:0045658) negative regulation of neutrophil differentiation(GO:0045659) |
| 0.0 | 0.1 | GO:0032849 | positive regulation of cellular pH reduction(GO:0032849) |
| 0.0 | 0.3 | GO:0034145 | positive regulation of toll-like receptor 4 signaling pathway(GO:0034145) |
| 0.0 | 0.1 | GO:0060750 | epithelial cell proliferation involved in mammary gland duct elongation(GO:0060750) |
| 0.0 | 0.1 | GO:0046373 | arabinose metabolic process(GO:0019566) L-arabinose metabolic process(GO:0046373) |
| 0.0 | 0.1 | GO:0043366 | beta selection(GO:0043366) |
| 0.0 | 0.1 | GO:0060382 | regulation of DNA strand elongation(GO:0060382) |
| 0.0 | 0.2 | GO:0001554 | luteolysis(GO:0001554) |
| 0.0 | 0.3 | GO:0019317 | fucose catabolic process(GO:0019317) L-fucose metabolic process(GO:0042354) L-fucose catabolic process(GO:0042355) |
| 0.0 | 0.3 | GO:0051491 | positive regulation of filopodium assembly(GO:0051491) |
| 0.0 | 0.1 | GO:0045872 | positive regulation of rhodopsin gene expression(GO:0045872) |
| 0.0 | 0.1 | GO:0002862 | negative regulation of inflammatory response to antigenic stimulus(GO:0002862) |
| 0.0 | 0.2 | GO:0044565 | dendritic cell proliferation(GO:0044565) |
| 0.0 | 0.1 | GO:0071894 | histone H2B conserved C-terminal lysine ubiquitination(GO:0071894) |
| 0.0 | 0.1 | GO:0042369 | vitamin D catabolic process(GO:0042369) |
| 0.0 | 0.1 | GO:0007571 | age-dependent response to oxidative stress(GO:0001306) age-dependent response to reactive oxygen species(GO:0001315) regulation of systemic arterial blood pressure by acetylcholine(GO:0003068) vasodilation by acetylcholine involved in regulation of systemic arterial blood pressure(GO:0003069) regulation of systemic arterial blood pressure by neurotransmitter(GO:0003070) age-dependent general metabolic decline(GO:0007571) |
| 0.0 | 0.0 | GO:0060300 | regulation of cytokine activity(GO:0060300) |
| 0.0 | 0.1 | GO:0006435 | threonyl-tRNA aminoacylation(GO:0006435) |
| 0.0 | 0.0 | GO:2000824 | negative regulation of androgen receptor activity(GO:2000824) |
| 0.0 | 0.1 | GO:2001288 | positive regulation of caveolin-mediated endocytosis(GO:2001288) |
| 0.0 | 0.1 | GO:2000298 | regulation of Rho-dependent protein serine/threonine kinase activity(GO:2000298) |
| 0.0 | 0.0 | GO:0080120 | CAAX-box protein processing(GO:0071586) CAAX-box protein maturation(GO:0080120) |
| 0.0 | 0.5 | GO:1902083 | negative regulation of peptidyl-cysteine S-nitrosylation(GO:1902083) |
| 0.0 | 0.1 | GO:0010982 | regulation of high-density lipoprotein particle clearance(GO:0010982) positive regulation of high-density lipoprotein particle clearance(GO:0010983) |
| 0.0 | 0.0 | GO:0090210 | regulation of establishment of blood-brain barrier(GO:0090210) negative regulation of establishment of blood-brain barrier(GO:0090212) |
| 0.0 | 0.0 | GO:0035441 | cell migration involved in vasculogenesis(GO:0035441) |
| 0.0 | 0.0 | GO:0007016 | cytoskeletal anchoring at plasma membrane(GO:0007016) |
| 0.0 | 0.2 | GO:1900623 | regulation of monocyte aggregation(GO:1900623) positive regulation of monocyte aggregation(GO:1900625) |
| 0.0 | 0.5 | GO:0090084 | negative regulation of inclusion body assembly(GO:0090084) |
| 0.0 | 0.1 | GO:0036112 | medium-chain fatty-acyl-CoA metabolic process(GO:0036112) |
| 0.0 | 0.1 | GO:1903031 | regulation of microtubule plus-end binding(GO:1903031) positive regulation of microtubule plus-end binding(GO:1903033) |
| 0.0 | 0.0 | GO:0044359 | modulation of molecular function in other organism(GO:0044359) negative regulation of molecular function in other organism(GO:0044362) negative regulation of molecular function in other organism involved in symbiotic interaction(GO:0052204) modulation of molecular function in other organism involved in symbiotic interaction(GO:0052205) negative regulation by host of symbiont molecular function(GO:0052405) modification by host of symbiont molecular function(GO:0052428) |
| 0.0 | 0.2 | GO:0090267 | positive regulation of mitotic cell cycle spindle assembly checkpoint(GO:0090267) |
| 0.0 | 0.3 | GO:0033141 | positive regulation of peptidyl-serine phosphorylation of STAT protein(GO:0033141) |
| 0.0 | 0.1 | GO:2000690 | regulation of cardiac muscle cell myoblast differentiation(GO:2000690) negative regulation of cardiac muscle cell myoblast differentiation(GO:2000691) |
| 0.0 | 0.1 | GO:0045900 | negative regulation of translational elongation(GO:0045900) |
| 0.0 | 0.1 | GO:0033615 | mitochondrial proton-transporting ATP synthase complex assembly(GO:0033615) |
| 0.0 | 0.1 | GO:0034184 | positive regulation of maintenance of sister chromatid cohesion(GO:0034093) positive regulation of maintenance of mitotic sister chromatid cohesion(GO:0034184) |
| 0.0 | 0.0 | GO:0001992 | regulation of systemic arterial blood pressure by vasopressin(GO:0001992) |
| 0.0 | 0.1 | GO:0048170 | positive regulation of long-term neuronal synaptic plasticity(GO:0048170) |
| 0.0 | 0.1 | GO:0071503 | response to heparin(GO:0071503) cellular response to heparin(GO:0071504) |
| 0.0 | 0.3 | GO:0045654 | positive regulation of megakaryocyte differentiation(GO:0045654) |
| 0.0 | 0.1 | GO:0006447 | regulation of translational initiation by iron(GO:0006447) |
| 0.0 | 0.1 | GO:0046086 | adenosine biosynthetic process(GO:0046086) |
| 0.0 | 0.0 | GO:0048850 | hypophysis morphogenesis(GO:0048850) |
| 0.0 | 0.1 | GO:0006864 | pyrimidine nucleotide transport(GO:0006864) mitochondrial pyrimidine nucleotide import(GO:1990519) |
| 0.0 | 0.1 | GO:0070781 | response to biotin(GO:0070781) |
| 0.0 | 0.2 | GO:0002430 | complement receptor mediated signaling pathway(GO:0002430) |
| 0.0 | 0.2 | GO:1903959 | regulation of anion transmembrane transport(GO:1903959) |
| 0.0 | 0.4 | GO:2000675 | negative regulation of type B pancreatic cell apoptotic process(GO:2000675) |
| 0.0 | 0.1 | GO:0008204 | ergosterol biosynthetic process(GO:0006696) ergosterol metabolic process(GO:0008204) |
| 0.0 | 0.1 | GO:0015966 | diadenosine polyphosphate biosynthetic process(GO:0015960) diadenosine tetraphosphate metabolic process(GO:0015965) diadenosine tetraphosphate biosynthetic process(GO:0015966) |
| 0.0 | 0.1 | GO:0042137 | sequestering of neurotransmitter(GO:0042137) |
| 0.0 | 0.1 | GO:0060179 | male mating behavior(GO:0060179) |
| 0.0 | 0.0 | GO:0006114 | glycerol biosynthetic process(GO:0006114) |
| 0.0 | 0.1 | GO:0014722 | regulation of skeletal muscle contraction by calcium ion signaling(GO:0014722) |
| 0.0 | 0.4 | GO:1904896 | ESCRT complex disassembly(GO:1904896) ESCRT III complex disassembly(GO:1904903) |
| 0.0 | 0.0 | GO:0030885 | regulation of myeloid dendritic cell activation(GO:0030885) |
| 0.0 | 0.2 | GO:0002385 | mucosal immune response(GO:0002385) |
| 0.0 | 0.1 | GO:0033364 | mast cell secretory granule organization(GO:0033364) |
| 0.0 | 0.2 | GO:0045836 | positive regulation of meiotic nuclear division(GO:0045836) |
| 0.0 | 0.7 | GO:0007214 | gamma-aminobutyric acid signaling pathway(GO:0007214) |
| 0.0 | 0.0 | GO:0033023 | mast cell homeostasis(GO:0033023) mast cell apoptotic process(GO:0033024) regulation of mast cell apoptotic process(GO:0033025) |
| 0.0 | 0.2 | GO:0036337 | Fas signaling pathway(GO:0036337) |
| 0.0 | 0.0 | GO:0035106 | operant conditioning(GO:0035106) |
| 0.0 | 0.1 | GO:0030916 | otic vesicle formation(GO:0030916) |
| 0.0 | 0.0 | GO:0097029 | mature conventional dendritic cell differentiation(GO:0097029) |
| 0.0 | 0.0 | GO:0010718 | positive regulation of epithelial to mesenchymal transition(GO:0010718) |
| 0.0 | 0.1 | GO:1904158 | axonemal central apparatus assembly(GO:1904158) |
| 0.0 | 0.0 | GO:0030309 | poly-N-acetyllactosamine metabolic process(GO:0030309) poly-N-acetyllactosamine biosynthetic process(GO:0030311) |
| 0.0 | 0.2 | GO:1902996 | regulation of neuronal signal transduction(GO:1902847) neurofibrillary tangle assembly(GO:1902988) regulation of neurofibrillary tangle assembly(GO:1902996) positive regulation of neurofibrillary tangle assembly(GO:1902998) |
| 0.0 | 0.1 | GO:0043950 | positive regulation of cAMP-mediated signaling(GO:0043950) |
| 0.0 | 0.1 | GO:0021590 | cerebellum maturation(GO:0021590) cerebellar cortex maturation(GO:0021699) |
| 0.0 | 0.0 | GO:2000767 | positive regulation of cytoplasmic translation(GO:2000767) |
| 0.0 | 0.2 | GO:0032525 | somite rostral/caudal axis specification(GO:0032525) |
| 0.0 | 0.0 | GO:1902969 | mitotic DNA replication(GO:1902969) |
| 0.0 | 0.1 | GO:0097084 | vascular smooth muscle cell development(GO:0097084) |
| 0.0 | 0.1 | GO:0010886 | positive regulation of cholesterol storage(GO:0010886) |
| 0.0 | 0.2 | GO:0002329 | pre-B cell differentiation(GO:0002329) |
| 0.0 | 0.1 | GO:2000672 | negative regulation of motor neuron apoptotic process(GO:2000672) |
| 0.0 | 0.1 | GO:0031508 | pericentric heterochromatin assembly(GO:0031508) |
| 0.0 | 0.2 | GO:0002943 | tRNA dihydrouridine synthesis(GO:0002943) |
| 0.0 | 0.4 | GO:0035988 | chondrocyte proliferation(GO:0035988) |
| 0.0 | 0.1 | GO:0071344 | diphosphate metabolic process(GO:0071344) |
| 0.0 | 0.1 | GO:1903551 | regulation of extracellular exosome assembly(GO:1903551) |
| 0.0 | 0.2 | GO:0035754 | B cell chemotaxis(GO:0035754) |
| 0.0 | 0.1 | GO:0030047 | actin modification(GO:0030047) |
| 0.0 | 0.2 | GO:0042048 | olfactory behavior(GO:0042048) |
| 0.0 | 0.0 | GO:0035696 | monocyte extravasation(GO:0035696) regulation of monocyte extravasation(GO:2000437) |
| 0.0 | 0.0 | GO:1903979 | regulation of microglial cell activation(GO:1903978) negative regulation of microglial cell activation(GO:1903979) |
| 0.0 | 0.1 | GO:0043490 | malate-aspartate shuttle(GO:0043490) |
| 0.0 | 0.1 | GO:0051083 | 'de novo' cotranslational protein folding(GO:0051083) |
| 0.0 | 0.1 | GO:1903070 | negative regulation of ER-associated ubiquitin-dependent protein catabolic process(GO:1903070) |
| 0.0 | 0.0 | GO:0036369 | transcription factor catabolic process(GO:0036369) |
| 0.0 | 0.1 | GO:0048318 | axial mesoderm development(GO:0048318) |
| 0.0 | 0.1 | GO:0051754 | meiotic sister chromatid cohesion, centromeric(GO:0051754) |
| 0.0 | 0.1 | GO:0036258 | multivesicular body assembly(GO:0036258) |
| 0.0 | 0.2 | GO:0010593 | negative regulation of lamellipodium assembly(GO:0010593) |
| 0.0 | 0.1 | GO:0071283 | cellular response to iron(III) ion(GO:0071283) |
| 0.0 | 0.1 | GO:0000973 | posttranscriptional tethering of RNA polymerase II gene DNA at nuclear periphery(GO:0000973) |
| 0.0 | 0.2 | GO:0060134 | prepulse inhibition(GO:0060134) |
| 0.0 | 0.2 | GO:0000414 | regulation of histone H3-K36 methylation(GO:0000414) |
| 0.0 | 0.1 | GO:0006880 | intracellular sequestering of iron ion(GO:0006880) sequestering of iron ion(GO:0097577) |
| 0.0 | 0.2 | GO:1901660 | calcium ion export(GO:1901660) calcium ion export from cell(GO:1990034) |
| 0.0 | 0.0 | GO:0045837 | negative regulation of membrane potential(GO:0045837) |
| 0.0 | 0.1 | GO:0015747 | urate transport(GO:0015747) |
| 0.0 | 0.0 | GO:0060164 | regulation of timing of neuron differentiation(GO:0060164) |
| 0.0 | 0.0 | GO:0032310 | prostaglandin secretion(GO:0032310) |
| 0.0 | 0.2 | GO:0070973 | protein localization to endoplasmic reticulum exit site(GO:0070973) |
| 0.0 | 0.0 | GO:0042495 | detection of triacyl bacterial lipopeptide(GO:0042495) detection of bacterial lipopeptide(GO:0070340) |
| 0.0 | 0.1 | GO:0072385 | minus-end-directed organelle transport along microtubule(GO:0072385) |
| 0.0 | 0.1 | GO:0007320 | insemination(GO:0007320) |
| 0.0 | 0.2 | GO:0015705 | iodide transport(GO:0015705) |
| 0.0 | 0.1 | GO:0009153 | purine deoxyribonucleotide biosynthetic process(GO:0009153) purine deoxyribonucleoside diphosphate biosynthetic process(GO:0009183) |
| 0.0 | 0.1 | GO:0001550 | ovarian cumulus expansion(GO:0001550) fused antrum stage(GO:0048165) |
| 0.0 | 0.2 | GO:0048022 | negative regulation of melanin biosynthetic process(GO:0048022) negative regulation of secondary metabolite biosynthetic process(GO:1900377) |
| 0.0 | 0.1 | GO:0050955 | thermoception(GO:0050955) |
| 0.0 | 0.1 | GO:1904688 | regulation of cap-independent translational initiation(GO:1903677) positive regulation of cap-independent translational initiation(GO:1903679) regulation of cytoplasmic translational initiation(GO:1904688) positive regulation of cytoplasmic translational initiation(GO:1904690) |
| 0.0 | 0.3 | GO:0061734 | parkin-mediated mitophagy in response to mitochondrial depolarization(GO:0061734) |
| 0.0 | 0.2 | GO:0035507 | regulation of myosin-light-chain-phosphatase activity(GO:0035507) |
| 0.0 | 0.1 | GO:1900169 | regulation of glucocorticoid mediated signaling pathway(GO:1900169) |
| 0.0 | 0.1 | GO:0006667 | sphinganine metabolic process(GO:0006667) |
| 0.0 | 0.0 | GO:0030826 | regulation of cGMP biosynthetic process(GO:0030826) |
| 0.0 | 0.1 | GO:0018277 | protein deamination(GO:0018277) |
| 0.0 | 0.1 | GO:0090285 | negative regulation of protein glycosylation in Golgi(GO:0090285) |
| 0.0 | 0.0 | GO:0045425 | positive regulation of granulocyte macrophage colony-stimulating factor biosynthetic process(GO:0045425) |
| 0.0 | 0.1 | GO:0045110 | intermediate filament bundle assembly(GO:0045110) |
| 0.0 | 0.1 | GO:2000255 | negative regulation of male germ cell proliferation(GO:2000255) |
| 0.0 | 0.1 | GO:2000254 | regulation of male germ cell proliferation(GO:2000254) |
| 0.0 | 0.1 | GO:1900104 | hyaluranon cable assembly(GO:0036118) regulation of hyaluranon cable assembly(GO:1900104) positive regulation of hyaluranon cable assembly(GO:1900106) |
| 0.0 | 0.3 | GO:0010510 | regulation of acetyl-CoA biosynthetic process from pyruvate(GO:0010510) |
| 0.0 | 0.1 | GO:0010830 | regulation of myotube differentiation(GO:0010830) |
| 0.0 | 0.3 | GO:0045475 | locomotor rhythm(GO:0045475) |
| 0.0 | 0.1 | GO:0046947 | hydroxylysine metabolic process(GO:0046946) hydroxylysine biosynthetic process(GO:0046947) |
| 0.0 | 0.0 | GO:0045651 | positive regulation of macrophage differentiation(GO:0045651) |
| 0.0 | 0.1 | GO:0018076 | N-terminal peptidyl-lysine acetylation(GO:0018076) |
| 0.0 | 0.0 | GO:0002856 | negative regulation of response to tumor cell(GO:0002835) negative regulation of immune response to tumor cell(GO:0002838) negative regulation of natural killer cell mediated immune response to tumor cell(GO:0002856) negative regulation of natural killer cell mediated cytotoxicity directed against tumor cell target(GO:0002859) |
| 0.0 | 0.2 | GO:0046548 | retinal rod cell development(GO:0046548) |
| 0.0 | 0.0 | GO:0015870 | acetylcholine transport(GO:0015870) |
| 0.0 | 0.1 | GO:1903966 | monounsaturated fatty acid metabolic process(GO:1903964) monounsaturated fatty acid biosynthetic process(GO:1903966) |
| 0.0 | 0.2 | GO:0003190 | atrioventricular valve formation(GO:0003190) |
| 0.0 | 0.1 | GO:0002018 | renin-angiotensin regulation of aldosterone production(GO:0002018) |
| 0.0 | 0.1 | GO:0006429 | leucyl-tRNA aminoacylation(GO:0006429) |
| 0.0 | 0.1 | GO:0010592 | positive regulation of lamellipodium assembly(GO:0010592) |
| 0.0 | 0.1 | GO:0007181 | transforming growth factor beta receptor complex assembly(GO:0007181) |
| 0.0 | 0.2 | GO:0007258 | JUN phosphorylation(GO:0007258) |
| 0.0 | 0.6 | GO:0071174 | mitotic spindle checkpoint(GO:0071174) |
| 0.0 | 0.1 | GO:0038098 | sequestering of BMP from receptor via BMP binding(GO:0038098) negative regulation of monocyte chemotaxis(GO:0090027) |
| 0.0 | 0.1 | GO:1904744 | positive regulation of telomeric DNA binding(GO:1904744) |
| 0.0 | 0.1 | GO:0061092 | regulation of phospholipid translocation(GO:0061091) positive regulation of phospholipid translocation(GO:0061092) |
| 0.0 | 0.1 | GO:0000189 | MAPK import into nucleus(GO:0000189) |
| 0.0 | 0.2 | GO:0045835 | negative regulation of meiotic nuclear division(GO:0045835) |
| 0.0 | 0.2 | GO:0048302 | regulation of isotype switching to IgG isotypes(GO:0048302) |
| 0.0 | 0.1 | GO:0031860 | telomeric 3' overhang formation(GO:0031860) |
| 0.0 | 0.1 | GO:0007263 | nitric oxide mediated signal transduction(GO:0007263) |
| 0.0 | 0.1 | GO:0085020 | protein K6-linked ubiquitination(GO:0085020) |
| 0.0 | 0.1 | GO:0051940 | regulation of dopamine uptake involved in synaptic transmission(GO:0051584) regulation of catecholamine uptake involved in synaptic transmission(GO:0051940) |
| 0.0 | 0.2 | GO:2000601 | positive regulation of Arp2/3 complex-mediated actin nucleation(GO:2000601) |
| 0.0 | 0.2 | GO:0030432 | peristalsis(GO:0030432) |
| 0.0 | 0.1 | GO:0050982 | detection of mechanical stimulus(GO:0050982) |
| 0.0 | 0.0 | GO:0034453 | microtubule anchoring(GO:0034453) |
| 0.0 | 0.2 | GO:0018317 | protein C-linked glycosylation(GO:0018103) peptidyl-tryptophan modification(GO:0018211) protein C-linked glycosylation via tryptophan(GO:0018317) protein C-linked glycosylation via 2'-alpha-mannosyl-L-tryptophan(GO:0018406) |
| 0.0 | 0.1 | GO:2000295 | regulation of hydrogen peroxide catabolic process(GO:2000295) |
| 0.0 | 0.1 | GO:0050434 | positive regulation of viral transcription(GO:0050434) |
| 0.0 | 0.0 | GO:0032877 | positive regulation of DNA endoreduplication(GO:0032877) |
| 0.0 | 0.0 | GO:0060979 | vasculogenesis involved in coronary vascular morphogenesis(GO:0060979) |
| 0.0 | 0.0 | GO:1901301 | regulation of cargo loading into COPII-coated vesicle(GO:1901301) |
| 0.0 | 0.1 | GO:0035521 | monoubiquitinated histone deubiquitination(GO:0035521) monoubiquitinated histone H2A deubiquitination(GO:0035522) |
| 0.0 | 0.1 | GO:0052805 | histidine catabolic process(GO:0006548) imidazole-containing compound catabolic process(GO:0052805) |
| 0.0 | 0.0 | GO:0042753 | positive regulation of circadian rhythm(GO:0042753) |
| 0.0 | 0.1 | GO:0044208 | 'de novo' AMP biosynthetic process(GO:0044208) |
| 0.0 | 0.2 | GO:1905049 | negative regulation of metallopeptidase activity(GO:1905049) |
| 0.0 | 0.0 | GO:0033341 | regulation of collagen binding(GO:0033341) |
| 0.0 | 0.2 | GO:0032237 | activation of store-operated calcium channel activity(GO:0032237) positive regulation of store-operated calcium channel activity(GO:1901341) |
| 0.0 | 0.2 | GO:0032020 | ISG15-protein conjugation(GO:0032020) |
| 0.0 | 0.3 | GO:0006910 | phagocytosis, recognition(GO:0006910) |
| 0.0 | 0.1 | GO:0007616 | long-term memory(GO:0007616) |
| 0.0 | 0.0 | GO:0030240 | skeletal muscle thin filament assembly(GO:0030240) |
| 0.0 | 0.0 | GO:0031990 | mRNA export from nucleus in response to heat stress(GO:0031990) |
| 0.0 | 0.3 | GO:0010623 | programmed cell death involved in cell development(GO:0010623) |
| 0.0 | 0.1 | GO:0042078 | germ-line stem cell division(GO:0042078) male germ-line stem cell asymmetric division(GO:0048133) germline stem cell asymmetric division(GO:0098728) |
| 0.0 | 0.0 | GO:0051919 | positive regulation of fibrinolysis(GO:0051919) |
| 0.0 | 0.1 | GO:0097327 | response to antineoplastic agent(GO:0097327) |
| 0.0 | 0.0 | GO:0032289 | central nervous system myelin formation(GO:0032289) |
| 0.0 | 0.1 | GO:0060157 | female genitalia morphogenesis(GO:0048807) urinary bladder development(GO:0060157) |
| 0.0 | 0.0 | GO:0008057 | eye pigment granule organization(GO:0008057) |
| 0.0 | 0.1 | GO:0000103 | sulfate assimilation(GO:0000103) |
| 0.0 | 0.0 | GO:1904693 | midbrain morphogenesis(GO:1904693) |
| 0.0 | 0.0 | GO:0038060 | nitric oxide-cGMP-mediated signaling pathway(GO:0038060) |
| 0.0 | 0.0 | GO:0042938 | dipeptide transport(GO:0042938) |
| 0.0 | 0.1 | GO:0090206 | negative regulation of cholesterol biosynthetic process(GO:0045541) negative regulation of cholesterol metabolic process(GO:0090206) |
| 0.0 | 0.1 | GO:0034421 | post-translational protein acetylation(GO:0034421) |
| 0.0 | 0.1 | GO:0070124 | mitochondrial translational initiation(GO:0070124) |
| 0.0 | 0.1 | GO:0032815 | negative regulation of natural killer cell activation(GO:0032815) |
| 0.0 | 0.1 | GO:0006857 | oligopeptide transport(GO:0006857) |
| 0.0 | 0.1 | GO:0035306 | positive regulation of dephosphorylation(GO:0035306) positive regulation of protein dephosphorylation(GO:0035307) |
| 0.0 | 0.1 | GO:0035927 | RNA import into mitochondrion(GO:0035927) |
| 0.0 | 0.0 | GO:0072616 | interleukin-18 secretion(GO:0072616) |
| 0.0 | 0.0 | GO:0006272 | leading strand elongation(GO:0006272) |
| 0.0 | 0.2 | GO:0015074 | DNA integration(GO:0015074) |
| 0.0 | 0.0 | GO:1903555 | tumor necrosis factor production(GO:0032640) regulation of tumor necrosis factor superfamily cytokine production(GO:1903555) |
| 0.0 | 0.1 | GO:1904209 | regulation of chemokine (C-C motif) ligand 2 secretion(GO:1904207) positive regulation of chemokine (C-C motif) ligand 2 secretion(GO:1904209) |
| 0.0 | 0.0 | GO:0006679 | glucosylceramide biosynthetic process(GO:0006679) |
| 0.0 | 0.1 | GO:0072218 | ascending thin limb development(GO:0072021) metanephric ascending thin limb development(GO:0072218) |
| 0.0 | 0.1 | GO:0097112 | gamma-aminobutyric acid receptor clustering(GO:0097112) |
| 0.0 | 0.0 | GO:0033385 | geranylgeranyl diphosphate metabolic process(GO:0033385) geranylgeranyl diphosphate biosynthetic process(GO:0033386) |
| 0.0 | 0.0 | GO:0001504 | neurotransmitter uptake(GO:0001504) |
| 0.0 | 0.1 | GO:2000252 | negative regulation of feeding behavior(GO:2000252) |
| 0.0 | 0.1 | GO:0051066 | dihydrobiopterin metabolic process(GO:0051066) |
| 0.0 | 0.2 | GO:0010529 | regulation of transposition(GO:0010528) negative regulation of transposition(GO:0010529) |
| 0.0 | 0.0 | GO:1903660 | negative regulation of complement-dependent cytotoxicity(GO:1903660) |
| 0.0 | 0.1 | GO:0034370 | triglyceride-rich lipoprotein particle remodeling(GO:0034370) very-low-density lipoprotein particle remodeling(GO:0034372) |
| 0.0 | 0.0 | GO:1903461 | Okazaki fragment processing involved in mitotic DNA replication(GO:1903461) |
| 0.0 | 0.2 | GO:0006451 | selenocysteine incorporation(GO:0001514) translational readthrough(GO:0006451) |
| 0.0 | 0.0 | GO:0060455 | negative regulation of gastric acid secretion(GO:0060455) |
| 0.0 | 0.0 | GO:0021942 | radial glia guided migration of Purkinje cell(GO:0021942) |
| 0.0 | 0.3 | GO:0050849 | negative regulation of calcium-mediated signaling(GO:0050849) |
| 0.0 | 0.3 | GO:0031954 | positive regulation of protein autophosphorylation(GO:0031954) |
| 0.0 | 0.2 | GO:0000389 | mRNA 3'-splice site recognition(GO:0000389) |
| 0.0 | 0.1 | GO:0031666 | positive regulation of lipopolysaccharide-mediated signaling pathway(GO:0031666) |
| 0.0 | 0.1 | GO:0031133 | regulation of axon diameter(GO:0031133) |
| 0.0 | 0.0 | GO:2000097 | regulation of smooth muscle cell-matrix adhesion(GO:2000097) |
| 0.0 | 0.3 | GO:0051014 | actin filament severing(GO:0051014) |
| 0.0 | 0.2 | GO:0048853 | forebrain morphogenesis(GO:0048853) |
| 0.0 | 0.0 | GO:0021898 | regulation of transcription from RNA polymerase II promoter involved in forebrain neuron fate commitment(GO:0021882) cerebral cortex GABAergic interneuron fate commitment(GO:0021893) commitment of multipotent stem cells to neuronal lineage in forebrain(GO:0021898) positive regulation of neural retina development(GO:0061075) positive regulation of retina development in camera-type eye(GO:1902868) regulation of amacrine cell differentiation(GO:1902869) positive regulation of amacrine cell differentiation(GO:1902871) |
| 0.0 | 0.1 | GO:0006121 | mitochondrial electron transport, succinate to ubiquinone(GO:0006121) |
| 0.0 | 0.0 | GO:1905053 | regulation of base-excision repair(GO:1905051) positive regulation of base-excision repair(GO:1905053) |
| 0.0 | 0.0 | GO:0038001 | paracrine signaling(GO:0038001) |
| 0.0 | 0.0 | GO:0045743 | positive regulation of fibroblast growth factor receptor signaling pathway(GO:0045743) |
| 0.0 | 0.1 | GO:0061042 | vascular wound healing(GO:0061042) |
| 0.0 | 0.0 | GO:0043012 | regulation of fusion of sperm to egg plasma membrane(GO:0043012) |
| 0.0 | 0.0 | GO:0032242 | regulation of nucleoside transport(GO:0032242) |
| 0.0 | 0.3 | GO:0006123 | mitochondrial electron transport, cytochrome c to oxygen(GO:0006123) |
| 0.0 | 0.0 | GO:0035284 | central nervous system segmentation(GO:0035283) brain segmentation(GO:0035284) |
| 0.0 | 0.1 | GO:0032439 | endosome localization(GO:0032439) |
| 0.0 | 0.0 | GO:0042245 | RNA repair(GO:0042245) |
| 0.0 | 0.1 | GO:0097475 | motor neuron migration(GO:0097475) |
| 0.0 | 0.0 | GO:0046959 | nonassociative learning(GO:0046958) habituation(GO:0046959) |
| 0.0 | 0.1 | GO:0043932 | ossification involved in bone remodeling(GO:0043932) |
| 0.0 | 0.1 | GO:0060298 | positive regulation of sarcomere organization(GO:0060298) |
| 0.0 | 0.1 | GO:0036228 | protein targeting to nuclear inner membrane(GO:0036228) |
| 0.0 | 0.1 | GO:0045188 | regulation of circadian sleep/wake cycle, non-REM sleep(GO:0045188) |
| 0.0 | 0.0 | GO:2001287 | negative regulation of caveolin-mediated endocytosis(GO:2001287) |
| 0.0 | 0.0 | GO:0032679 | TRAIL production(GO:0032639) regulation of TRAIL production(GO:0032679) positive regulation of TRAIL production(GO:0032759) |
| 0.0 | 0.2 | GO:0070389 | chaperone cofactor-dependent protein refolding(GO:0070389) |
| 0.0 | 0.1 | GO:0071872 | cellular response to epinephrine stimulus(GO:0071872) |
| 0.0 | 0.1 | GO:1990504 | dense core granule exocytosis(GO:1990504) |
| 0.0 | 0.0 | GO:0018201 | N-terminal protein amino acid methylation(GO:0006480) N-terminal peptidyl-alanine methylation(GO:0018011) N-terminal peptidyl-alanine trimethylation(GO:0018012) N-terminal peptidyl-glycine methylation(GO:0018013) N-terminal peptidyl-proline dimethylation(GO:0018016) peptidyl-alanine modification(GO:0018194) peptidyl-glycine modification(GO:0018201) N-terminal peptidyl-proline methylation(GO:0035568) N-terminal peptidyl-serine methylation(GO:0035570) N-terminal peptidyl-serine dimethylation(GO:0035572) N-terminal peptidyl-serine trimethylation(GO:0035573) |
| 0.0 | 0.1 | GO:0036500 | ATF6-mediated unfolded protein response(GO:0036500) |
| 0.0 | 0.0 | GO:1903568 | negative regulation of protein localization to cilium(GO:1903565) regulation of protein localization to ciliary membrane(GO:1903567) negative regulation of protein localization to ciliary membrane(GO:1903568) |
| 0.0 | 0.1 | GO:0036378 | calcitriol biosynthetic process from calciol(GO:0036378) |
| 0.0 | 0.1 | GO:1900084 | regulation of peptidyl-tyrosine autophosphorylation(GO:1900084) positive regulation of peptidyl-tyrosine autophosphorylation(GO:1900086) |
| 0.0 | 0.0 | GO:0060708 | spongiotrophoblast differentiation(GO:0060708) |
| 0.0 | 0.1 | GO:0070266 | necroptotic process(GO:0070266) |
| 0.0 | 0.2 | GO:0043313 | regulation of neutrophil degranulation(GO:0043313) |
| 0.0 | 0.1 | GO:0001555 | oocyte growth(GO:0001555) |
| 0.0 | 0.1 | GO:0035983 | response to trichostatin A(GO:0035983) cellular response to trichostatin A(GO:0035984) |
| 0.0 | 0.0 | GO:2000364 | regulation of STAT protein import into nucleus(GO:2000364) positive regulation of STAT protein import into nucleus(GO:2000366) |
| 0.0 | 0.1 | GO:0007288 | sperm axoneme assembly(GO:0007288) |
| 0.0 | 0.1 | GO:0021759 | globus pallidus development(GO:0021759) |
| 0.0 | 0.0 | GO:0090237 | regulation of arachidonic acid secretion(GO:0090237) |
| 0.0 | 0.1 | GO:0071910 | determination of pancreatic left/right asymmetry(GO:0035469) determination of liver left/right asymmetry(GO:0071910) |
| 0.0 | 0.1 | GO:0000075 | cell cycle checkpoint(GO:0000075) |
| 0.0 | 0.2 | GO:0001675 | acrosome assembly(GO:0001675) |
| 0.0 | 0.0 | GO:0046294 | formaldehyde catabolic process(GO:0046294) |
| 0.0 | 0.1 | GO:0045349 | negative regulation of interferon-alpha production(GO:0032687) interferon-alpha biosynthetic process(GO:0045349) regulation of interferon-alpha biosynthetic process(GO:0045354) |
| 0.0 | 0.1 | GO:0035803 | egg coat formation(GO:0035803) |
| 0.0 | 0.1 | GO:0008588 | release of cytoplasmic sequestered NF-kappaB(GO:0008588) |
| 0.0 | 0.0 | GO:0045200 | establishment or maintenance of neuroblast polarity(GO:0045196) establishment of neuroblast polarity(GO:0045200) |
| 0.0 | 0.1 | GO:0035860 | glial cell-derived neurotrophic factor receptor signaling pathway(GO:0035860) |
| 0.0 | 0.0 | GO:0034356 | NAD biosynthesis via nicotinamide riboside salvage pathway(GO:0034356) |
| 0.0 | 0.1 | GO:1904491 | protein localization to ciliary transition zone(GO:1904491) |
| 0.0 | 0.0 | GO:0010961 | cellular magnesium ion homeostasis(GO:0010961) |
| 0.0 | 0.1 | GO:0000463 | maturation of LSU-rRNA from tricistronic rRNA transcript (SSU-rRNA, 5.8S rRNA, LSU-rRNA)(GO:0000463) |
| 0.0 | 0.1 | GO:0042136 | neurotransmitter biosynthetic process(GO:0042136) |
| 0.0 | 0.0 | GO:0045187 | regulation of circadian sleep/wake cycle(GO:0042749) regulation of circadian sleep/wake cycle, sleep(GO:0045187) |
| 0.0 | 0.0 | GO:0016094 | polyprenol biosynthetic process(GO:0016094) |
| 0.0 | 0.1 | GO:0072262 | metanephric glomerular mesangial cell proliferation involved in metanephros development(GO:0072262) regulation of metanephric glomerular mesangial cell proliferation(GO:0072301) |
| 0.0 | 0.1 | GO:2000811 | negative regulation of anoikis(GO:2000811) |
| 0.0 | 0.1 | GO:0007296 | vitellogenesis(GO:0007296) |
| 0.0 | 0.1 | GO:0042276 | error-prone translesion synthesis(GO:0042276) |
| 0.0 | 0.0 | GO:0010360 | negative regulation of anion channel activity(GO:0010360) negative regulation of chloride transport(GO:2001226) |
| 0.0 | 0.0 | GO:0042670 | retinal cone cell differentiation(GO:0042670) retinal cone cell development(GO:0046549) |
| 0.0 | 0.0 | GO:0060405 | regulation of penile erection(GO:0060405) |
| 0.0 | 0.1 | GO:1903431 | positive regulation of neuron maturation(GO:0014042) positive regulation of cell maturation(GO:1903431) |
| 0.0 | 0.0 | GO:0090260 | filtration diaphragm assembly(GO:0036058) slit diaphragm assembly(GO:0036060) negative regulation of retinal ganglion cell axon guidance(GO:0090260) |
| 0.0 | 0.0 | GO:0097398 | response to interleukin-17(GO:0097396) cellular response to interleukin-17(GO:0097398) |
| 0.0 | 0.2 | GO:0018202 | peptidyl-histidine modification(GO:0018202) |
| 0.0 | 0.0 | GO:0051131 | chaperone-mediated protein complex assembly(GO:0051131) |
| 0.0 | 0.0 | GO:0072061 | inner medullary collecting duct development(GO:0072061) |
| 0.0 | 0.2 | GO:0071578 | zinc II ion transmembrane import(GO:0071578) |
| 0.0 | 0.0 | GO:1990834 | response to odorant(GO:1990834) |
| 0.0 | 0.1 | GO:0017196 | N-terminal peptidyl-methionine acetylation(GO:0017196) |
| 0.0 | 0.0 | GO:2000823 | regulation of androgen receptor activity(GO:2000823) |
| 0.0 | 0.0 | GO:0009698 | phenylpropanoid metabolic process(GO:0009698) coumarin metabolic process(GO:0009804) |
| 0.0 | 0.1 | GO:0048478 | replication fork protection(GO:0048478) |
| 0.0 | 0.1 | GO:0071447 | cellular response to hydroperoxide(GO:0071447) |
| 0.0 | 0.2 | GO:0007172 | signal complex assembly(GO:0007172) |
| 0.0 | 0.1 | GO:1905167 | positive regulation of lysosomal protein catabolic process(GO:1905167) |
| 0.0 | 0.0 | GO:0007023 | post-chaperonin tubulin folding pathway(GO:0007023) |
| 0.0 | 0.0 | GO:0001543 | ovarian follicle rupture(GO:0001543) |
| 0.0 | 0.1 | GO:0071313 | cellular response to caffeine(GO:0071313) |
| 0.0 | 0.0 | GO:0090308 | regulation of methylation-dependent chromatin silencing(GO:0090308) |
| 0.0 | 0.1 | GO:0019236 | response to pheromone(GO:0019236) |
| 0.0 | 0.1 | GO:0035583 | sequestering of TGFbeta in extracellular matrix(GO:0035583) |
| 0.0 | 0.1 | GO:0097500 | receptor localization to nonmotile primary cilium(GO:0097500) |
| 0.0 | 0.0 | GO:0014028 | notochord formation(GO:0014028) |
| 0.0 | 0.1 | GO:0050689 | negative regulation of defense response to virus by host(GO:0050689) |
| 0.0 | 0.1 | GO:0019348 | dolichol metabolic process(GO:0019348) |
| 0.0 | 0.1 | GO:0046085 | adenosine metabolic process(GO:0046085) |
| 0.0 | 0.1 | GO:0048630 | skeletal muscle tissue growth(GO:0048630) |
| 0.0 | 0.2 | GO:0032516 | positive regulation of phosphoprotein phosphatase activity(GO:0032516) |
| 0.0 | 0.3 | GO:0003351 | epithelial cilium movement(GO:0003351) |
| 0.0 | 0.0 | GO:0071469 | cellular response to alkaline pH(GO:0071469) |
| 0.0 | 0.1 | GO:0060632 | regulation of microtubule-based movement(GO:0060632) |
| 0.0 | 0.0 | GO:0090598 | male genitalia morphogenesis(GO:0048808) male anatomical structure morphogenesis(GO:0090598) |
| 0.0 | 0.1 | GO:0006668 | sphinganine-1-phosphate metabolic process(GO:0006668) |
| 0.0 | 0.1 | GO:0046325 | negative regulation of glucose import(GO:0046325) |
| 0.0 | 0.0 | GO:0002778 | antimicrobial peptide production(GO:0002775) antibacterial peptide production(GO:0002778) |
| 0.0 | 0.2 | GO:0042026 | protein refolding(GO:0042026) |
| 0.0 | 0.1 | GO:0019075 | virus maturation(GO:0019075) |
| 0.0 | 0.1 | GO:0060215 | primitive hemopoiesis(GO:0060215) |
| 0.0 | 0.0 | GO:2000819 | regulation of nucleotide-excision repair(GO:2000819) |
| 0.0 | 0.2 | GO:0006449 | regulation of translational termination(GO:0006449) |
| 0.0 | 0.0 | GO:1901350 | cell-cell signaling involved in cell-cell junction organization(GO:1901350) |
| 0.0 | 0.1 | GO:0001672 | regulation of chromatin assembly or disassembly(GO:0001672) |
| 0.0 | 0.0 | GO:1990022 | RNA polymerase II complex import to nucleus(GO:0044376) RNA polymerase III complex localization to nucleus(GO:1990022) |
| 0.0 | 0.1 | GO:0006685 | sphingomyelin catabolic process(GO:0006685) |
| 0.0 | 0.1 | GO:1900165 | negative regulation of interleukin-6 secretion(GO:1900165) |
| 0.0 | 0.1 | GO:0030575 | nuclear body organization(GO:0030575) |
| 0.0 | 0.2 | GO:0019430 | removal of superoxide radicals(GO:0019430) |
| 0.0 | 0.1 | GO:0016188 | synaptic vesicle maturation(GO:0016188) |
| 0.0 | 0.0 | GO:0042481 | regulation of odontogenesis(GO:0042481) |
| 0.0 | 0.0 | GO:0035262 | gonad morphogenesis(GO:0035262) |
| 0.0 | 0.0 | GO:0042415 | norepinephrine metabolic process(GO:0042415) |
| 0.0 | 0.1 | GO:0006432 | phenylalanyl-tRNA aminoacylation(GO:0006432) |
| 0.0 | 0.1 | GO:1902626 | assembly of large subunit precursor of preribosome(GO:1902626) |
| 0.0 | 0.2 | GO:0043046 | DNA methylation involved in gamete generation(GO:0043046) |
| 0.0 | 0.1 | GO:2001106 | regulation of Rho guanyl-nucleotide exchange factor activity(GO:2001106) |
| 0.0 | 0.2 | GO:0015816 | glycine transport(GO:0015816) |
| 0.0 | 0.0 | GO:0046271 | phenylpropanoid catabolic process(GO:0046271) |
| 0.0 | 0.0 | GO:0010918 | positive regulation of mitochondrial membrane potential(GO:0010918) |
| 0.0 | 0.1 | GO:0006490 | dolichol-linked oligosaccharide biosynthetic process(GO:0006488) oligosaccharide-lipid intermediate biosynthetic process(GO:0006490) |
| 0.0 | 0.0 | GO:0010766 | negative regulation of sodium ion transport(GO:0010766) |
| 0.0 | 0.0 | GO:0010757 | negative regulation of plasminogen activation(GO:0010757) |
| 0.0 | 0.2 | GO:0048739 | cardiac muscle fiber development(GO:0048739) |
| 0.0 | 0.1 | GO:0021853 | cerebral cortex GABAergic interneuron migration(GO:0021853) interneuron migration(GO:1904936) |
| 0.0 | 0.1 | GO:0090070 | positive regulation of ribosome biogenesis(GO:0090070) positive regulation of rRNA processing(GO:2000234) |
| 0.0 | 0.1 | GO:0060440 | trachea formation(GO:0060440) |
| 0.0 | 0.0 | GO:0006579 | amino-acid betaine catabolic process(GO:0006579) |
| 0.0 | 0.0 | GO:0042090 | interleukin-12 biosynthetic process(GO:0042090) regulation of interleukin-12 biosynthetic process(GO:0045075) |
| 0.0 | 0.1 | GO:0098735 | positive regulation of the force of heart contraction(GO:0098735) |
| 0.0 | 0.0 | GO:0044339 | canonical Wnt signaling pathway involved in osteoblast differentiation(GO:0044339) |
| 0.0 | 0.0 | GO:1900042 | positive regulation of interleukin-2 secretion(GO:1900042) |
| 0.0 | 0.0 | GO:1902303 | regulation of heart rate by hormone(GO:0003064) negative regulation of potassium ion export(GO:1902303) |
| 0.0 | 0.0 | GO:1903778 | protein localization to vacuolar membrane(GO:1903778) |
| 0.0 | 0.1 | GO:0019626 | short-chain fatty acid catabolic process(GO:0019626) |
| 0.0 | 0.1 | GO:0006384 | transcription initiation from RNA polymerase III promoter(GO:0006384) |
| 0.0 | 0.0 | GO:0007468 | regulation of rhodopsin gene expression(GO:0007468) |
| 0.0 | 0.2 | GO:0050962 | detection of light stimulus involved in visual perception(GO:0050908) detection of light stimulus involved in sensory perception(GO:0050962) |
| 0.0 | 0.1 | GO:0070417 | cellular response to cold(GO:0070417) |
| 0.0 | 0.2 | GO:0060746 | maternal behavior(GO:0042711) parental behavior(GO:0060746) |
| 0.0 | 0.0 | GO:0042144 | vacuole fusion, non-autophagic(GO:0042144) |
| 0.0 | 0.0 | GO:0046102 | inosine metabolic process(GO:0046102) |
| 0.0 | 0.0 | GO:2000646 | positive regulation of receptor catabolic process(GO:2000646) |
| 0.0 | 0.2 | GO:1903069 | regulation of ER-associated ubiquitin-dependent protein catabolic process(GO:1903069) positive regulation of ER-associated ubiquitin-dependent protein catabolic process(GO:1903071) |
| 0.0 | 0.1 | GO:0090336 | positive regulation of brown fat cell differentiation(GO:0090336) |
| 0.0 | 0.0 | GO:1990167 | protein K27-linked deubiquitination(GO:1990167) protein K33-linked deubiquitination(GO:1990168) |
| 0.0 | 0.2 | GO:0035721 | intraciliary retrograde transport(GO:0035721) |
| 0.0 | 0.2 | GO:1903830 | magnesium ion transmembrane transport(GO:1903830) |
| 0.0 | 0.1 | GO:0031284 | positive regulation of guanylate cyclase activity(GO:0031284) |
| 0.0 | 0.4 | GO:0006607 | NLS-bearing protein import into nucleus(GO:0006607) |
| 0.0 | 0.0 | GO:0032627 | interleukin-23 production(GO:0032627) regulation of interleukin-23 production(GO:0032667) |
| 0.0 | 0.1 | GO:0043686 | co-translational protein modification(GO:0043686) |
| 0.0 | 0.1 | GO:0006348 | chromatin silencing at telomere(GO:0006348) |
| 0.0 | 0.1 | GO:0038129 | ERBB3 signaling pathway(GO:0038129) |
| 0.0 | 0.1 | GO:1902455 | negative regulation of stem cell population maintenance(GO:1902455) |
| 0.0 | 0.1 | GO:0018231 | peptidyl-L-cysteine S-palmitoylation(GO:0018230) peptidyl-S-diacylglycerol-L-cysteine biosynthetic process from peptidyl-cysteine(GO:0018231) |
| 0.0 | 0.2 | GO:0070831 | basement membrane assembly(GO:0070831) |
| 0.0 | 0.3 | GO:0006744 | ubiquinone biosynthetic process(GO:0006744) quinone biosynthetic process(GO:1901663) |
| 0.0 | 0.0 | GO:0010039 | response to iron ion(GO:0010039) |
| 0.0 | 0.1 | GO:0009629 | response to gravity(GO:0009629) |
| 0.0 | 0.1 | GO:0034626 | fatty acid elongation, saturated fatty acid(GO:0019367) fatty acid elongation, unsaturated fatty acid(GO:0019368) fatty acid elongation, monounsaturated fatty acid(GO:0034625) fatty acid elongation, polyunsaturated fatty acid(GO:0034626) |
| 0.0 | 0.1 | GO:1901029 | negative regulation of mitochondrial outer membrane permeabilization involved in apoptotic signaling pathway(GO:1901029) |
| 0.0 | 0.1 | GO:0031577 | spindle checkpoint(GO:0031577) |
| 0.0 | 0.0 | GO:0051581 | negative regulation of neurotransmitter uptake(GO:0051581) serotonin uptake(GO:0051610) regulation of serotonin uptake(GO:0051611) negative regulation of serotonin uptake(GO:0051612) |
| 0.0 | 0.1 | GO:1990416 | cellular response to brain-derived neurotrophic factor stimulus(GO:1990416) |
| 0.0 | 0.1 | GO:0060087 | relaxation of vascular smooth muscle(GO:0060087) |
| 0.0 | 0.1 | GO:0050930 | induction of positive chemotaxis(GO:0050930) |
| 0.0 | 0.1 | GO:0048280 | vesicle fusion with Golgi apparatus(GO:0048280) |
| 0.0 | 0.0 | GO:0002765 | immune response-inhibiting signal transduction(GO:0002765) |
| 0.0 | 0.1 | GO:0050965 | detection of temperature stimulus involved in sensory perception(GO:0050961) detection of temperature stimulus involved in sensory perception of pain(GO:0050965) |
| 0.0 | 0.1 | GO:0035520 | monoubiquitinated protein deubiquitination(GO:0035520) |
| 0.0 | 0.1 | GO:0018242 | protein O-linked glycosylation via serine(GO:0018242) |
| 0.0 | 0.1 | GO:0018364 | peptidyl-glutamine methylation(GO:0018364) |
| 0.0 | 0.1 | GO:0010739 | positive regulation of protein kinase A signaling(GO:0010739) |
| 0.0 | 0.0 | GO:0072156 | distal tubule morphogenesis(GO:0072156) |
| 0.0 | 0.1 | GO:0043328 | protein targeting to vacuole involved in ubiquitin-dependent protein catabolic process via the multivesicular body sorting pathway(GO:0043328) |
| 0.0 | 0.1 | GO:0019919 | peptidyl-arginine methylation, to asymmetrical-dimethyl arginine(GO:0019919) |
| 0.0 | 0.1 | GO:0001561 | fatty acid alpha-oxidation(GO:0001561) |
| 0.0 | 0.1 | GO:0070212 | protein poly-ADP-ribosylation(GO:0070212) |
| 0.0 | 0.1 | GO:0032484 | Ral protein signal transduction(GO:0032484) regulation of Ral protein signal transduction(GO:0032485) |
| 0.0 | 0.0 | GO:2000609 | regulation of thyroid hormone generation(GO:2000609) |
| 0.0 | 0.0 | GO:0014016 | neuroblast differentiation(GO:0014016) |
Gene overrepresentation in cellular_component category:
| Log-likelihood per target | Total log-likelihood | Term | Description |
|---|---|---|---|
| 0.1 | 0.3 | GO:0034363 | intermediate-density lipoprotein particle(GO:0034363) |
| 0.1 | 0.4 | GO:0070044 | synaptobrevin 2-SNAP-25-syntaxin-1a complex(GO:0070044) |
| 0.1 | 0.3 | GO:0034676 | integrin alpha6-beta4 complex(GO:0034676) |
| 0.1 | 0.2 | GO:0001534 | radial spoke(GO:0001534) |
| 0.1 | 0.2 | GO:0005960 | glycine cleavage complex(GO:0005960) |
| 0.1 | 0.2 | GO:1902912 | pyruvate kinase complex(GO:1902912) |
| 0.1 | 0.5 | GO:0060200 | clathrin-sculpted acetylcholine transport vesicle(GO:0060200) clathrin-sculpted acetylcholine transport vesicle membrane(GO:0060201) |
| 0.1 | 0.8 | GO:0045179 | apical cortex(GO:0045179) |
| 0.0 | 0.4 | GO:0034688 | integrin alphaM-beta2 complex(GO:0034688) |
| 0.0 | 0.0 | GO:0044279 | other organism cell membrane(GO:0044218) other organism membrane(GO:0044279) |
| 0.0 | 0.1 | GO:0000229 | cytoplasmic chromosome(GO:0000229) |
| 0.0 | 0.1 | GO:0017119 | Golgi transport complex(GO:0017119) |
| 0.0 | 0.0 | GO:0033648 | host intracellular part(GO:0033646) host intracellular organelle(GO:0033647) host intracellular membrane-bounded organelle(GO:0033648) host cell nucleus(GO:0042025) intracellular region of host(GO:0043656) |
| 0.0 | 0.1 | GO:0042565 | RNA nuclear export complex(GO:0042565) |
| 0.0 | 0.2 | GO:0031510 | SUMO activating enzyme complex(GO:0031510) |
| 0.0 | 0.1 | GO:1990015 | mesaxon(GO:0097453) ensheathing process(GO:1990015) |
| 0.0 | 0.2 | GO:0042571 | immunoglobulin complex, circulating(GO:0042571) |
| 0.0 | 0.3 | GO:0005956 | protein kinase CK2 complex(GO:0005956) |
| 0.0 | 0.2 | GO:1990796 | photoreceptor cell terminal bouton(GO:1990796) |
| 0.0 | 0.2 | GO:0035838 | growing cell tip(GO:0035838) |
| 0.0 | 0.3 | GO:0033565 | ESCRT-0 complex(GO:0033565) |
| 0.0 | 0.1 | GO:1990622 | CHOP-ATF3 complex(GO:1990622) |
| 0.0 | 0.1 | GO:0031074 | nucleocytoplasmic shuttling complex(GO:0031074) |
| 0.0 | 0.1 | GO:0070993 | translation preinitiation complex(GO:0070993) |
| 0.0 | 0.2 | GO:0005826 | actomyosin contractile ring(GO:0005826) |
| 0.0 | 0.2 | GO:0097149 | centralspindlin complex(GO:0097149) |
| 0.0 | 0.5 | GO:0070652 | HAUS complex(GO:0070652) |
| 0.0 | 0.9 | GO:1902711 | GABA-A receptor complex(GO:1902711) |
| 0.0 | 0.1 | GO:0060199 | clathrin-sculpted glutamate transport vesicle(GO:0060199) clathrin-sculpted glutamate transport vesicle membrane(GO:0060203) |
| 0.0 | 0.4 | GO:0071541 | eukaryotic translation initiation factor 3 complex, eIF3m(GO:0071541) |
| 0.0 | 0.1 | GO:0070985 | TFIIK complex(GO:0070985) |
| 0.0 | 0.6 | GO:0000940 | condensed chromosome outer kinetochore(GO:0000940) |
| 0.0 | 0.1 | GO:0001652 | granular component(GO:0001652) |
| 0.0 | 0.1 | GO:0070938 | contractile ring(GO:0070938) |
| 0.0 | 0.2 | GO:0034678 | integrin alpha8-beta1 complex(GO:0034678) |
| 0.0 | 0.2 | GO:0071203 | WASH complex(GO:0071203) |
| 0.0 | 0.1 | GO:0030956 | glutamyl-tRNA(Gln) amidotransferase complex(GO:0030956) |
| 0.0 | 0.0 | GO:0016222 | procollagen-proline 4-dioxygenase complex(GO:0016222) |
| 0.0 | 0.2 | GO:0005658 | alpha DNA polymerase:primase complex(GO:0005658) |
| 0.0 | 0.3 | GO:0001739 | sex chromatin(GO:0001739) |
| 0.0 | 0.2 | GO:0070381 | endosome to plasma membrane transport vesicle(GO:0070381) |
| 0.0 | 0.3 | GO:0033018 | sarcoplasmic reticulum lumen(GO:0033018) |
| 0.0 | 0.1 | GO:0005607 | laminin-2 complex(GO:0005607) |
| 0.0 | 0.5 | GO:0097381 | photoreceptor disc membrane(GO:0097381) |
| 0.0 | 0.1 | GO:0036156 | inner dynein arm(GO:0036156) |
| 0.0 | 0.2 | GO:0035061 | interchromatin granule(GO:0035061) |
| 0.0 | 0.2 | GO:0020018 | ciliary pocket(GO:0020016) ciliary pocket membrane(GO:0020018) |
| 0.0 | 0.1 | GO:1903440 | calcitonin family receptor complex(GO:1903439) amylin receptor complex(GO:1903440) |
| 0.0 | 0.1 | GO:0031372 | UBC13-MMS2 complex(GO:0031372) |
| 0.0 | 0.1 | GO:0016935 | glycine-gated chloride channel complex(GO:0016935) |
| 0.0 | 0.2 | GO:0005958 | DNA-dependent protein kinase-DNA ligase 4 complex(GO:0005958) |
| 0.0 | 0.0 | GO:1990604 | IRE1-TRAF2-ASK1 complex(GO:1990604) |
| 0.0 | 0.1 | GO:1990075 | periciliary membrane compartment(GO:1990075) |
| 0.0 | 0.2 | GO:0035692 | macrophage migration inhibitory factor receptor complex(GO:0035692) |
| 0.0 | 0.1 | GO:0071942 | XPC complex(GO:0071942) |
| 0.0 | 0.1 | GO:0005953 | CAAX-protein geranylgeranyltransferase complex(GO:0005953) |
| 0.0 | 0.1 | GO:0097225 | sperm midpiece(GO:0097225) |
| 0.0 | 0.2 | GO:0099634 | postsynaptic specialization membrane(GO:0099634) |
| 0.0 | 0.1 | GO:0036195 | muscle cell projection(GO:0036194) muscle cell projection membrane(GO:0036195) |
| 0.0 | 0.3 | GO:0097255 | R2TP complex(GO:0097255) |
| 0.0 | 0.0 | GO:0098592 | cytoplasmic side of apical plasma membrane(GO:0098592) |
| 0.0 | 0.1 | GO:0005656 | nuclear pre-replicative complex(GO:0005656) pre-replicative complex(GO:0036387) |
| 0.0 | 0.0 | GO:0042643 | actomyosin, actin portion(GO:0042643) |
| 0.0 | 0.1 | GO:0009331 | glycerol-3-phosphate dehydrogenase complex(GO:0009331) |
| 0.0 | 0.1 | GO:0070032 | synaptobrevin 2-SNAP-25-syntaxin-1a-complexin I complex(GO:0070032) |
| 0.0 | 0.1 | GO:0000444 | MIS12/MIND type complex(GO:0000444) |
| 0.0 | 0.1 | GO:0020005 | symbiont-containing vacuole(GO:0020003) symbiont-containing vacuole membrane(GO:0020005) |
| 0.0 | 0.2 | GO:0032010 | phagolysosome(GO:0032010) |
| 0.0 | 0.1 | GO:0097543 | ciliary inversin compartment(GO:0097543) |
| 0.0 | 0.2 | GO:0070022 | transforming growth factor beta receptor homodimeric complex(GO:0070022) |
| 0.0 | 0.2 | GO:0016272 | prefoldin complex(GO:0016272) |
| 0.0 | 0.2 | GO:0019773 | proteasome core complex, alpha-subunit complex(GO:0019773) |
| 0.0 | 0.1 | GO:0030906 | retromer, cargo-selective complex(GO:0030906) |
| 0.0 | 0.0 | GO:0000811 | GINS complex(GO:0000811) |
| 0.0 | 0.2 | GO:0032389 | MutLalpha complex(GO:0032389) |
| 0.0 | 0.3 | GO:0030870 | Mre11 complex(GO:0030870) |
| 0.0 | 0.3 | GO:0032059 | bleb(GO:0032059) |
| 0.0 | 0.1 | GO:1990037 | Lewy body core(GO:1990037) |
| 0.0 | 0.4 | GO:0071682 | endocytic vesicle lumen(GO:0071682) |
| 0.0 | 0.1 | GO:0008043 | intracellular ferritin complex(GO:0008043) ferritin complex(GO:0070288) |
| 0.0 | 0.2 | GO:0016012 | sarcoglycan complex(GO:0016012) |
| 0.0 | 0.0 | GO:0042827 | platelet dense granule membrane(GO:0031088) platelet dense granule(GO:0042827) |
| 0.0 | 0.1 | GO:0034991 | nuclear meiotic cohesin complex(GO:0034991) |
| 0.0 | 0.2 | GO:0070695 | FHF complex(GO:0070695) |
| 0.0 | 0.1 | GO:0032798 | Swi5-Sfr1 complex(GO:0032798) |
| 0.0 | 0.2 | GO:0045254 | pyruvate dehydrogenase complex(GO:0045254) |
| 0.0 | 0.1 | GO:0016589 | NURF complex(GO:0016589) |
| 0.0 | 0.1 | GO:1990716 | axonemal central apparatus(GO:1990716) |
| 0.0 | 0.3 | GO:0097025 | MPP7-DLG1-LIN7 complex(GO:0097025) |
| 0.0 | 0.2 | GO:0031298 | replication fork protection complex(GO:0031298) |
| 0.0 | 0.1 | GO:0036117 | hyaluranon cable(GO:0036117) |
| 0.0 | 0.1 | GO:0071547 | piP-body(GO:0071547) |
| 0.0 | 0.1 | GO:0097452 | GAIT complex(GO:0097452) |
| 0.0 | 0.1 | GO:0044194 | cytolytic granule(GO:0044194) |
| 0.0 | 0.1 | GO:0097422 | tubular endosome(GO:0097422) |
| 0.0 | 0.2 | GO:0071014 | post-mRNA release spliceosomal complex(GO:0071014) |
| 0.0 | 0.2 | GO:0030688 | preribosome, small subunit precursor(GO:0030688) |
| 0.0 | 0.1 | GO:1990298 | mitotic checkpoint complex(GO:0033597) bub1-bub3 complex(GO:1990298) |
| 0.0 | 0.4 | GO:0005892 | acetylcholine-gated channel complex(GO:0005892) |
| 0.0 | 0.3 | GO:0034663 | endoplasmic reticulum chaperone complex(GO:0034663) |
| 0.0 | 0.0 | GO:1990584 | cardiac Troponin complex(GO:1990584) |
| 0.0 | 0.1 | GO:0030891 | VCB complex(GO:0030891) |
| 0.0 | 0.1 | GO:0000814 | ESCRT II complex(GO:0000814) |
| 0.0 | 0.2 | GO:0005786 | signal recognition particle, endoplasmic reticulum targeting(GO:0005786) |
| 0.0 | 0.1 | GO:0031232 | extrinsic component of external side of plasma membrane(GO:0031232) |
| 0.0 | 0.1 | GO:0072558 | NLRP1 inflammasome complex(GO:0072558) |
| 0.0 | 0.2 | GO:0070187 | telosome(GO:0070187) |
| 0.0 | 0.0 | GO:1902937 | inward rectifier potassium channel complex(GO:1902937) |
| 0.0 | 0.5 | GO:0031092 | platelet alpha granule membrane(GO:0031092) |
| 0.0 | 0.0 | GO:0036457 | keratohyalin granule(GO:0036457) |
| 0.0 | 0.1 | GO:0071020 | post-spliceosomal complex(GO:0071020) |
| 0.0 | 0.2 | GO:0034366 | spherical high-density lipoprotein particle(GO:0034366) |
| 0.0 | 0.1 | GO:0000178 | exosome (RNase complex)(GO:0000178) |
| 0.0 | 0.0 | GO:0008282 | ATP-sensitive potassium channel complex(GO:0008282) |
| 0.0 | 0.1 | GO:0031466 | Cul5-RING ubiquitin ligase complex(GO:0031466) |
| 0.0 | 0.2 | GO:0031313 | extrinsic component of endosome membrane(GO:0031313) |
| 0.0 | 0.1 | GO:0036128 | CatSper complex(GO:0036128) |
| 0.0 | 0.2 | GO:0005655 | nucleolar ribonuclease P complex(GO:0005655) |
| 0.0 | 0.0 | GO:0009330 | DNA topoisomerase complex (ATP-hydrolyzing)(GO:0009330) |
| 0.0 | 0.1 | GO:0016342 | catenin complex(GO:0016342) |
| 0.0 | 0.3 | GO:0097386 | glial cell projection(GO:0097386) |
| 0.0 | 0.1 | GO:0019815 | B cell receptor complex(GO:0019815) |
| 0.0 | 0.2 | GO:0036056 | filtration diaphragm(GO:0036056) slit diaphragm(GO:0036057) |
| 0.0 | 0.1 | GO:0061617 | MICOS complex(GO:0061617) |
| 0.0 | 0.0 | GO:0097418 | neurofibrillary tangle(GO:0097418) |
| 0.0 | 1.2 | GO:0022627 | cytosolic small ribosomal subunit(GO:0022627) |
| 0.0 | 0.5 | GO:0071437 | invadopodium(GO:0071437) |
| 0.0 | 0.5 | GO:0032839 | dendrite cytoplasm(GO:0032839) |
| 0.0 | 0.2 | GO:0032426 | stereocilium tip(GO:0032426) |
| 0.0 | 0.2 | GO:0032039 | integrator complex(GO:0032039) |
| 0.0 | 0.1 | GO:0034751 | aryl hydrocarbon receptor complex(GO:0034751) |
| 0.0 | 0.1 | GO:0036126 | sperm flagellum(GO:0036126) |
| 0.0 | 0.1 | GO:0070852 | cell body fiber(GO:0070852) |
| 0.0 | 0.3 | GO:0005652 | nuclear lamina(GO:0005652) |
| 0.0 | 0.0 | GO:0031523 | Myb complex(GO:0031523) |
| 0.0 | 0.1 | GO:1990578 | perinuclear endoplasmic reticulum membrane(GO:1990578) |
| 0.0 | 0.3 | GO:0001518 | voltage-gated sodium channel complex(GO:0001518) |
| 0.0 | 0.1 | GO:0001405 | presequence translocase-associated import motor(GO:0001405) |
| 0.0 | 0.1 | GO:0005862 | muscle thin filament tropomyosin(GO:0005862) |
| 0.0 | 0.7 | GO:0005834 | heterotrimeric G-protein complex(GO:0005834) |
| 0.0 | 0.0 | GO:0035354 | Toll-like receptor 1-Toll-like receptor 2 protein complex(GO:0035354) |
| 0.0 | 0.1 | GO:0031514 | motile cilium(GO:0031514) |
| 0.0 | 0.3 | GO:0005736 | DNA-directed RNA polymerase I complex(GO:0005736) |
| 0.0 | 0.2 | GO:0000176 | nuclear exosome (RNase complex)(GO:0000176) |
| 0.0 | 0.0 | GO:0045293 | MIS complex(GO:0036396) mRNA editing complex(GO:0045293) |
| 0.0 | 0.1 | GO:0070876 | SOSS complex(GO:0070876) |
| 0.0 | 0.0 | GO:0032937 | SREBP-SCAP-Insig complex(GO:0032937) |
| 0.0 | 0.6 | GO:0031941 | filamentous actin(GO:0031941) |
| 0.0 | 0.3 | GO:0046658 | anchored component of plasma membrane(GO:0046658) |
| 0.0 | 0.0 | GO:0005595 | collagen type XII trimer(GO:0005595) |
| 0.0 | 0.4 | GO:0042629 | mast cell granule(GO:0042629) |
| 0.0 | 0.1 | GO:0097512 | cardiac myofibril(GO:0097512) |
| 0.0 | 0.2 | GO:0005865 | striated muscle thin filament(GO:0005865) myofilament(GO:0036379) |
| 0.0 | 0.0 | GO:0097209 | epidermal lamellar body(GO:0097209) |
| 0.0 | 0.4 | GO:0030673 | axolemma(GO:0030673) |
| 0.0 | 0.1 | GO:0032541 | cortical endoplasmic reticulum(GO:0032541) |
| 0.0 | 0.4 | GO:0070822 | Sin3-type complex(GO:0070822) |
| 0.0 | 0.1 | GO:0035253 | ciliary rootlet(GO:0035253) |
| 0.0 | 0.2 | GO:0032982 | myosin filament(GO:0032982) |
| 0.0 | 0.1 | GO:0031415 | NatA complex(GO:0031415) |
| 0.0 | 0.1 | GO:0030062 | mitochondrial tricarboxylic acid cycle enzyme complex(GO:0030062) |
| 0.0 | 0.3 | GO:0031588 | nucleotide-activated protein kinase complex(GO:0031588) |
| 0.0 | 0.1 | GO:0042612 | MHC class I protein complex(GO:0042612) |
| 0.0 | 0.2 | GO:0008250 | oligosaccharyltransferase complex(GO:0008250) |
| 0.0 | 0.1 | GO:0000439 | core TFIIH complex(GO:0000439) |
| 0.0 | 0.1 | GO:0034706 | sodium channel complex(GO:0034706) |
| 0.0 | 0.2 | GO:0031209 | SCAR complex(GO:0031209) |
| 0.0 | 0.0 | GO:0032783 | ELL-EAF complex(GO:0032783) |
| 0.0 | 0.1 | GO:0008541 | proteasome regulatory particle, lid subcomplex(GO:0008541) |
| 0.0 | 0.2 | GO:0008385 | IkappaB kinase complex(GO:0008385) |
| 0.0 | 0.1 | GO:0030061 | mitochondrial crista(GO:0030061) |
| 0.0 | 0.1 | GO:0005666 | DNA-directed RNA polymerase III complex(GO:0005666) |
| 0.0 | 0.1 | GO:0036021 | endolysosome lumen(GO:0036021) |
| 0.0 | 0.1 | GO:0044233 | ER-mitochondrion membrane contact site(GO:0044233) |
| 0.0 | 0.2 | GO:1990454 | L-type voltage-gated calcium channel complex(GO:1990454) |
Gene overrepresentation in molecular_function category:
| Log-likelihood per target | Total log-likelihood | Term | Description |
|---|---|---|---|
| 0.2 | 0.5 | GO:0004698 | calcium-dependent protein kinase C activity(GO:0004698) |
| 0.1 | 0.4 | GO:0005483 | soluble NSF attachment protein activity(GO:0005483) |
| 0.1 | 0.1 | GO:0030695 | GTPase regulator activity(GO:0030695) |
| 0.1 | 0.1 | GO:0050508 | glucuronosyl-N-acetylglucosaminyl-proteoglycan 4-alpha-N-acetylglucosaminyltransferase activity(GO:0050508) |
| 0.1 | 0.3 | GO:0086062 | voltage-gated sodium channel activity involved in Purkinje myocyte action potential(GO:0086062) |
| 0.1 | 0.5 | GO:0005132 | type I interferon receptor binding(GO:0005132) |
| 0.1 | 0.2 | GO:0047676 | arachidonate-CoA ligase activity(GO:0047676) |
| 0.1 | 0.2 | GO:0070326 | very-low-density lipoprotein particle receptor binding(GO:0070326) |
| 0.1 | 0.5 | GO:0044594 | 3alpha,7alpha,12alpha-trihydroxy-5beta-cholest-24-enoyl-CoA hydratase activity(GO:0033989) 17-beta-hydroxysteroid dehydrogenase (NAD+) activity(GO:0044594) |
| 0.1 | 0.3 | GO:0016880 | glutamate-ammonia ligase activity(GO:0004356) ammonia ligase activity(GO:0016211) acid-ammonia (or amide) ligase activity(GO:0016880) |
| 0.1 | 0.2 | GO:0016165 | linoleate 13S-lipoxygenase activity(GO:0016165) |
| 0.1 | 0.2 | GO:0008398 | sterol 14-demethylase activity(GO:0008398) |
| 0.1 | 0.2 | GO:0051870 | methotrexate binding(GO:0051870) |
| 0.1 | 0.1 | GO:0050431 | transforming growth factor beta binding(GO:0050431) |
| 0.1 | 0.2 | GO:0000224 | peptide-N4-(N-acetyl-beta-glucosaminyl)asparagine amidase activity(GO:0000224) |
| 0.1 | 0.3 | GO:0001855 | complement component C4b binding(GO:0001855) |
| 0.1 | 0.2 | GO:0004960 | thromboxane receptor activity(GO:0004960) thromboxane A2 receptor activity(GO:0004961) |
| 0.1 | 0.2 | GO:0031752 | D5 dopamine receptor binding(GO:0031752) |
| 0.1 | 0.2 | GO:0016603 | glutaminyl-peptide cyclotransferase activity(GO:0016603) |
| 0.1 | 0.2 | GO:0004817 | cysteine-tRNA ligase activity(GO:0004817) |
| 0.1 | 0.2 | GO:0070336 | flap-structured DNA binding(GO:0070336) |
| 0.1 | 0.2 | GO:0003896 | DNA primase activity(GO:0003896) |
| 0.1 | 0.4 | GO:0030348 | syntaxin-3 binding(GO:0030348) |
| 0.1 | 0.2 | GO:0061663 | NEDD8 ligase activity(GO:0061663) |
| 0.1 | 0.2 | GO:0004367 | glycerol-3-phosphate dehydrogenase [NAD+] activity(GO:0004367) |
| 0.1 | 0.1 | GO:0035255 | ionotropic glutamate receptor binding(GO:0035255) |
| 0.1 | 0.3 | GO:0004743 | pyruvate kinase activity(GO:0004743) |
| 0.1 | 0.2 | GO:0004450 | isocitrate dehydrogenase (NADP+) activity(GO:0004450) |
| 0.1 | 0.3 | GO:0035473 | lipase binding(GO:0035473) |
| 0.1 | 0.2 | GO:0031728 | CCR3 chemokine receptor binding(GO:0031728) |
| 0.1 | 0.2 | GO:0033300 | dehydroascorbic acid transporter activity(GO:0033300) |
| 0.1 | 0.2 | GO:0070180 | large ribosomal subunit rRNA binding(GO:0070180) |
| 0.1 | 0.2 | GO:0070320 | inward rectifier potassium channel inhibitor activity(GO:0070320) |
| 0.0 | 0.1 | GO:0004174 | electron-transferring-flavoprotein dehydrogenase activity(GO:0004174) oxidoreductase activity, acting on the CH-NH group of donors, quinone or similar compound as acceptor(GO:0016649) |
| 0.0 | 0.3 | GO:0031730 | CCR5 chemokine receptor binding(GO:0031730) |
| 0.0 | 0.2 | GO:0005011 | macrophage colony-stimulating factor receptor activity(GO:0005011) |
| 0.0 | 0.2 | GO:0030170 | pyridoxal phosphate binding(GO:0030170) |
| 0.0 | 0.4 | GO:0071535 | RING-like zinc finger domain binding(GO:0071535) |
| 0.0 | 0.2 | GO:0042799 | histone methyltransferase activity (H4-K20 specific)(GO:0042799) |
| 0.0 | 0.2 | GO:0032795 | heterotrimeric G-protein binding(GO:0032795) |
| 0.0 | 0.1 | GO:0004566 | beta-glucuronidase activity(GO:0004566) |
| 0.0 | 0.1 | GO:0004739 | pyruvate dehydrogenase (acetyl-transferring) activity(GO:0004739) |
| 0.0 | 0.0 | GO:0071553 | uridine nucleotide receptor activity(GO:0015065) G-protein coupled pyrimidinergic nucleotide receptor activity(GO:0071553) |
| 0.0 | 0.1 | GO:0090631 | pre-miRNA transporter activity(GO:0090631) |
| 0.0 | 0.2 | GO:0004740 | pyruvate dehydrogenase (acetyl-transferring) kinase activity(GO:0004740) |
| 0.0 | 0.2 | GO:0004905 | type I interferon receptor activity(GO:0004905) |
| 0.0 | 0.2 | GO:0000033 | alpha-1,3-mannosyltransferase activity(GO:0000033) |
| 0.0 | 0.2 | GO:0004461 | lactose synthase activity(GO:0004461) |
| 0.0 | 0.2 | GO:0008401 | retinoic acid 4-hydroxylase activity(GO:0008401) |
| 0.0 | 0.1 | GO:0048248 | CXCR3 chemokine receptor binding(GO:0048248) |
| 0.0 | 0.1 | GO:0016495 | C-X3-C chemokine receptor activity(GO:0016495) |
| 0.0 | 0.2 | GO:0004047 | aminomethyltransferase activity(GO:0004047) |
| 0.0 | 0.2 | GO:0032767 | copper-dependent protein binding(GO:0032767) |
| 0.0 | 0.2 | GO:0008260 | 3-oxoacid CoA-transferase activity(GO:0008260) |
| 0.0 | 0.5 | GO:0047134 | protein-disulfide reductase activity(GO:0047134) |
| 0.0 | 0.2 | GO:0097604 | temperature-gated cation channel activity(GO:0097604) |
| 0.0 | 0.3 | GO:0045236 | CXCR chemokine receptor binding(GO:0045236) |
| 0.0 | 0.1 | GO:0008597 | calcium-dependent protein serine/threonine phosphatase regulator activity(GO:0008597) |
| 0.0 | 0.0 | GO:0008177 | succinate dehydrogenase (ubiquinone) activity(GO:0008177) oxidoreductase activity, acting on the CH-CH group of donors, quinone or related compound as acceptor(GO:0016635) |
| 0.0 | 0.1 | GO:0004827 | glutamate-tRNA ligase activity(GO:0004818) proline-tRNA ligase activity(GO:0004827) |
| 0.0 | 0.1 | GO:0031768 | growth hormone-releasing hormone activity(GO:0016608) ghrelin receptor binding(GO:0031768) |
| 0.0 | 0.2 | GO:0000386 | second spliceosomal transesterification activity(GO:0000386) |
| 0.0 | 0.1 | GO:0048244 | phytanoyl-CoA dioxygenase activity(GO:0048244) |
| 0.0 | 0.4 | GO:0001851 | complement component C3b binding(GO:0001851) |
| 0.0 | 0.1 | GO:0050146 | nucleoside phosphotransferase activity(GO:0050146) |
| 0.0 | 0.0 | GO:0016755 | transferase activity, transferring amino-acyl groups(GO:0016755) |
| 0.0 | 0.1 | GO:0032396 | HLA-A specific inhibitory MHC class I receptor activity(GO:0030107) HLA-B specific inhibitory MHC class I receptor activity(GO:0030109) inhibitory MHC class I receptor activity(GO:0032396) |
| 0.0 | 0.1 | GO:0004397 | histidine ammonia-lyase activity(GO:0004397) |
| 0.0 | 0.0 | GO:0031893 | vasopressin receptor binding(GO:0031893) |
| 0.0 | 0.1 | GO:0070513 | death domain binding(GO:0070513) |
| 0.0 | 0.2 | GO:0052840 | endopolyphosphatase activity(GO:0000298) diphosphoinositol-polyphosphate diphosphatase activity(GO:0008486) bis(5'-adenosyl)-hexaphosphatase activity(GO:0034431) bis(5'-adenosyl)-pentaphosphatase activity(GO:0034432) inositol diphosphate tetrakisphosphate diphosphatase activity(GO:0052840) inositol bisdiphosphate tetrakisphosphate diphosphatase activity(GO:0052841) inositol diphosphate pentakisphosphate diphosphatase activity(GO:0052842) inositol-1-diphosphate-2,3,4,5,6-pentakisphosphate diphosphatase activity(GO:0052843) inositol-3-diphosphate-1,2,4,5,6-pentakisphosphate diphosphatase activity(GO:0052844) inositol-5-diphosphate-1,2,3,4,6-pentakisphosphate diphosphatase activity(GO:0052845) inositol-1,5-bisdiphosphate-2,3,4,6-tetrakisphosphate 1-diphosphatase activity(GO:0052846) inositol-1,5-bisdiphosphate-2,3,4,6-tetrakisphosphate 5-diphosphatase activity(GO:0052847) inositol-3,5-bisdiphosphate-2,3,4,6-tetrakisphosphate 5-diphosphatase activity(GO:0052848) |
| 0.0 | 0.1 | GO:0004556 | alpha-amylase activity(GO:0004556) |
| 0.0 | 0.1 | GO:0032184 | SUMO polymer binding(GO:0032184) |
| 0.0 | 0.2 | GO:0035240 | dopamine binding(GO:0035240) |
| 0.0 | 0.1 | GO:0008479 | queuine tRNA-ribosyltransferase activity(GO:0008479) |
| 0.0 | 0.1 | GO:0008184 | glycogen phosphorylase activity(GO:0008184) |
| 0.0 | 0.2 | GO:0044388 | small protein activating enzyme binding(GO:0044388) |
| 0.0 | 0.4 | GO:0046703 | natural killer cell lectin-like receptor binding(GO:0046703) |
| 0.0 | 0.7 | GO:0031957 | very long-chain fatty acid-CoA ligase activity(GO:0031957) |
| 0.0 | 0.2 | GO:0035368 | selenocysteine insertion sequence binding(GO:0035368) |
| 0.0 | 0.5 | GO:0005172 | vascular endothelial growth factor receptor binding(GO:0005172) |
| 0.0 | 0.4 | GO:0051430 | corticotropin-releasing hormone receptor 1 binding(GO:0051430) |
| 0.0 | 0.3 | GO:0016909 | JUN kinase activity(GO:0004705) SAP kinase activity(GO:0016909) |
| 0.0 | 0.1 | GO:0008480 | sarcosine dehydrogenase activity(GO:0008480) |
| 0.0 | 0.2 | GO:0004774 | succinate-CoA ligase activity(GO:0004774) |
| 0.0 | 0.1 | GO:0004958 | prostaglandin F receptor activity(GO:0004958) |
| 0.0 | 0.2 | GO:0008172 | S-methyltransferase activity(GO:0008172) |
| 0.0 | 0.2 | GO:0044729 | hemi-methylated DNA-binding(GO:0044729) |
| 0.0 | 0.1 | GO:0051500 | D-aminoacyl-tRNA deacylase activity(GO:0051499) D-tyrosyl-tRNA(Tyr) deacylase activity(GO:0051500) |
| 0.0 | 0.9 | GO:0004890 | GABA-A receptor activity(GO:0004890) |
| 0.0 | 0.1 | GO:0099609 | microtubule lateral binding(GO:0099609) |
| 0.0 | 0.2 | GO:0038181 | bile acid receptor activity(GO:0038181) |
| 0.0 | 0.3 | GO:0043515 | kinetochore binding(GO:0043515) |
| 0.0 | 0.1 | GO:0005365 | myo-inositol transmembrane transporter activity(GO:0005365) |
| 0.0 | 0.1 | GO:0047844 | deoxycytidine deaminase activity(GO:0047844) |
| 0.0 | 0.2 | GO:0005221 | intracellular cyclic nucleotide activated cation channel activity(GO:0005221) cyclic nucleotide-gated ion channel activity(GO:0043855) |
| 0.0 | 0.1 | GO:0050567 | glutaminyl-tRNA synthase (glutamine-hydrolyzing) activity(GO:0050567) |
| 0.0 | 0.3 | GO:0010859 | calcium-dependent cysteine-type endopeptidase inhibitor activity(GO:0010859) |
| 0.0 | 0.2 | GO:0004614 | phosphoglucomutase activity(GO:0004614) |
| 0.0 | 0.2 | GO:0005047 | signal recognition particle binding(GO:0005047) |
| 0.0 | 0.1 | GO:0047256 | beta-galactosyl-N-acetylglucosaminylgalactosylglucosyl-ceramide beta-1,3-acetylglucosaminyltransferase activity(GO:0008457) lactosylceramide 1,3-N-acetyl-beta-D-glucosaminyltransferase activity(GO:0047256) |
| 0.0 | 0.3 | GO:0004459 | L-lactate dehydrogenase activity(GO:0004459) |
| 0.0 | 0.2 | GO:0004359 | glutaminase activity(GO:0004359) |
| 0.0 | 0.2 | GO:0004694 | eukaryotic translation initiation factor 2alpha kinase activity(GO:0004694) |
| 0.0 | 0.4 | GO:0038132 | neuregulin binding(GO:0038132) |
| 0.0 | 0.2 | GO:0003823 | antigen binding(GO:0003823) |
| 0.0 | 0.6 | GO:0003836 | beta-galactoside (CMP) alpha-2,3-sialyltransferase activity(GO:0003836) |
| 0.0 | 0.1 | GO:0051120 | hepoxilin A3 synthase activity(GO:0051120) |
| 0.0 | 0.1 | GO:0008422 | beta-glucosidase activity(GO:0008422) |
| 0.0 | 0.1 | GO:0004874 | aryl hydrocarbon receptor activity(GO:0004874) |
| 0.0 | 0.1 | GO:0004019 | adenylosuccinate synthase activity(GO:0004019) |
| 0.0 | 0.3 | GO:0070492 | oligosaccharide binding(GO:0070492) |
| 0.0 | 0.1 | GO:0050436 | microfibril binding(GO:0050436) |
| 0.0 | 0.1 | GO:0015130 | mevalonate transmembrane transporter activity(GO:0015130) |
| 0.0 | 0.2 | GO:0016262 | protein N-acetylglucosaminyltransferase activity(GO:0016262) |
| 0.0 | 0.3 | GO:0004000 | adenosine deaminase activity(GO:0004000) |
| 0.0 | 0.1 | GO:0008426 | protein kinase C inhibitor activity(GO:0008426) |
| 0.0 | 0.2 | GO:0030377 | urokinase plasminogen activator receptor activity(GO:0030377) |
| 0.0 | 0.1 | GO:0016230 | sphingomyelin phosphodiesterase activator activity(GO:0016230) |
| 0.0 | 0.1 | GO:0050115 | myosin-light-chain-phosphatase activity(GO:0050115) |
| 0.0 | 0.5 | GO:0008494 | translation activator activity(GO:0008494) |
| 0.0 | 0.2 | GO:0004517 | nitric-oxide synthase activity(GO:0004517) tetrahydrobiopterin binding(GO:0034617) |
| 0.0 | 0.1 | GO:1904315 | neurotransmitter receptor activity involved in regulation of postsynaptic membrane potential(GO:0099529) transmitter-gated ion channel activity involved in regulation of postsynaptic membrane potential(GO:1904315) |
| 0.0 | 0.1 | GO:0030943 | mitochondrion targeting sequence binding(GO:0030943) |
| 0.0 | 0.1 | GO:0097643 | amylin receptor activity(GO:0097643) |
| 0.0 | 0.1 | GO:0046556 | alpha-L-arabinofuranosidase activity(GO:0046556) |
| 0.0 | 0.1 | GO:0010309 | acireductone dioxygenase [iron(II)-requiring] activity(GO:0010309) |
| 0.0 | 0.2 | GO:0004563 | beta-N-acetylhexosaminidase activity(GO:0004563) |
| 0.0 | 0.3 | GO:0097100 | supercoiled DNA binding(GO:0097100) |
| 0.0 | 0.1 | GO:0004829 | threonine-tRNA ligase activity(GO:0004829) |
| 0.0 | 0.2 | GO:0004875 | complement receptor activity(GO:0004875) |
| 0.0 | 0.2 | GO:0015111 | iodide transmembrane transporter activity(GO:0015111) |
| 0.0 | 0.5 | GO:0061578 | Lys63-specific deubiquitinase activity(GO:0061578) |
| 0.0 | 0.2 | GO:0001846 | opsonin binding(GO:0001846) complement component C1q binding(GO:0001849) |
| 0.0 | 0.1 | GO:0005166 | neurotrophin p75 receptor binding(GO:0005166) |
| 0.0 | 0.1 | GO:0004662 | CAAX-protein geranylgeranyltransferase activity(GO:0004662) |
| 0.0 | 0.1 | GO:0017060 | 3-galactosyl-N-acetylglucosaminide 4-alpha-L-fucosyltransferase activity(GO:0017060) |
| 0.0 | 0.1 | GO:0008240 | tripeptidyl-peptidase activity(GO:0008240) |
| 0.0 | 0.1 | GO:0004305 | ethanolamine kinase activity(GO:0004305) |
| 0.0 | 0.2 | GO:0008273 | calcium, potassium:sodium antiporter activity(GO:0008273) |
| 0.0 | 0.1 | GO:0016286 | small conductance calcium-activated potassium channel activity(GO:0016286) |
| 0.0 | 0.1 | GO:0042134 | rRNA primary transcript binding(GO:0042134) |
| 0.0 | 0.1 | GO:0072591 | citrate-L-glutamate ligase activity(GO:0072591) |
| 0.0 | 0.1 | GO:0070052 | collagen V binding(GO:0070052) |
| 0.0 | 0.2 | GO:0003747 | translation release factor activity(GO:0003747) translation termination factor activity(GO:0008079) |
| 0.0 | 0.2 | GO:0042296 | ISG15 transferase activity(GO:0042296) |
| 0.0 | 0.1 | GO:0000213 | tRNA-intron endonuclease activity(GO:0000213) |
| 0.0 | 0.2 | GO:0008131 | primary amine oxidase activity(GO:0008131) |
| 0.0 | 0.1 | GO:0047860 | diiodophenylpyruvate reductase activity(GO:0047860) |
| 0.0 | 0.1 | GO:0015218 | pyrimidine nucleotide transmembrane transporter activity(GO:0015218) |
| 0.0 | 0.2 | GO:0005549 | odorant binding(GO:0005549) |
| 0.0 | 0.3 | GO:0070567 | cytidylyltransferase activity(GO:0070567) |
| 0.0 | 0.3 | GO:0034987 | immunoglobulin receptor binding(GO:0034987) |
| 0.0 | 0.2 | GO:0070404 | NADH binding(GO:0070404) |
| 0.0 | 0.0 | GO:0030371 | translation repressor activity(GO:0030371) |
| 0.0 | 0.2 | GO:0016206 | catechol O-methyltransferase activity(GO:0016206) |
| 0.0 | 0.1 | GO:0043812 | phosphatidylinositol-4-phosphate phosphatase activity(GO:0043812) |
| 0.0 | 0.1 | GO:0046573 | lactonohydrolase activity(GO:0046573) acyl-L-homoserine-lactone lactonohydrolase activity(GO:0102007) |
| 0.0 | 0.2 | GO:0046790 | virion binding(GO:0046790) |
| 0.0 | 0.1 | GO:0031493 | nucleosomal histone binding(GO:0031493) |
| 0.0 | 0.0 | GO:0035662 | Toll-like receptor 4 binding(GO:0035662) |
| 0.0 | 0.1 | GO:0032440 | 2-alkenal reductase [NAD(P)] activity(GO:0032440) |
| 0.0 | 0.1 | GO:0070576 | vitamin D 24-hydroxylase activity(GO:0070576) |
| 0.0 | 0.1 | GO:0004020 | adenylylsulfate kinase activity(GO:0004020) sulfate adenylyltransferase activity(GO:0004779) sulfate adenylyltransferase (ATP) activity(GO:0004781) |
| 0.0 | 0.2 | GO:0048020 | CCR chemokine receptor binding(GO:0048020) |
| 0.0 | 0.1 | GO:0010521 | telomerase inhibitor activity(GO:0010521) |
| 0.0 | 0.2 | GO:0042379 | chemokine receptor binding(GO:0042379) |
| 0.0 | 0.1 | GO:0016964 | alpha-2 macroglobulin receptor activity(GO:0016964) |
| 0.0 | 0.2 | GO:0035800 | deubiquitinase activator activity(GO:0035800) |
| 0.0 | 0.2 | GO:0050145 | nucleoside phosphate kinase activity(GO:0050145) |
| 0.0 | 0.2 | GO:0017150 | tRNA dihydrouridine synthase activity(GO:0017150) |
| 0.0 | 0.4 | GO:0022848 | acetylcholine-gated cation channel activity(GO:0022848) |
| 0.0 | 0.1 | GO:0005105 | type 1 fibroblast growth factor receptor binding(GO:0005105) |
| 0.0 | 0.2 | GO:0048039 | ubiquinone binding(GO:0048039) |
| 0.0 | 0.1 | GO:0015333 | peptide:proton symporter activity(GO:0015333) proton-dependent peptide secondary active transmembrane transporter activity(GO:0022897) |
| 0.0 | 0.1 | GO:0005250 | A-type (transient outward) potassium channel activity(GO:0005250) |
| 0.0 | 0.2 | GO:0043546 | molybdopterin cofactor binding(GO:0043546) |
| 0.0 | 0.2 | GO:0004784 | superoxide dismutase activity(GO:0004784) oxidoreductase activity, acting on superoxide radicals as acceptor(GO:0016721) |
| 0.0 | 0.0 | GO:0016404 | 15-hydroxyprostaglandin dehydrogenase (NAD+) activity(GO:0016404) |
| 0.0 | 0.3 | GO:0000774 | adenyl-nucleotide exchange factor activity(GO:0000774) |
| 0.0 | 0.5 | GO:0030553 | cGMP binding(GO:0030553) |
| 0.0 | 0.0 | GO:0035663 | Toll-like receptor 2 binding(GO:0035663) |
| 0.0 | 0.2 | GO:0008417 | fucosyltransferase activity(GO:0008417) |
| 0.0 | 0.1 | GO:0004719 | protein-L-isoaspartate (D-aspartate) O-methyltransferase activity(GO:0004719) |
| 0.0 | 0.2 | GO:0036042 | long-chain fatty acyl-CoA binding(GO:0036042) |
| 0.0 | 0.1 | GO:0004035 | alkaline phosphatase activity(GO:0004035) |
| 0.0 | 0.1 | GO:0071074 | eukaryotic initiation factor eIF2 binding(GO:0071074) |
| 0.0 | 0.1 | GO:0015056 | corticotrophin-releasing factor receptor activity(GO:0015056) |
| 0.0 | 0.1 | GO:0099580 | ion antiporter activity involved in regulation of postsynaptic membrane potential(GO:0099580) |
| 0.0 | 0.2 | GO:0001730 | 2'-5'-oligoadenylate synthetase activity(GO:0001730) |
| 0.0 | 0.2 | GO:0015440 | peptide-transporting ATPase activity(GO:0015440) |
| 0.0 | 0.1 | GO:0003886 | DNA (cytosine-5-)-methyltransferase activity(GO:0003886) |
| 0.0 | 0.1 | GO:0030020 | extracellular matrix structural constituent conferring tensile strength(GO:0030020) |
| 0.0 | 0.4 | GO:0043274 | phospholipase binding(GO:0043274) |
| 0.0 | 0.1 | GO:0005220 | inositol 1,4,5-trisphosphate-sensitive calcium-release channel activity(GO:0005220) |
| 0.0 | 0.2 | GO:0031386 | protein tag(GO:0031386) |
| 0.0 | 0.2 | GO:0043426 | MRF binding(GO:0043426) |
| 0.0 | 0.1 | GO:0001085 | RNA polymerase II transcription factor binding(GO:0001085) |
| 0.0 | 0.1 | GO:0000822 | inositol hexakisphosphate binding(GO:0000822) |
| 0.0 | 0.1 | GO:0031711 | bradykinin receptor binding(GO:0031711) |
| 0.0 | 0.1 | GO:0004823 | leucine-tRNA ligase activity(GO:0004823) |
| 0.0 | 0.2 | GO:0016812 | hydrolase activity, acting on carbon-nitrogen (but not peptide) bonds, in cyclic amides(GO:0016812) |
| 0.0 | 0.2 | GO:0017166 | vinculin binding(GO:0017166) |
| 0.0 | 0.1 | GO:0080130 | L-phenylalanine aminotransferase activity(GO:0070546) L-phenylalanine:2-oxoglutarate aminotransferase activity(GO:0080130) |
| 0.0 | 0.1 | GO:0001160 | transcription termination site sequence-specific DNA binding(GO:0001147) transcription termination site DNA binding(GO:0001160) |
| 0.0 | 0.1 | GO:0001129 | RNA polymerase II transcription factor activity, TBP-class protein binding, involved in preinitiation complex assembly(GO:0001129) RNA polymerase II transcription factor activity, TBP-class protein binding(GO:0001132) |
| 0.0 | 0.2 | GO:0016846 | carbon-sulfur lyase activity(GO:0016846) |
| 0.0 | 0.0 | GO:0016715 | oxidoreductase activity, acting on paired donors, with incorporation or reduction of molecular oxygen, reduced ascorbate as one donor, and incorporation of one atom of oxygen(GO:0016715) |
| 0.0 | 0.1 | GO:0034714 | type III transforming growth factor beta receptor binding(GO:0034714) |
| 0.0 | 0.1 | GO:0052740 | 1-acyl-2-lysophosphatidylserine acylhydrolase activity(GO:0052740) |
| 0.0 | 0.2 | GO:0005537 | mannose binding(GO:0005537) |
| 0.0 | 0.1 | GO:0004551 | nucleotide diphosphatase activity(GO:0004551) |
| 0.0 | 0.1 | GO:0042806 | fucose binding(GO:0042806) |
| 0.0 | 0.1 | GO:0070087 | chromo shadow domain binding(GO:0070087) |
| 0.0 | 0.2 | GO:0045159 | myosin II binding(GO:0045159) |
| 0.0 | 0.1 | GO:0004331 | 6-phosphofructo-2-kinase activity(GO:0003873) fructose-2,6-bisphosphate 2-phosphatase activity(GO:0004331) |
| 0.0 | 0.1 | GO:0071209 | U7 snRNA binding(GO:0071209) |
| 0.0 | 0.2 | GO:0031404 | chloride ion binding(GO:0031404) |
| 0.0 | 0.1 | GO:0086056 | voltage-gated calcium channel activity involved in AV node cell action potential(GO:0086056) |
| 0.0 | 0.1 | GO:0004550 | nucleoside diphosphate kinase activity(GO:0004550) |
| 0.0 | 0.0 | GO:1904854 | proteasome core complex binding(GO:1904854) |
| 0.0 | 0.2 | GO:0008553 | hydrogen-exporting ATPase activity, phosphorylative mechanism(GO:0008553) |
| 0.0 | 0.3 | GO:0035256 | G-protein coupled glutamate receptor binding(GO:0035256) |
| 0.0 | 0.0 | GO:0036033 | mediator complex binding(GO:0036033) |
| 0.0 | 0.4 | GO:0045505 | dynein intermediate chain binding(GO:0045505) |
| 0.0 | 0.2 | GO:0016594 | glycine binding(GO:0016594) |
| 0.0 | 0.1 | GO:0004427 | inorganic diphosphatase activity(GO:0004427) |
| 0.0 | 0.2 | GO:0001848 | complement binding(GO:0001848) |
| 0.0 | 0.2 | GO:0070182 | DNA polymerase binding(GO:0070182) |
| 0.0 | 0.1 | GO:0004957 | prostaglandin E receptor activity(GO:0004957) |
| 0.0 | 0.0 | GO:0004030 | aldehyde dehydrogenase [NAD(P)+] activity(GO:0004030) |
| 0.0 | 0.0 | GO:0050405 | [hydroxymethylglutaryl-CoA reductase (NADPH)] kinase activity(GO:0047322) [acetyl-CoA carboxylase] kinase activity(GO:0050405) |
| 0.0 | 0.0 | GO:0035033 | histone deacetylase regulator activity(GO:0035033) |
| 0.0 | 0.0 | GO:0017098 | sulfonylurea receptor binding(GO:0017098) |
| 0.0 | 0.1 | GO:0019207 | kinase regulator activity(GO:0019207) |
| 0.0 | 0.0 | GO:0004613 | phosphoenolpyruvate carboxykinase activity(GO:0004611) phosphoenolpyruvate carboxykinase (GTP) activity(GO:0004613) |
| 0.0 | 0.1 | GO:0016314 | phosphatidylinositol-3,4,5-trisphosphate 3-phosphatase activity(GO:0016314) |
| 0.0 | 0.0 | GO:0030626 | U12 snRNA binding(GO:0030626) |
| 0.0 | 0.3 | GO:0070628 | proteasome binding(GO:0070628) |
| 0.0 | 0.1 | GO:0016402 | pristanoyl-CoA oxidase activity(GO:0016402) |
| 0.0 | 0.2 | GO:0008307 | structural constituent of muscle(GO:0008307) |
| 0.0 | 0.1 | GO:0033857 | diphosphoinositol-pentakisphosphate kinase activity(GO:0033857) |
| 0.0 | 0.1 | GO:0008532 | N-acetyllactosaminide beta-1,3-N-acetylglucosaminyltransferase activity(GO:0008532) |
| 0.0 | 0.1 | GO:0015271 | outward rectifier potassium channel activity(GO:0015271) |
| 0.0 | 0.0 | GO:0008193 | tRNA guanylyltransferase activity(GO:0008193) |
| 0.0 | 0.1 | GO:0004325 | ferrochelatase activity(GO:0004325) |
| 0.0 | 0.1 | GO:0004310 | farnesyl-diphosphate farnesyltransferase activity(GO:0004310) squalene synthase activity(GO:0051996) |
| 0.0 | 0.1 | GO:0004873 | asialoglycoprotein receptor activity(GO:0004873) |
| 0.0 | 0.3 | GO:0030957 | Tat protein binding(GO:0030957) |
| 0.0 | 0.1 | GO:0071532 | ankyrin repeat binding(GO:0071532) |
| 0.0 | 0.1 | GO:0004465 | lipoprotein lipase activity(GO:0004465) |
| 0.0 | 0.2 | GO:0004576 | oligosaccharyl transferase activity(GO:0004576) |
| 0.0 | 0.2 | GO:0051525 | NFAT protein binding(GO:0051525) |
| 0.0 | 0.1 | GO:1901702 | urate transmembrane transporter activity(GO:0015143) salt transmembrane transporter activity(GO:1901702) |
| 0.0 | 0.1 | GO:0015464 | acetylcholine receptor activity(GO:0015464) |
| 0.0 | 0.3 | GO:0004690 | cyclic nucleotide-dependent protein kinase activity(GO:0004690) cAMP-dependent protein kinase activity(GO:0004691) |
| 0.0 | 0.2 | GO:0016884 | carbon-nitrogen ligase activity, with glutamine as amido-N-donor(GO:0016884) |
| 0.0 | 0.1 | GO:0042015 | interleukin-20 binding(GO:0042015) |
| 0.0 | 0.0 | GO:0030292 | protein tyrosine kinase inhibitor activity(GO:0030292) |
| 0.0 | 0.1 | GO:0070740 | tubulin-glutamic acid ligase activity(GO:0070740) |
| 0.0 | 0.0 | GO:0071885 | N-terminal protein N-methyltransferase activity(GO:0071885) |
| 0.0 | 0.1 | GO:0070815 | peptidyl-lysine 5-dioxygenase activity(GO:0070815) |
| 0.0 | 0.0 | GO:0017116 | single-stranded DNA-dependent ATP-dependent DNA helicase activity(GO:0017116) |
| 0.0 | 0.1 | GO:0070643 | vitamin D3 25-hydroxylase activity(GO:0030343) vitamin D 25-hydroxylase activity(GO:0070643) |
| 0.0 | 0.1 | GO:0008568 | microtubule-severing ATPase activity(GO:0008568) |
| 0.0 | 0.2 | GO:0097016 | L27 domain binding(GO:0097016) |
| 0.0 | 0.3 | GO:0001054 | RNA polymerase I activity(GO:0001054) |
| 0.0 | 0.3 | GO:0043024 | ribosomal small subunit binding(GO:0043024) |
| 0.0 | 0.3 | GO:0015095 | magnesium ion transmembrane transporter activity(GO:0015095) |
| 0.0 | 0.1 | GO:0032190 | acrosin binding(GO:0032190) |
| 0.0 | 0.1 | GO:0004322 | ferroxidase activity(GO:0004322) oxidoreductase activity, oxidizing metal ions, oxygen as acceptor(GO:0016724) |
| 0.0 | 0.1 | GO:0005487 | nucleocytoplasmic transporter activity(GO:0005487) |
| 0.0 | 0.0 | GO:0005000 | vasopressin receptor activity(GO:0005000) |
| 0.0 | 0.1 | GO:0010853 | cyclase activator activity(GO:0010853) guanylate cyclase activator activity(GO:0030250) |
| 0.0 | 0.4 | GO:0031210 | phosphatidylcholine binding(GO:0031210) |
| 0.0 | 0.1 | GO:0005134 | interleukin-2 receptor binding(GO:0005134) |
| 0.0 | 0.2 | GO:0003810 | protein-glutamine gamma-glutamyltransferase activity(GO:0003810) |
| 0.0 | 0.1 | GO:0009019 | tRNA (guanine-N1-)-methyltransferase activity(GO:0009019) |
| 0.0 | 0.1 | GO:0004321 | fatty-acyl-CoA synthase activity(GO:0004321) |
| 0.0 | 0.2 | GO:0052744 | phosphatidylinositol-3-phosphatase activity(GO:0004438) phosphatidylinositol monophosphate phosphatase activity(GO:0052744) |
| 0.0 | 0.0 | GO:0030984 | kininogen binding(GO:0030984) |
| 0.0 | 0.2 | GO:0102391 | decanoate--CoA ligase activity(GO:0102391) |
| 0.0 | 0.7 | GO:0005484 | SNAP receptor activity(GO:0005484) |
| 0.0 | 0.1 | GO:0019870 | potassium channel inhibitor activity(GO:0019870) |
| 0.0 | 0.1 | GO:0017127 | cholesterol transporter activity(GO:0017127) |
| 0.0 | 0.0 | GO:0008157 | protein phosphatase 1 binding(GO:0008157) |
| 0.0 | 0.0 | GO:0004362 | glutathione-disulfide reductase activity(GO:0004362) |
| 0.0 | 0.0 | GO:0035939 | microsatellite binding(GO:0035939) |
| 0.0 | 0.0 | GO:0004045 | aminoacyl-tRNA hydrolase activity(GO:0004045) |
| 0.0 | 0.0 | GO:0019828 | aspartic-type endopeptidase inhibitor activity(GO:0019828) |
| 0.0 | 0.1 | GO:1990450 | linear polyubiquitin binding(GO:1990450) |
| 0.0 | 0.2 | GO:0005049 | nuclear export signal receptor activity(GO:0005049) |
| 0.0 | 0.0 | GO:0097603 | temperature-gated ion channel activity(GO:0097603) |
| 0.0 | 0.0 | GO:0050211 | procollagen galactosyltransferase activity(GO:0050211) |
| 0.0 | 0.2 | GO:0043047 | single-stranded telomeric DNA binding(GO:0043047) |
| 0.0 | 0.5 | GO:0004364 | glutathione transferase activity(GO:0004364) |
| 0.0 | 0.0 | GO:0030346 | protein phosphatase 2B binding(GO:0030346) |
| 0.0 | 0.0 | GO:0071207 | histone pre-mRNA stem-loop binding(GO:0071207) |
| 0.0 | 0.1 | GO:0004169 | dolichyl-phosphate-mannose-protein mannosyltransferase activity(GO:0004169) |
| 0.0 | 0.1 | GO:0042289 | MHC class II protein binding(GO:0042289) |
| 0.0 | 0.0 | GO:0015265 | urea channel activity(GO:0015265) |
| 0.0 | 0.0 | GO:0005173 | stem cell factor receptor binding(GO:0005173) |
| 0.0 | 0.1 | GO:0019911 | structural constituent of myelin sheath(GO:0019911) |
| 0.0 | 0.4 | GO:0051787 | misfolded protein binding(GO:0051787) |
| 0.0 | 0.1 | GO:0015183 | L-aspartate transmembrane transporter activity(GO:0015183) |
| 0.0 | 0.1 | GO:0004826 | phenylalanine-tRNA ligase activity(GO:0004826) |
| 0.0 | 0.4 | GO:0035615 | clathrin adaptor activity(GO:0035615) endocytic adaptor activity(GO:0098748) |
| 0.0 | 0.1 | GO:0033613 | activating transcription factor binding(GO:0033613) |
| 0.0 | 0.1 | GO:0034186 | apolipoprotein A-I binding(GO:0034186) |
| 0.0 | 0.0 | GO:0008511 | sodium:potassium:chloride symporter activity(GO:0008511) |
| 0.0 | 0.1 | GO:0016822 | hydrolase activity, acting on acid carbon-carbon bonds(GO:0016822) hydrolase activity, acting on acid carbon-carbon bonds, in ketonic substances(GO:0016823) |
| 0.0 | 0.0 | GO:0055131 | C3HC4-type RING finger domain binding(GO:0055131) |
| 0.0 | 0.2 | GO:0017147 | Wnt-protein binding(GO:0017147) |
| 0.0 | 0.1 | GO:0004568 | chitinase activity(GO:0004568) |
| 0.0 | 0.2 | GO:1901611 | phosphatidylglycerol binding(GO:1901611) |
| 0.0 | 0.0 | GO:0036132 | 13-prostaglandin reductase activity(GO:0036132) 15-oxoprostaglandin 13-oxidase activity(GO:0047522) |
| 0.0 | 0.0 | GO:0008670 | 2,4-dienoyl-CoA reductase (NADPH) activity(GO:0008670) |
| 0.0 | 0.1 | GO:0004095 | carnitine O-palmitoyltransferase activity(GO:0004095) |
| 0.0 | 0.1 | GO:0050501 | hyaluronan synthase activity(GO:0050501) |
| 0.0 | 0.1 | GO:0016167 | glial cell-derived neurotrophic factor receptor activity(GO:0016167) |
| 0.0 | 0.1 | GO:0098821 | BMP receptor activity(GO:0098821) |
| 0.0 | 0.0 | GO:0016941 | natriuretic peptide receptor activity(GO:0016941) |
| 0.0 | 0.1 | GO:0003917 | DNA topoisomerase type I activity(GO:0003917) |
| 0.0 | 0.1 | GO:0004991 | parathyroid hormone receptor activity(GO:0004991) |
| 0.0 | 0.0 | GO:0000701 | purine-specific mismatch base pair DNA N-glycosylase activity(GO:0000701) |
| 0.0 | 0.1 | GO:0102336 | fatty acid elongase activity(GO:0009922) 3-oxo-arachidoyl-CoA synthase activity(GO:0102336) 3-oxo-cerotoyl-CoA synthase activity(GO:0102337) 3-oxo-lignoceronyl-CoA synthase activity(GO:0102338) |
| 0.0 | 0.1 | GO:0005287 | high-affinity basic amino acid transmembrane transporter activity(GO:0005287) high-affinity arginine transmembrane transporter activity(GO:0005289) high-affinity lysine transmembrane transporter activity(GO:0005292) |
| 0.0 | 0.1 | GO:0004767 | sphingomyelin phosphodiesterase activity(GO:0004767) |
| 0.0 | 0.3 | GO:0019992 | diacylglycerol binding(GO:0019992) |
| 0.0 | 0.0 | GO:0050253 | retinyl-palmitate esterase activity(GO:0050253) |
| 0.0 | 0.0 | GO:0046404 | ATP-dependent polydeoxyribonucleotide 5'-hydroxyl-kinase activity(GO:0046404) polydeoxyribonucleotide kinase activity(GO:0051733) ATP-dependent polynucleotide kinase activity(GO:0051734) |
| 0.0 | 0.0 | GO:0035514 | DNA demethylase activity(GO:0035514) |
| 0.0 | 0.0 | GO:0042610 | CD8 receptor binding(GO:0042610) |
| 0.0 | 0.3 | GO:0015002 | cytochrome-c oxidase activity(GO:0004129) heme-copper terminal oxidase activity(GO:0015002) oxidoreductase activity, acting on a heme group of donors, oxygen as acceptor(GO:0016676) |
| 0.0 | 0.1 | GO:0017128 | phospholipid scramblase activity(GO:0017128) |
| 0.0 | 0.1 | GO:0015226 | amino-acid betaine transmembrane transporter activity(GO:0015199) carnitine transmembrane transporter activity(GO:0015226) |
| 0.0 | 0.0 | GO:0048763 | calcium-induced calcium release activity(GO:0048763) |
| 0.0 | 0.0 | GO:0003916 | DNA topoisomerase activity(GO:0003916) |
| 0.0 | 0.2 | GO:0016176 | superoxide-generating NADPH oxidase activator activity(GO:0016176) |
| 0.0 | 0.1 | GO:0010997 | anaphase-promoting complex binding(GO:0010997) |
| 0.0 | 0.7 | GO:0019843 | rRNA binding(GO:0019843) |
| 0.0 | 0.1 | GO:0070700 | BMP receptor binding(GO:0070700) |
| 0.0 | 0.0 | GO:0035925 | mRNA 3'-UTR AU-rich region binding(GO:0035925) |
| 0.0 | 0.2 | GO:0005225 | volume-sensitive anion channel activity(GO:0005225) |
| 0.0 | 0.1 | GO:0019158 | glucokinase activity(GO:0004340) hexokinase activity(GO:0004396) fructokinase activity(GO:0008865) mannokinase activity(GO:0019158) |
| 0.0 | 0.1 | GO:0035242 | protein-arginine omega-N asymmetric methyltransferase activity(GO:0035242) |
| 0.0 | 0.1 | GO:0005332 | gamma-aminobutyric acid:sodium symporter activity(GO:0005332) |
| 0.0 | 0.0 | GO:0051765 | inositol tetrakisphosphate kinase activity(GO:0051765) |
| 0.0 | 0.1 | GO:0071933 | Arp2/3 complex binding(GO:0071933) |
| 0.0 | 0.2 | GO:0004862 | cAMP-dependent protein kinase inhibitor activity(GO:0004862) |
| 0.0 | 0.0 | GO:0051731 | polynucleotide 5'-hydroxyl-kinase activity(GO:0051731) |
| 0.0 | 0.0 | GO:0003990 | acetylcholinesterase activity(GO:0003990) |
Gene overrepresentation in C2:CP category:
| Log-likelihood per target | Total log-likelihood | Term | Description |
|---|---|---|---|
| 0.0 | 0.1 | SIG BCR SIGNALING PATHWAY | Members of the BCR signaling pathway |
| 0.0 | 0.2 | PID IL3 PATHWAY | IL3-mediated signaling events |
| 0.0 | 0.7 | PID TCR JNK PATHWAY | JNK signaling in the CD4+ TCR pathway |
| 0.0 | 0.5 | PID RANBP2 PATHWAY | Sumoylation by RanBP2 regulates transcriptional repression |
| 0.0 | 0.7 | PID RHODOPSIN PATHWAY | Visual signal transduction: Rods |
| 0.0 | 0.5 | PID ERB GENOMIC PATHWAY | Validated nuclear estrogen receptor beta network |
| 0.0 | 0.0 | PID IL8 CXCR1 PATHWAY | IL8- and CXCR1-mediated signaling events |
| 0.0 | 1.9 | PID AMB2 NEUTROPHILS PATHWAY | amb2 Integrin signaling |
| 0.0 | 1.3 | SIG REGULATION OF THE ACTIN CYTOSKELETON BY RHO GTPASES | Genes related to regulation of the actin cytoskeleton |
| 0.0 | 1.1 | PID VEGFR1 PATHWAY | VEGFR1 specific signals |
| 0.0 | 0.0 | PID THROMBIN PAR4 PATHWAY | PAR4-mediated thrombin signaling events |
| 0.0 | 0.2 | ST INTERFERON GAMMA PATHWAY | Interferon gamma pathway. |
| 0.0 | 0.1 | SA TRKA RECEPTOR | The TrkA receptor binds nerve growth factor to activate MAP kinase pathways and promote cell growth. |
| 0.0 | 0.5 | PID P38 MKK3 6PATHWAY | p38 MAPK signaling pathway |
| 0.0 | 0.0 | PID ENDOTHELIN PATHWAY | Endothelins |
| 0.0 | 0.3 | PID NFKAPPAB ATYPICAL PATHWAY | Atypical NF-kappaB pathway |
| 0.0 | 0.6 | PID NECTIN PATHWAY | Nectin adhesion pathway |
| 0.0 | 0.5 | PID ERBB NETWORK PATHWAY | ErbB receptor signaling network |
| 0.0 | 0.1 | PID IGF1 PATHWAY | IGF1 pathway |
| 0.0 | 0.1 | ST PAC1 RECEPTOR PATHWAY | PAC1 Receptor Pathway |
| 0.0 | 0.1 | PID FRA PATHWAY | Validated transcriptional targets of AP1 family members Fra1 and Fra2 |
| 0.0 | 0.1 | PID ECADHERIN KERATINOCYTE PATHWAY | E-cadherin signaling in keratinocytes |
| 0.0 | 0.1 | PID IL1 PATHWAY | IL1-mediated signaling events |
| 0.0 | 0.6 | PID CD40 PATHWAY | CD40/CD40L signaling |
| 0.0 | 0.4 | PID LYMPH ANGIOGENESIS PATHWAY | VEGFR3 signaling in lymphatic endothelium |
| 0.0 | 0.6 | PID RAS PATHWAY | Regulation of Ras family activation |
| 0.0 | 0.2 | PID SYNDECAN 3 PATHWAY | Syndecan-3-mediated signaling events |
| 0.0 | 0.4 | PID GMCSF PATHWAY | GMCSF-mediated signaling events |
| 0.0 | 0.3 | PID ECADHERIN NASCENT AJ PATHWAY | E-cadherin signaling in the nascent adherens junction |
| 0.0 | 0.2 | PID P38 ALPHA BETA PATHWAY | Regulation of p38-alpha and p38-beta |
Gene overrepresentation in C2:CP:REACTOME category:
| Log-likelihood per target | Total log-likelihood | Term | Description |
|---|---|---|---|
| 0.1 | 0.2 | REACTOME CREATION OF C4 AND C2 ACTIVATORS | Genes involved in Creation of C4 and C2 activators |
| 0.1 | 0.1 | REACTOME RNA POL I PROMOTER OPENING | Genes involved in RNA Polymerase I Promoter Opening |
| 0.0 | 0.6 | REACTOME PRESYNAPTIC NICOTINIC ACETYLCHOLINE RECEPTORS | Genes involved in Presynaptic nicotinic acetylcholine receptors |
| 0.0 | 0.6 | REACTOME ACETYLCHOLINE NEUROTRANSMITTER RELEASE CYCLE | Genes involved in Acetylcholine Neurotransmitter Release Cycle |
| 0.0 | 0.9 | REACTOME GABA A RECEPTOR ACTIVATION | Genes involved in GABA A receptor activation |
| 0.0 | 0.1 | REACTOME INHIBITION OF INSULIN SECRETION BY ADRENALINE NORADRENALINE | Genes involved in Inhibition of Insulin Secretion by Adrenaline/Noradrenaline |
| 0.0 | 0.4 | REACTOME PROSTANOID LIGAND RECEPTORS | Genes involved in Prostanoid ligand receptors |
| 0.0 | 1.2 | REACTOME KERATAN SULFATE BIOSYNTHESIS | Genes involved in Keratan sulfate biosynthesis |
| 0.0 | 0.1 | REACTOME PECAM1 INTERACTIONS | Genes involved in PECAM1 interactions |
| 0.0 | 0.4 | REACTOME ENDOGENOUS STEROLS | Genes involved in Endogenous sterols |
| 0.0 | 0.1 | REACTOME SIGNALLING TO P38 VIA RIT AND RIN | Genes involved in Signalling to p38 via RIT and RIN |
| 0.0 | 0.1 | REACTOME VIF MEDIATED DEGRADATION OF APOBEC3G | Genes involved in Vif-mediated degradation of APOBEC3G |
| 0.0 | 0.0 | REACTOME PROCESSIVE SYNTHESIS ON THE LAGGING STRAND | Genes involved in Processive synthesis on the lagging strand |
| 0.0 | 0.4 | REACTOME ACTIVATION OF CHAPERONE GENES BY ATF6 ALPHA | Genes involved in Activation of Chaperone Genes by ATF6-alpha |
| 0.0 | 0.3 | REACTOME GLUTAMATE NEUROTRANSMITTER RELEASE CYCLE | Genes involved in Glutamate Neurotransmitter Release Cycle |
| 0.0 | 0.6 | REACTOME SYNTHESIS OF BILE ACIDS AND BILE SALTS | Genes involved in Synthesis of bile acids and bile salts |
| 0.0 | 0.4 | REACTOME REGULATION OF IFNA SIGNALING | Genes involved in Regulation of IFNA signaling |
| 0.0 | 0.4 | REACTOME THE NLRP3 INFLAMMASOME | Genes involved in The NLRP3 inflammasome |
| 0.0 | 0.1 | REACTOME BINDING AND ENTRY OF HIV VIRION | Genes involved in Binding and entry of HIV virion |
| 0.0 | 0.2 | REACTOME PYRUVATE METABOLISM | Genes involved in Pyruvate metabolism |
| 0.0 | 0.9 | REACTOME CHEMOKINE RECEPTORS BIND CHEMOKINES | Genes involved in Chemokine receptors bind chemokines |
| 0.0 | 0.5 | REACTOME TETRAHYDROBIOPTERIN BH4 SYNTHESIS RECYCLING SALVAGE AND REGULATION | Genes involved in Tetrahydrobiopterin (BH4) synthesis, recycling, salvage and regulation |
| 0.0 | 0.0 | REACTOME G BETA GAMMA SIGNALLING THROUGH PLC BETA | Genes involved in G beta:gamma signalling through PLC beta |
| 0.0 | 0.3 | REACTOME DIGESTION OF DIETARY CARBOHYDRATE | Genes involved in Digestion of dietary carbohydrate |
| 0.0 | 0.7 | REACTOME TRAFFICKING OF GLUR2 CONTAINING AMPA RECEPTORS | Genes involved in Trafficking of GluR2-containing AMPA receptors |
| 0.0 | 0.1 | REACTOME RETROGRADE NEUROTROPHIN SIGNALLING | Genes involved in Retrograde neurotrophin signalling |
| 0.0 | 0.2 | REACTOME KERATAN SULFATE KERATIN METABOLISM | Genes involved in Keratan sulfate/keratin metabolism |
| 0.0 | 2.2 | REACTOME ACTIVATION OF THE MRNA UPON BINDING OF THE CAP BINDING COMPLEX AND EIFS AND SUBSEQUENT BINDING TO 43S | Genes involved in Activation of the mRNA upon binding of the cap-binding complex and eIFs, and subsequent binding to 43S |
| 0.0 | 0.7 | REACTOME INHIBITION OF THE PROTEOLYTIC ACTIVITY OF APC C REQUIRED FOR THE ONSET OF ANAPHASE BY MITOTIC SPINDLE CHECKPOINT COMPONENTS | Genes involved in Inhibition of the proteolytic activity of APC/C required for the onset of anaphase by mitotic spindle checkpoint components |
| 0.0 | 0.1 | REACTOME APC C CDC20 MEDIATED DEGRADATION OF CYCLIN B | Genes involved in APC/C:Cdc20 mediated degradation of Cyclin B |
| 0.0 | 0.2 | REACTOME LIGAND GATED ION CHANNEL TRANSPORT | Genes involved in Ligand-gated ion channel transport |
| 0.0 | 0.7 | REACTOME ENDOSOMAL SORTING COMPLEX REQUIRED FOR TRANSPORT ESCRT | Genes involved in Endosomal Sorting Complex Required For Transport (ESCRT) |
| 0.0 | 0.1 | REACTOME SEMA3A PLEXIN REPULSION SIGNALING BY INHIBITING INTEGRIN ADHESION | Genes involved in SEMA3A-Plexin repulsion signaling by inhibiting Integrin adhesion |
| 0.0 | 0.3 | REACTOME REGULATION OF PYRUVATE DEHYDROGENASE PDH COMPLEX | Genes involved in Regulation of pyruvate dehydrogenase (PDH) complex |
| 0.0 | 0.4 | REACTOME PURINE RIBONUCLEOSIDE MONOPHOSPHATE BIOSYNTHESIS | Genes involved in Purine ribonucleoside monophosphate biosynthesis |
| 0.0 | 0.0 | REACTOME TRIGLYCERIDE BIOSYNTHESIS | Genes involved in Triglyceride Biosynthesis |
| 0.0 | 0.0 | REACTOME AUTODEGRADATION OF THE E3 UBIQUITIN LIGASE COP1 | Genes involved in Autodegradation of the E3 ubiquitin ligase COP1 |
| 0.0 | 0.1 | REACTOME SIGNALING BY ERBB2 | Genes involved in Signaling by ERBB2 |
| 0.0 | 0.3 | REACTOME ACTIVATED POINT MUTANTS OF FGFR2 | Genes involved in Activated point mutants of FGFR2 |
| 0.0 | 0.2 | REACTOME ENOS ACTIVATION AND REGULATION | Genes involved in eNOS activation and regulation |
| 0.0 | 0.3 | REACTOME ASSOCIATION OF LICENSING FACTORS WITH THE PRE REPLICATIVE COMPLEX | Genes involved in Association of licensing factors with the pre-replicative complex |
| 0.0 | 0.1 | REACTOME ARMS MEDIATED ACTIVATION | Genes involved in ARMS-mediated activation |
| 0.0 | 0.1 | REACTOME PEPTIDE CHAIN ELONGATION | Genes involved in Peptide chain elongation |
| 0.0 | 0.1 | REACTOME CLEAVAGE OF GROWING TRANSCRIPT IN THE TERMINATION REGION | Genes involved in Cleavage of Growing Transcript in the Termination Region |
| 0.0 | 0.2 | REACTOME REGULATION OF THE FANCONI ANEMIA PATHWAY | Genes involved in Regulation of the Fanconi anemia pathway |
| 0.0 | 0.5 | REACTOME PROSTACYCLIN SIGNALLING THROUGH PROSTACYCLIN RECEPTOR | Genes involved in Prostacyclin signalling through prostacyclin receptor |
| 0.0 | 0.7 | REACTOME NITRIC OXIDE STIMULATES GUANYLATE CYCLASE | Genes involved in Nitric oxide stimulates guanylate cyclase |
| 0.0 | 0.3 | REACTOME SYNTHESIS SECRETION AND DEACYLATION OF GHRELIN | Genes involved in Synthesis, Secretion, and Deacylation of Ghrelin |
| 0.0 | 0.4 | REACTOME ACTIVATION OF THE AP1 FAMILY OF TRANSCRIPTION FACTORS | Genes involved in Activation of the AP-1 family of transcription factors |
| 0.0 | 0.1 | REACTOME BILE SALT AND ORGANIC ANION SLC TRANSPORTERS | Genes involved in Bile salt and organic anion SLC transporters |
| 0.0 | 0.3 | REACTOME PROTEOLYTIC CLEAVAGE OF SNARE COMPLEX PROTEINS | Genes involved in Proteolytic cleavage of SNARE complex proteins |
| 0.0 | 0.1 | REACTOME REGULATION OF WATER BALANCE BY RENAL AQUAPORINS | Genes involved in Regulation of Water Balance by Renal Aquaporins |
| 0.0 | 0.1 | REACTOME TRANSLOCATION OF ZAP 70 TO IMMUNOLOGICAL SYNAPSE | Genes involved in Translocation of ZAP-70 to Immunological synapse |
| 0.0 | 0.2 | REACTOME NA CL DEPENDENT NEUROTRANSMITTER TRANSPORTERS | Genes involved in Na+/Cl- dependent neurotransmitter transporters |
| 0.0 | 1.2 | REACTOME IMMUNOREGULATORY INTERACTIONS BETWEEN A LYMPHOID AND A NON LYMPHOID CELL | Genes involved in Immunoregulatory interactions between a Lymphoid and a non-Lymphoid cell |
| 0.0 | 0.2 | REACTOME GAP JUNCTION DEGRADATION | Genes involved in Gap junction degradation |
| 0.0 | 0.1 | REACTOME THROMBOXANE SIGNALLING THROUGH TP RECEPTOR | Genes involved in Thromboxane signalling through TP receptor |
| 0.0 | 0.1 | REACTOME IRAK2 MEDIATED ACTIVATION OF TAK1 COMPLEX UPON TLR7 8 OR 9 STIMULATION | Genes involved in IRAK2 mediated activation of TAK1 complex upon TLR7/8 or 9 stimulation |
| 0.0 | 0.6 | REACTOME KINESINS | Genes involved in Kinesins |
| 0.0 | 0.0 | REACTOME ADP SIGNALLING THROUGH P2RY1 | Genes involved in ADP signalling through P2Y purinoceptor 1 |
| 0.0 | 0.3 | REACTOME ACTIVATION OF BH3 ONLY PROTEINS | Genes involved in Activation of BH3-only proteins |
| 0.0 | 0.5 | REACTOME SHC1 EVENTS IN ERBB4 SIGNALING | Genes involved in SHC1 events in ERBB4 signaling |
| 0.0 | 0.2 | REACTOME PURINE CATABOLISM | Genes involved in Purine catabolism |
| 0.0 | 0.1 | REACTOME PD1 SIGNALING | Genes involved in PD-1 signaling |
| 0.0 | 0.2 | REACTOME SYNTHESIS OF PIPS AT THE LATE ENDOSOME MEMBRANE | Genes involved in Synthesis of PIPs at the late endosome membrane |
| 0.0 | 0.5 | REACTOME CYTOSOLIC TRNA AMINOACYLATION | Genes involved in Cytosolic tRNA aminoacylation |
| 0.0 | 0.1 | REACTOME CONVERSION FROM APC C CDC20 TO APC C CDH1 IN LATE ANAPHASE | Genes involved in Conversion from APC/C:Cdc20 to APC/C:Cdh1 in late anaphase |
| 0.0 | 0.1 | REACTOME SYNTHESIS SECRETION AND INACTIVATION OF GIP | Genes involved in Synthesis, Secretion, and Inactivation of Glucose-dependent Insulinotropic Polypeptide (GIP) |
| 0.0 | 0.4 | REACTOME GENERATION OF SECOND MESSENGER MOLECULES | Genes involved in Generation of second messenger molecules |
| 0.0 | 0.3 | REACTOME STEROID HORMONES | Genes involved in Steroid hormones |
| 0.0 | 0.3 | REACTOME TGF BETA RECEPTOR SIGNALING IN EMT EPITHELIAL TO MESENCHYMAL TRANSITION | Genes involved in TGF-beta receptor signaling in EMT (epithelial to mesenchymal transition) |
| 0.0 | 0.2 | REACTOME GAP JUNCTION TRAFFICKING | Genes involved in Gap junction trafficking |
| 0.0 | 0.2 | REACTOME SIGNALLING BY NGF | Genes involved in Signalling by NGF |
| 0.0 | 0.2 | REACTOME INHIBITION OF REPLICATION INITIATION OF DAMAGED DNA BY RB1 E2F1 | Genes involved in Inhibition of replication initiation of damaged DNA by RB1/E2F1 |
| 0.0 | 0.5 | REACTOME SIGNAL TRANSDUCTION BY L1 | Genes involved in Signal transduction by L1 |
| 0.0 | 0.1 | REACTOME INFLAMMASOMES | Genes involved in Inflammasomes |
| 0.0 | 0.2 | REACTOME CHYLOMICRON MEDIATED LIPID TRANSPORT | Genes involved in Chylomicron-mediated lipid transport |