Project
A549 cells infected with IAV Analysis Results (GEO series: GSE147507)
Navigation
Downloads
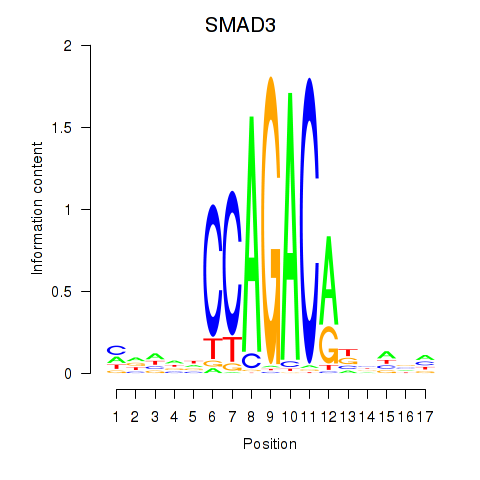
Results for SMAD3
Z-value: 2.20
Motif logo
Transcription factors associated with SMAD3
| Gene Symbol | Gene ID | Gene Info |
|---|---|---|
|
SMAD3
|
ENSG00000166949.11 | SMAD family member 3 |
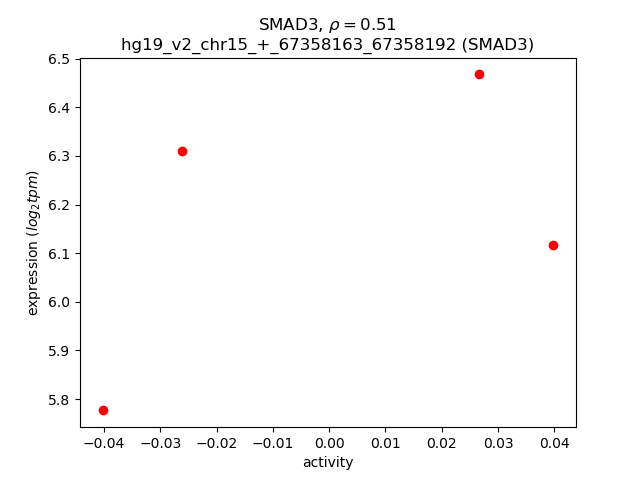
Activity-expression correlation:
| Gene | Promoter | Pearson corr. coef. | P-value | Plot |
|---|---|---|---|---|
| SMAD3 | hg19_v2_chr15_+_67358163_67358192 | 0.51 | 4.9e-01 | Click! |
Activity profile of SMAD3 motif
Sorted Z-values of SMAD3 motif
| Promoter | Log-likelihood | Transcript | Gene | Gene Info |
|---|---|---|---|---|
| chr6_-_26027480 | 3.66 |
ENST00000377364.3
|
HIST1H4B
|
histone cluster 1, H4b |
| chr6_+_27782788 | 2.76 |
ENST00000359465.4
|
HIST1H2BM
|
histone cluster 1, H2bm |
| chr6_+_27114861 | 2.74 |
ENST00000377459.1
|
HIST1H2AH
|
histone cluster 1, H2ah |
| chr6_-_26189304 | 2.73 |
ENST00000340756.2
|
HIST1H4D
|
histone cluster 1, H4d |
| chr6_+_26273144 | 2.30 |
ENST00000377733.2
|
HIST1H2BI
|
histone cluster 1, H2bi |
| chr6_-_27782548 | 1.97 |
ENST00000333151.3
|
HIST1H2AJ
|
histone cluster 1, H2aj |
| chr6_-_27775694 | 1.86 |
ENST00000377401.2
|
HIST1H2BL
|
histone cluster 1, H2bl |
| chr6_+_27791862 | 1.86 |
ENST00000355057.1
|
HIST1H4J
|
histone cluster 1, H4j |
| chr6_-_27860956 | 1.63 |
ENST00000359611.2
|
HIST1H2AM
|
histone cluster 1, H2am |
| chr6_+_27775899 | 1.58 |
ENST00000358739.3
|
HIST1H2AI
|
histone cluster 1, H2ai |
| chr6_-_26033796 | 1.16 |
ENST00000259791.2
|
HIST1H2AB
|
histone cluster 1, H2ab |
| chr6_-_26285737 | 1.14 |
ENST00000377727.1
ENST00000289352.1 |
HIST1H4H
|
histone cluster 1, H4h |
| chr1_+_149804218 | 1.12 |
ENST00000610125.1
|
HIST2H4A
|
histone cluster 2, H4a |
| chr16_-_31076273 | 0.91 |
ENST00000426488.2
|
ZNF668
|
zinc finger protein 668 |
| chr16_-_31076332 | 0.91 |
ENST00000539836.3
ENST00000535577.1 ENST00000442862.2 |
ZNF668
|
zinc finger protein 668 |
| chr11_+_35222629 | 0.85 |
ENST00000526553.1
|
CD44
|
CD44 molecule (Indian blood group) |
| chr6_-_27100529 | 0.83 |
ENST00000607124.1
ENST00000339812.2 ENST00000541790.1 |
HIST1H2BJ
|
histone cluster 1, H2bj |
| chr20_+_55926625 | 0.81 |
ENST00000452119.1
|
RAE1
|
ribonucleic acid export 1 |
| chr5_-_180242534 | 0.77 |
ENST00000333055.3
ENST00000513431.1 |
MGAT1
|
mannosyl (alpha-1,3-)-glycoprotein beta-1,2-N-acetylglucosaminyltransferase |
| chr6_-_26216872 | 0.77 |
ENST00000244601.3
|
HIST1H2BG
|
histone cluster 1, H2bg |
| chr19_+_18283959 | 0.73 |
ENST00000597802.2
|
IFI30
|
interferon, gamma-inducible protein 30 |
| chr6_+_26204825 | 0.71 |
ENST00000360441.4
|
HIST1H4E
|
histone cluster 1, H4e |
| chr11_+_57531292 | 0.69 |
ENST00000524579.1
|
CTNND1
|
catenin (cadherin-associated protein), delta 1 |
| chr6_+_27861190 | 0.68 |
ENST00000303806.4
|
HIST1H2BO
|
histone cluster 1, H2bo |
| chr1_-_156399184 | 0.67 |
ENST00000368243.1
ENST00000357975.4 ENST00000310027.5 ENST00000400991.2 |
C1orf61
|
chromosome 1 open reading frame 61 |
| chr6_-_27806117 | 0.60 |
ENST00000330180.2
|
HIST1H2AK
|
histone cluster 1, H2ak |
| chr19_+_36132631 | 0.57 |
ENST00000379026.2
ENST00000379023.4 ENST00000402764.2 ENST00000479824.1 |
ETV2
|
ets variant 2 |
| chr5_-_180242576 | 0.57 |
ENST00000514438.1
|
MGAT1
|
mannosyl (alpha-1,3-)-glycoprotein beta-1,2-N-acetylglucosaminyltransferase |
| chr6_+_27100811 | 0.57 |
ENST00000359193.2
|
HIST1H2AG
|
histone cluster 1, H2ag |
| chr15_+_63889577 | 0.56 |
ENST00000534939.1
ENST00000539570.3 |
FBXL22
|
F-box and leucine-rich repeat protein 22 |
| chr16_+_699319 | 0.55 |
ENST00000549091.1
ENST00000293879.4 |
WDR90
|
WD repeat domain 90 |
| chrX_+_47444613 | 0.54 |
ENST00000445623.1
|
TIMP1
|
TIMP metallopeptidase inhibitor 1 |
| chr8_+_22250334 | 0.53 |
ENST00000520832.1
|
SLC39A14
|
solute carrier family 39 (zinc transporter), member 14 |
| chr10_-_106098162 | 0.45 |
ENST00000337478.1
|
ITPRIP
|
inositol 1,4,5-trisphosphate receptor interacting protein |
| chr1_+_200863949 | 0.44 |
ENST00000413687.2
|
C1orf106
|
chromosome 1 open reading frame 106 |
| chr17_-_73874654 | 0.43 |
ENST00000254816.2
|
TRIM47
|
tripartite motif containing 47 |
| chr14_-_65409502 | 0.42 |
ENST00000389614.5
|
GPX2
|
glutathione peroxidase 2 (gastrointestinal) |
| chr16_-_57798253 | 0.42 |
ENST00000565270.1
|
KIFC3
|
kinesin family member C3 |
| chr20_+_55926566 | 0.42 |
ENST00000411894.1
ENST00000429339.1 |
RAE1
|
ribonucleic acid export 1 |
| chr16_-_84220604 | 0.41 |
ENST00000567759.1
|
TAF1C
|
TATA box binding protein (TBP)-associated factor, RNA polymerase I, C, 110kDa |
| chr2_-_220110187 | 0.40 |
ENST00000295759.7
ENST00000392089.2 |
GLB1L
|
galactosidase, beta 1-like |
| chr16_-_84220633 | 0.40 |
ENST00000566732.1
ENST00000561955.1 ENST00000564454.1 ENST00000341690.6 ENST00000541676.1 ENST00000570117.1 ENST00000564345.1 |
TAF1C
|
TATA box binding protein (TBP)-associated factor, RNA polymerase I, C, 110kDa |
| chr20_+_44036900 | 0.40 |
ENST00000443296.1
|
DBNDD2
|
dysbindin (dystrobrevin binding protein 1) domain containing 2 |
| chr16_-_425205 | 0.39 |
ENST00000448854.1
|
TMEM8A
|
transmembrane protein 8A |
| chr20_-_43280325 | 0.39 |
ENST00000537820.1
|
ADA
|
adenosine deaminase |
| chr7_-_55620433 | 0.38 |
ENST00000418904.1
|
VOPP1
|
vesicular, overexpressed in cancer, prosurvival protein 1 |
| chr14_+_96858454 | 0.38 |
ENST00000555570.1
|
AK7
|
adenylate kinase 7 |
| chr6_-_26124138 | 0.38 |
ENST00000314332.5
ENST00000396984.1 |
HIST1H2BC
|
histone cluster 1, H2bc |
| chr16_+_57847684 | 0.37 |
ENST00000335616.2
|
CTD-2600O9.1
|
uncharacterized protein LOC388282 |
| chr8_+_128747661 | 0.37 |
ENST00000259523.6
|
MYC
|
v-myc avian myelocytomatosis viral oncogene homolog |
| chr7_+_139528952 | 0.36 |
ENST00000416849.2
ENST00000436047.2 ENST00000414508.2 ENST00000448866.1 |
TBXAS1
|
thromboxane A synthase 1 (platelet) |
| chr11_-_65150103 | 0.36 |
ENST00000294187.6
ENST00000398802.1 ENST00000360662.3 ENST00000377152.2 ENST00000530936.1 |
SLC25A45
|
solute carrier family 25, member 45 |
| chr5_+_140566 | 0.35 |
ENST00000502646.1
|
PLEKHG4B
|
pleckstrin homology domain containing, family G (with RhoGef domain) member 4B |
| chr5_+_140625147 | 0.35 |
ENST00000231173.3
|
PCDHB15
|
protocadherin beta 15 |
| chr20_+_44036620 | 0.33 |
ENST00000372710.3
|
DBNDD2
|
dysbindin (dystrobrevin binding protein 1) domain containing 2 |
| chr22_+_20877924 | 0.33 |
ENST00000445189.1
|
MED15
|
mediator complex subunit 15 |
| chr2_-_208031943 | 0.33 |
ENST00000421199.1
ENST00000457962.1 |
KLF7
|
Kruppel-like factor 7 (ubiquitous) |
| chr2_+_28615669 | 0.33 |
ENST00000379619.1
ENST00000264716.4 |
FOSL2
|
FOS-like antigen 2 |
| chr6_+_41888926 | 0.32 |
ENST00000230340.4
|
BYSL
|
bystin-like |
| chr16_-_30773372 | 0.32 |
ENST00000545825.1
ENST00000541260.1 |
C16orf93
|
chromosome 16 open reading frame 93 |
| chr15_+_63889552 | 0.32 |
ENST00000360587.2
|
FBXL22
|
F-box and leucine-rich repeat protein 22 |
| chr5_+_140529630 | 0.32 |
ENST00000543635.1
|
PCDHB6
|
protocadherin beta 6 |
| chr7_+_139529040 | 0.31 |
ENST00000455353.1
ENST00000458722.1 ENST00000411653.1 |
TBXAS1
|
thromboxane A synthase 1 (platelet) |
| chr6_-_27841289 | 0.31 |
ENST00000355981.2
|
HIST1H4L
|
histone cluster 1, H4l |
| chr20_-_43280361 | 0.31 |
ENST00000372874.4
|
ADA
|
adenosine deaminase |
| chr7_-_22862448 | 0.31 |
ENST00000358435.4
|
TOMM7
|
translocase of outer mitochondrial membrane 7 homolog (yeast) |
| chr1_-_44482979 | 0.31 |
ENST00000360584.2
ENST00000357730.2 ENST00000528803.1 |
SLC6A9
|
solute carrier family 6 (neurotransmitter transporter, glycine), member 9 |
| chr19_+_42724423 | 0.30 |
ENST00000301215.3
ENST00000597945.1 |
ZNF526
|
zinc finger protein 526 |
| chr19_-_42724261 | 0.29 |
ENST00000595337.1
|
DEDD2
|
death effector domain containing 2 |
| chr16_-_11036300 | 0.29 |
ENST00000331808.4
|
DEXI
|
Dexi homolog (mouse) |
| chr1_+_202385953 | 0.29 |
ENST00000466968.1
|
PPP1R12B
|
protein phosphatase 1, regulatory subunit 12B |
| chr11_+_62538775 | 0.29 |
ENST00000294168.3
ENST00000526261.1 |
TAF6L
|
TAF6-like RNA polymerase II, p300/CBP-associated factor (PCAF)-associated factor, 65kDa |
| chr1_-_9189229 | 0.28 |
ENST00000377411.4
|
GPR157
|
G protein-coupled receptor 157 |
| chr9_+_44867571 | 0.28 |
ENST00000377548.2
|
RP11-160N1.10
|
RP11-160N1.10 |
| chr1_-_9189144 | 0.28 |
ENST00000414642.2
|
GPR157
|
G protein-coupled receptor 157 |
| chr6_-_41888843 | 0.28 |
ENST00000434077.1
ENST00000409312.1 |
MED20
|
mediator complex subunit 20 |
| chr11_-_107729504 | 0.28 |
ENST00000265836.7
|
SLC35F2
|
solute carrier family 35, member F2 |
| chr17_-_43487780 | 0.28 |
ENST00000532038.1
ENST00000528677.1 |
ARHGAP27
|
Rho GTPase activating protein 27 |
| chr11_-_107729287 | 0.27 |
ENST00000375682.4
|
SLC35F2
|
solute carrier family 35, member F2 |
| chr17_-_39093672 | 0.27 |
ENST00000209718.3
ENST00000436344.3 ENST00000485751.1 |
KRT23
|
keratin 23 (histone deacetylase inducible) |
| chr20_+_55926583 | 0.26 |
ENST00000395840.2
|
RAE1
|
ribonucleic acid export 1 |
| chr8_+_145065705 | 0.25 |
ENST00000533044.1
|
GRINA
|
glutamate receptor, ionotropic, N-methyl D-aspartate-associated protein 1 (glutamate binding) |
| chr19_-_55691614 | 0.24 |
ENST00000592470.1
ENST00000354308.3 |
SYT5
|
synaptotagmin V |
| chr14_+_91580708 | 0.24 |
ENST00000518868.1
|
C14orf159
|
chromosome 14 open reading frame 159 |
| chr17_-_26733604 | 0.24 |
ENST00000584426.1
ENST00000584995.1 |
SLC46A1
|
solute carrier family 46 (folate transporter), member 1 |
| chr4_+_2813946 | 0.24 |
ENST00000442312.2
|
SH3BP2
|
SH3-domain binding protein 2 |
| chr17_-_39942322 | 0.23 |
ENST00000449889.1
ENST00000465293.1 |
JUP
|
junction plakoglobin |
| chr19_+_34850385 | 0.23 |
ENST00000587521.2
ENST00000587384.1 ENST00000592277.1 |
GPI
|
glucose-6-phosphate isomerase |
| chr4_-_103940791 | 0.22 |
ENST00000510559.1
ENST00000394789.3 ENST00000296422.7 |
SLC9B1
|
solute carrier family 9, subfamily B (NHA1, cation proton antiporter 1), member 1 |
| chr16_-_3306587 | 0.22 |
ENST00000541159.1
ENST00000536379.1 ENST00000219596.1 ENST00000339854.4 |
MEFV
|
Mediterranean fever |
| chr17_+_30813576 | 0.20 |
ENST00000313401.3
|
CDK5R1
|
cyclin-dependent kinase 5, regulatory subunit 1 (p35) |
| chr9_+_114287433 | 0.20 |
ENST00000358151.4
ENST00000355824.3 ENST00000374374.3 ENST00000309235.5 |
ZNF483
|
zinc finger protein 483 |
| chr20_-_30311703 | 0.19 |
ENST00000450273.1
ENST00000456404.1 ENST00000420488.1 ENST00000439267.1 |
BCL2L1
|
BCL2-like 1 |
| chr12_+_14927270 | 0.19 |
ENST00000544848.1
|
H2AFJ
|
H2A histone family, member J |
| chr14_-_65409438 | 0.19 |
ENST00000557049.1
|
GPX2
|
glutathione peroxidase 2 (gastrointestinal) |
| chr1_+_59762642 | 0.18 |
ENST00000371218.4
ENST00000303721.7 |
FGGY
|
FGGY carbohydrate kinase domain containing |
| chr11_-_71781096 | 0.18 |
ENST00000535087.1
ENST00000535838.1 |
NUMA1
|
nuclear mitotic apparatus protein 1 |
| chr14_+_91581011 | 0.18 |
ENST00000523894.1
ENST00000522322.1 ENST00000523771.1 |
C14orf159
|
chromosome 14 open reading frame 159 |
| chr16_+_30773636 | 0.18 |
ENST00000402121.3
ENST00000565995.1 ENST00000563683.1 ENST00000357890.5 ENST00000565931.1 |
RNF40
|
ring finger protein 40, E3 ubiquitin protein ligase |
| chr4_-_38666430 | 0.17 |
ENST00000436901.1
|
AC021860.1
|
Uncharacterized protein |
| chr19_-_13947099 | 0.17 |
ENST00000587762.1
|
MIR24-2
|
microRNA 24-2 |
| chr19_-_55691377 | 0.17 |
ENST00000589172.1
|
SYT5
|
synaptotagmin V |
| chr2_-_136594740 | 0.17 |
ENST00000264162.2
|
LCT
|
lactase |
| chr10_+_94451574 | 0.17 |
ENST00000492654.2
|
HHEX
|
hematopoietically expressed homeobox |
| chr22_+_41956767 | 0.17 |
ENST00000306149.7
|
CSDC2
|
cold shock domain containing C2, RNA binding |
| chr11_-_3147835 | 0.16 |
ENST00000525498.1
|
OSBPL5
|
oxysterol binding protein-like 5 |
| chr17_+_12859080 | 0.16 |
ENST00000583608.1
|
ARHGAP44
|
Rho GTPase activating protein 44 |
| chr7_+_39125365 | 0.15 |
ENST00000559001.1
ENST00000464276.2 |
POU6F2
|
POU class 6 homeobox 2 |
| chr12_+_119616447 | 0.15 |
ENST00000281938.2
|
HSPB8
|
heat shock 22kDa protein 8 |
| chr5_+_52776228 | 0.15 |
ENST00000256759.3
|
FST
|
follistatin |
| chr16_+_618837 | 0.15 |
ENST00000409439.2
|
PIGQ
|
phosphatidylinositol glycan anchor biosynthesis, class Q |
| chr2_-_75788424 | 0.15 |
ENST00000410071.1
|
EVA1A
|
eva-1 homolog A (C. elegans) |
| chr19_-_55691472 | 0.14 |
ENST00000537500.1
|
SYT5
|
synaptotagmin V |
| chr4_-_90759440 | 0.14 |
ENST00000336904.3
|
SNCA
|
synuclein, alpha (non A4 component of amyloid precursor) |
| chrX_-_2847366 | 0.14 |
ENST00000381154.1
|
ARSD
|
arylsulfatase D |
| chr11_-_72145426 | 0.14 |
ENST00000535990.1
ENST00000437826.2 ENST00000340729.5 |
CLPB
|
ClpB caseinolytic peptidase B homolog (E. coli) |
| chr14_+_91580357 | 0.14 |
ENST00000298858.4
ENST00000521081.1 ENST00000520328.1 ENST00000256324.10 ENST00000524232.1 ENST00000522170.1 ENST00000519950.1 ENST00000523879.1 ENST00000521077.2 ENST00000518665.2 |
C14orf159
|
chromosome 14 open reading frame 159 |
| chr12_+_50135351 | 0.13 |
ENST00000549445.1
ENST00000550951.1 ENST00000549385.1 ENST00000548713.1 ENST00000548201.1 |
TMBIM6
|
transmembrane BAX inhibitor motif containing 6 |
| chr20_+_55926274 | 0.13 |
ENST00000371242.2
ENST00000527947.1 |
RAE1
|
ribonucleic acid export 1 |
| chr11_+_46383121 | 0.13 |
ENST00000454345.1
|
DGKZ
|
diacylglycerol kinase, zeta |
| chr12_+_50135327 | 0.13 |
ENST00000549966.1
ENST00000547832.1 ENST00000547187.1 ENST00000548894.1 ENST00000546914.1 ENST00000552699.1 ENST00000267115.5 |
TMBIM6
|
transmembrane BAX inhibitor motif containing 6 |
| chr15_+_22736484 | 0.13 |
ENST00000560659.2
|
GOLGA6L1
|
golgin A6 family-like 1 |
| chr11_+_72983246 | 0.13 |
ENST00000393590.2
|
P2RY6
|
pyrimidinergic receptor P2Y, G-protein coupled, 6 |
| chr6_-_99842041 | 0.13 |
ENST00000254759.3
ENST00000369242.1 |
COQ3
|
coenzyme Q3 methyltransferase |
| chr1_-_9129735 | 0.12 |
ENST00000377424.4
|
SLC2A5
|
solute carrier family 2 (facilitated glucose/fructose transporter), member 5 |
| chr14_+_91580777 | 0.12 |
ENST00000525393.2
ENST00000428926.2 ENST00000517362.1 |
C14orf159
|
chromosome 14 open reading frame 159 |
| chr16_+_30484054 | 0.12 |
ENST00000564118.1
ENST00000454514.2 ENST00000433423.2 |
ITGAL
|
integrin, alpha L (antigen CD11A (p180), lymphocyte function-associated antigen 1; alpha polypeptide) |
| chr19_-_46148820 | 0.12 |
ENST00000587152.1
|
EML2
|
echinoderm microtubule associated protein like 2 |
| chr12_-_110906027 | 0.11 |
ENST00000537466.2
ENST00000550974.1 ENST00000228827.3 |
GPN3
|
GPN-loop GTPase 3 |
| chr3_+_126243126 | 0.11 |
ENST00000319340.2
|
CHST13
|
carbohydrate (chondroitin 4) sulfotransferase 13 |
| chr1_+_209602771 | 0.11 |
ENST00000440276.1
|
MIR205HG
|
MIR205 host gene (non-protein coding) |
| chr19_-_11688500 | 0.11 |
ENST00000433365.2
|
ACP5
|
acid phosphatase 5, tartrate resistant |
| chr19_-_41196458 | 0.11 |
ENST00000598779.1
|
NUMBL
|
numb homolog (Drosophila)-like |
| chr11_+_60869867 | 0.11 |
ENST00000347785.3
|
CD5
|
CD5 molecule |
| chrX_-_48931648 | 0.11 |
ENST00000376386.3
ENST00000376390.4 |
PRAF2
|
PRA1 domain family, member 2 |
| chr17_-_43487741 | 0.10 |
ENST00000455881.1
|
ARHGAP27
|
Rho GTPase activating protein 27 |
| chr12_+_49212514 | 0.10 |
ENST00000301050.2
ENST00000548279.1 ENST00000547230.1 |
CACNB3
|
calcium channel, voltage-dependent, beta 3 subunit |
| chr15_+_22736246 | 0.10 |
ENST00000316397.3
|
GOLGA6L1
|
golgin A6 family-like 1 |
| chr11_+_117070037 | 0.10 |
ENST00000392951.4
ENST00000525531.1 ENST00000278968.6 |
TAGLN
|
transgelin |
| chr15_-_82338460 | 0.09 |
ENST00000558133.1
ENST00000329713.4 |
MEX3B
|
mex-3 RNA binding family member B |
| chr6_+_123038689 | 0.09 |
ENST00000354275.2
ENST00000368446.1 |
PKIB
|
protein kinase (cAMP-dependent, catalytic) inhibitor beta |
| chr8_+_10530133 | 0.09 |
ENST00000304519.5
|
C8orf74
|
chromosome 8 open reading frame 74 |
| chr2_-_220110111 | 0.08 |
ENST00000428427.1
ENST00000356283.3 ENST00000432839.1 ENST00000424620.1 |
GLB1L
|
galactosidase, beta 1-like |
| chr6_+_30850697 | 0.08 |
ENST00000509639.1
ENST00000412274.2 ENST00000507901.1 ENST00000507046.1 ENST00000437124.2 ENST00000454612.2 ENST00000396342.2 |
DDR1
|
discoidin domain receptor tyrosine kinase 1 |
| chr1_-_160832642 | 0.08 |
ENST00000368034.4
|
CD244
|
CD244 molecule, natural killer cell receptor 2B4 |
| chr22_-_36635563 | 0.08 |
ENST00000451256.2
|
APOL2
|
apolipoprotein L, 2 |
| chr12_+_50135588 | 0.08 |
ENST00000423828.1
ENST00000550445.1 |
TMBIM6
|
transmembrane BAX inhibitor motif containing 6 |
| chr4_+_2814011 | 0.08 |
ENST00000502260.1
ENST00000435136.2 |
SH3BP2
|
SH3-domain binding protein 2 |
| chr20_-_23030296 | 0.07 |
ENST00000377103.2
|
THBD
|
thrombomodulin |
| chr18_+_43753974 | 0.07 |
ENST00000282059.6
ENST00000321319.6 |
C18orf25
|
chromosome 18 open reading frame 25 |
| chr17_+_78193443 | 0.06 |
ENST00000577155.1
|
SLC26A11
|
solute carrier family 26 (anion exchanger), member 11 |
| chr3_+_12838161 | 0.06 |
ENST00000456430.2
|
CAND2
|
cullin-associated and neddylation-dissociated 2 (putative) |
| chr10_+_129796390 | 0.06 |
ENST00000455661.1
|
PTPRE
|
protein tyrosine phosphatase, receptor type, E |
| chr6_+_116937636 | 0.06 |
ENST00000368581.4
ENST00000229554.5 ENST00000368580.4 |
RSPH4A
|
radial spoke head 4 homolog A (Chlamydomonas) |
| chr16_+_30483962 | 0.06 |
ENST00000356798.6
|
ITGAL
|
integrin, alpha L (antigen CD11A (p180), lymphocyte function-associated antigen 1; alpha polypeptide) |
| chr14_+_91580732 | 0.06 |
ENST00000519019.1
ENST00000523816.1 ENST00000517518.1 |
C14orf159
|
chromosome 14 open reading frame 159 |
| chr17_-_34195889 | 0.05 |
ENST00000311880.2
|
C17orf66
|
chromosome 17 open reading frame 66 |
| chr18_+_55862622 | 0.05 |
ENST00000456173.2
|
NEDD4L
|
neural precursor cell expressed, developmentally down-regulated 4-like, E3 ubiquitin protein ligase |
| chr15_-_83315874 | 0.05 |
ENST00000569257.1
|
CPEB1
|
cytoplasmic polyadenylation element binding protein 1 |
| chr6_+_27806319 | 0.05 |
ENST00000606613.1
ENST00000396980.3 |
HIST1H2BN
|
histone cluster 1, H2bn |
| chr6_+_30850862 | 0.04 |
ENST00000504651.1
ENST00000512694.1 ENST00000515233.1 |
DDR1
|
discoidin domain receptor tyrosine kinase 1 |
| chr14_+_93389425 | 0.04 |
ENST00000216492.5
ENST00000334654.4 |
CHGA
|
chromogranin A (parathyroid secretory protein 1) |
| chr3_+_69811858 | 0.04 |
ENST00000433517.1
|
MITF
|
microphthalmia-associated transcription factor |
| chr16_-_58328923 | 0.04 |
ENST00000567164.1
ENST00000219301.4 ENST00000569727.1 |
PRSS54
|
protease, serine, 54 |
| chr6_-_133119668 | 0.03 |
ENST00000275227.4
ENST00000538764.1 |
SLC18B1
|
solute carrier family 18, subfamily B, member 1 |
| chr3_+_125687987 | 0.03 |
ENST00000514116.1
ENST00000251776.4 ENST00000504401.1 ENST00000513830.1 ENST00000508088.1 |
ROPN1B
|
rhophilin associated tail protein 1B |
| chr18_+_77623668 | 0.03 |
ENST00000316249.3
|
KCNG2
|
potassium voltage-gated channel, subfamily G, member 2 |
| chr17_-_34195862 | 0.03 |
ENST00000592980.1
ENST00000587626.1 |
C17orf66
|
chromosome 17 open reading frame 66 |
| chr22_-_46644182 | 0.03 |
ENST00000404583.1
ENST00000404744.1 |
CDPF1
|
cysteine-rich, DPF motif domain containing 1 |
| chr4_-_186696425 | 0.02 |
ENST00000430503.1
ENST00000319454.6 ENST00000450341.1 |
SORBS2
|
sorbin and SH3 domain containing 2 |
| chr8_+_38586068 | 0.02 |
ENST00000443286.2
ENST00000520340.1 ENST00000518415.1 |
TACC1
|
transforming, acidic coiled-coil containing protein 1 |
| chr15_-_83316087 | 0.02 |
ENST00000568757.1
|
CPEB1
|
cytoplasmic polyadenylation element binding protein 1 |
| chr1_+_52682052 | 0.02 |
ENST00000371591.1
|
ZFYVE9
|
zinc finger, FYVE domain containing 9 |
| chr5_+_55147205 | 0.02 |
ENST00000396836.2
ENST00000396834.1 ENST00000447346.2 ENST00000359040.5 |
IL31RA
|
interleukin 31 receptor A |
| chr6_-_41888814 | 0.01 |
ENST00000409060.1
ENST00000265350.4 |
MED20
|
mediator complex subunit 20 |
| chr20_-_6103666 | 0.01 |
ENST00000536936.1
|
FERMT1
|
fermitin family member 1 |
| chr12_+_65563329 | 0.01 |
ENST00000308330.2
|
LEMD3
|
LEM domain containing 3 |
| chr8_+_10530155 | 0.01 |
ENST00000521818.1
|
C8orf74
|
chromosome 8 open reading frame 74 |
| chr15_-_23414193 | 0.01 |
ENST00000558241.1
|
RP11-467N20.5
|
Protein LOC440233 |
| chr18_+_13611763 | 0.01 |
ENST00000585931.1
|
LDLRAD4
|
low density lipoprotein receptor class A domain containing 4 |
| chr11_+_35211511 | 0.01 |
ENST00000524922.1
|
CD44
|
CD44 molecule (Indian blood group) |
| chr2_+_220110177 | 0.01 |
ENST00000409638.3
ENST00000396738.2 ENST00000409516.3 |
STK16
|
serine/threonine kinase 16 |
| chr6_-_66417107 | 0.00 |
ENST00000370621.3
ENST00000370618.3 ENST00000503581.1 ENST00000393380.2 |
EYS
|
eyes shut homolog (Drosophila) |
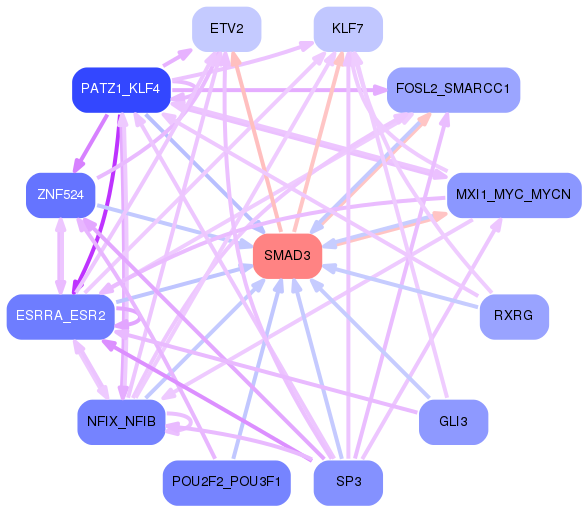
Network of associatons between targets according to the STRING database.

First level regulatory network of SMAD3
Gene Ontology Analysis
Gene overrepresentation in biological_process category:
| Log-likelihood per target | Total log-likelihood | Term | Description |
|---|---|---|---|
| 0.2 | 0.7 | GO:0006154 | adenosine catabolic process(GO:0006154) inosine biosynthetic process(GO:0046103) |
| 0.2 | 0.6 | GO:0060796 | regulation of transcription involved in primary germ layer cell fate commitment(GO:0060796) |
| 0.1 | 1.3 | GO:0006049 | UDP-N-acetylglucosamine catabolic process(GO:0006049) |
| 0.1 | 1.1 | GO:0002227 | innate immune response in mucosa(GO:0002227) |
| 0.1 | 1.6 | GO:0000972 | transcription-dependent tethering of RNA polymerase II gene DNA at nuclear periphery(GO:0000972) |
| 0.1 | 0.2 | GO:1900226 | negative regulation of NLRP3 inflammasome complex assembly(GO:1900226) |
| 0.1 | 0.3 | GO:0061537 | glycine secretion(GO:0061536) glycine secretion, neurotransmission(GO:0061537) |
| 0.1 | 0.9 | GO:1900623 | regulation of monocyte aggregation(GO:1900623) positive regulation of monocyte aggregation(GO:1900625) |
| 0.1 | 0.4 | GO:0090096 | regulation of metanephric cap mesenchymal cell proliferation(GO:0090095) positive regulation of metanephric cap mesenchymal cell proliferation(GO:0090096) |
| 0.1 | 0.2 | GO:0061010 | gall bladder development(GO:0061010) |
| 0.1 | 0.2 | GO:0021718 | superior olivary nucleus development(GO:0021718) superior olivary nucleus maturation(GO:0021722) |
| 0.1 | 0.1 | GO:0010265 | SCF complex assembly(GO:0010265) |
| 0.1 | 0.4 | GO:0000066 | mitochondrial ornithine transport(GO:0000066) |
| 0.1 | 6.6 | GO:0006342 | chromatin silencing(GO:0006342) |
| 0.0 | 0.5 | GO:0051045 | negative regulation of membrane protein ectodomain proteolysis(GO:0051045) |
| 0.0 | 0.3 | GO:1904721 | negative regulation of mRNA cleavage(GO:0031438) negative regulation of mRNA endonucleolytic cleavage involved in unfolded protein response(GO:1904721) |
| 0.0 | 0.6 | GO:0060019 | radial glial cell differentiation(GO:0060019) |
| 0.0 | 0.2 | GO:0019242 | methylglyoxal biosynthetic process(GO:0019242) |
| 0.0 | 0.4 | GO:0045218 | zonula adherens maintenance(GO:0045218) |
| 0.0 | 0.2 | GO:0051958 | methotrexate transport(GO:0051958) |
| 0.0 | 0.4 | GO:0032494 | response to peptidoglycan(GO:0032494) |
| 0.0 | 0.7 | GO:0019371 | cyclooxygenase pathway(GO:0019371) |
| 0.0 | 4.9 | GO:0006334 | nucleosome assembly(GO:0006334) |
| 0.0 | 0.2 | GO:0044245 | polysaccharide digestion(GO:0044245) |
| 0.0 | 0.2 | GO:0071603 | endothelial cell-cell adhesion(GO:0071603) |
| 0.0 | 0.2 | GO:0007402 | ganglion mother cell fate determination(GO:0007402) |
| 0.0 | 0.5 | GO:1903874 | ferrous iron transport(GO:0015684) ferrous iron transmembrane transport(GO:1903874) |
| 0.0 | 0.1 | GO:0051585 | negative regulation of dopamine uptake involved in synaptic transmission(GO:0051585) norepinephrine uptake(GO:0051620) regulation of norepinephrine uptake(GO:0051621) negative regulation of norepinephrine uptake(GO:0051622) negative regulation of catecholamine uptake involved in synaptic transmission(GO:0051945) regulation of glutathione peroxidase activity(GO:1903282) positive regulation of glutathione peroxidase activity(GO:1903284) positive regulation of hydrogen peroxide catabolic process(GO:1903285) positive regulation of peroxidase activity(GO:2000470) |
| 0.0 | 0.1 | GO:0044376 | RNA polymerase II complex import to nucleus(GO:0044376) RNA polymerase III complex localization to nucleus(GO:1990022) |
| 0.0 | 0.1 | GO:0032929 | negative regulation of superoxide anion generation(GO:0032929) |
| 0.0 | 0.1 | GO:0021849 | neuroblast division in subventricular zone(GO:0021849) |
| 0.0 | 0.2 | GO:0098886 | modification of dendritic spine(GO:0098886) |
| 0.0 | 0.1 | GO:0035740 | CD8-positive, alpha-beta T cell proliferation(GO:0035740) regulation of CD8-positive, alpha-beta T cell proliferation(GO:2000564) |
| 0.0 | 0.2 | GO:0060154 | cellular process regulating host cell cycle in response to virus(GO:0060154) |
| 0.0 | 0.3 | GO:0045040 | protein import into mitochondrial outer membrane(GO:0045040) |
| 0.0 | 0.2 | GO:1902846 | regulation of spindle elongation(GO:0032887) regulation of mitotic spindle elongation(GO:0032888) anastral spindle assembly(GO:0055048) protein localization to spindle pole body(GO:0071988) regulation of protein localization to spindle pole body(GO:1902363) positive regulation of protein localization to spindle pole body(GO:1902365) positive regulation of mitotic spindle elongation(GO:1902846) |
| 0.0 | 0.1 | GO:2001168 | regulation of histone H2B ubiquitination(GO:2001166) positive regulation of histone H2B ubiquitination(GO:2001168) |
| 0.0 | 0.3 | GO:0001829 | trophectodermal cell differentiation(GO:0001829) |
| 0.0 | 0.7 | GO:0035635 | entry of bacterium into host cell(GO:0035635) |
| 0.0 | 0.8 | GO:0006363 | termination of RNA polymerase I transcription(GO:0006363) |
| 0.0 | 0.0 | GO:1900738 | dense core granule biogenesis(GO:0061110) positive regulation of phospholipase C-activating G-protein coupled receptor signaling pathway(GO:1900738) positive regulation of relaxation of cardiac muscle(GO:1901899) regulation of dense core granule biogenesis(GO:2000705) |
| 0.0 | 0.3 | GO:0016075 | rRNA catabolic process(GO:0016075) |
| 0.0 | 0.3 | GO:0003334 | keratinocyte development(GO:0003334) |
| 0.0 | 0.2 | GO:0032926 | negative regulation of activin receptor signaling pathway(GO:0032926) |
Gene overrepresentation in cellular_component category:
| Log-likelihood per target | Total log-likelihood | Term | Description |
|---|---|---|---|
| 0.2 | 12.7 | GO:0000786 | nucleosome(GO:0000786) |
| 0.1 | 0.6 | GO:1990769 | proximal neuron projection(GO:1990769) |
| 0.1 | 0.9 | GO:0035692 | macrophage migration inhibitory factor receptor complex(GO:0035692) |
| 0.1 | 0.8 | GO:0000120 | RNA polymerase I transcription factor complex(GO:0000120) |
| 0.1 | 0.2 | GO:0071665 | gamma-catenin-TCF7L2 complex(GO:0071665) |
| 0.1 | 1.1 | GO:0005915 | zonula adherens(GO:0005915) |
| 0.0 | 0.2 | GO:0016533 | cyclin-dependent protein kinase 5 holoenzyme complex(GO:0016533) |
| 0.0 | 1.8 | GO:0097431 | mitotic spindle pole(GO:0097431) |
| 0.0 | 0.3 | GO:0005742 | mitochondrial outer membrane translocase complex(GO:0005742) |
| 0.0 | 0.1 | GO:0001534 | radial spoke(GO:0001534) |
| 0.0 | 0.3 | GO:0030914 | STAGA complex(GO:0030914) |
| 0.0 | 0.1 | GO:0033503 | HULC complex(GO:0033503) |
| 0.0 | 0.2 | GO:0097136 | Bcl-2 family protein complex(GO:0097136) |
| 0.0 | 0.6 | GO:0016592 | mediator complex(GO:0016592) |
Gene overrepresentation in molecular_function category:
| Log-likelihood per target | Total log-likelihood | Term | Description |
|---|---|---|---|
| 0.2 | 0.7 | GO:0004796 | thromboxane-A synthase activity(GO:0004796) 12-hydroxyheptadecatrienoic acid synthase activity(GO:0036134) |
| 0.1 | 1.3 | GO:0003827 | alpha-1,3-mannosylglycoprotein 2-beta-N-acetylglucosaminyltransferase activity(GO:0003827) |
| 0.1 | 0.7 | GO:0047820 | D-glutamate cyclase activity(GO:0047820) |
| 0.1 | 0.3 | GO:0015375 | glycine:sodium symporter activity(GO:0015375) |
| 0.1 | 0.2 | GO:0016534 | cyclin-dependent protein kinase 5 activator activity(GO:0016534) |
| 0.1 | 0.4 | GO:0000064 | L-ornithine transmembrane transporter activity(GO:0000064) |
| 0.1 | 0.2 | GO:0005199 | structural constituent of cell wall(GO:0005199) |
| 0.1 | 0.7 | GO:0004000 | adenosine deaminase activity(GO:0004000) |
| 0.0 | 0.2 | GO:0004347 | glucose-6-phosphate isomerase activity(GO:0004347) |
| 0.0 | 0.5 | GO:0015093 | ferrous iron transmembrane transporter activity(GO:0015093) |
| 0.0 | 0.3 | GO:0060698 | endoribonuclease inhibitor activity(GO:0060698) |
| 0.0 | 0.2 | GO:0008422 | beta-glucosidase activity(GO:0008422) |
| 0.0 | 0.2 | GO:0015350 | methotrexate transporter activity(GO:0015350) |
| 0.0 | 0.5 | GO:0004565 | beta-galactosidase activity(GO:0004565) |
| 0.0 | 0.1 | GO:0060961 | phospholipase D inhibitor activity(GO:0060961) |
| 0.0 | 0.6 | GO:0001163 | RNA polymerase I regulatory region DNA binding(GO:0001013) RNA polymerase I regulatory region sequence-specific DNA binding(GO:0001163) RNA polymerase I CORE element sequence-specific DNA binding(GO:0001164) |
| 0.0 | 0.8 | GO:0001530 | lipopolysaccharide binding(GO:0001530) |
| 0.0 | 0.9 | GO:0005540 | hyaluronic acid binding(GO:0005540) |
| 0.0 | 0.1 | GO:0008169 | C-methyltransferase activity(GO:0008169) |
| 0.0 | 0.1 | GO:0047756 | chondroitin 4-sulfotransferase activity(GO:0047756) |
| 0.0 | 0.1 | GO:0045029 | UDP-activated nucleotide receptor activity(GO:0045029) |
| 0.0 | 0.2 | GO:0008142 | oxysterol binding(GO:0008142) |
| 0.0 | 0.6 | GO:0004602 | glutathione peroxidase activity(GO:0004602) |
| 0.0 | 0.5 | GO:0008191 | metalloendopeptidase inhibitor activity(GO:0008191) |
| 0.0 | 0.3 | GO:0015266 | protein channel activity(GO:0015266) |
| 0.0 | 0.2 | GO:0051434 | BH3 domain binding(GO:0051434) |
| 0.0 | 13.2 | GO:0046982 | protein heterodimerization activity(GO:0046982) |
| 0.0 | 0.4 | GO:0008569 | ATP-dependent microtubule motor activity, minus-end-directed(GO:0008569) |
| 0.0 | 0.2 | GO:0071837 | HMG box domain binding(GO:0071837) |
| 0.0 | 0.4 | GO:0070888 | E-box binding(GO:0070888) |
| 0.0 | 0.1 | GO:0017176 | phosphatidylinositol N-acetylglucosaminyltransferase activity(GO:0017176) |
Gene overrepresentation in C2:CP category:
| Log-likelihood per target | Total log-likelihood | Term | Description |
|---|---|---|---|
| 0.0 | 0.9 | SA MMP CYTOKINE CONNECTION | Cytokines can induce activation of matrix metalloproteinases, which degrade extracellular matrix. |
| 0.0 | 1.6 | PID DELTA NP63 PATHWAY | Validated transcriptional targets of deltaNp63 isoforms |
| 0.0 | 0.9 | PID ECADHERIN KERATINOCYTE PATHWAY | E-cadherin signaling in keratinocytes |
| 0.0 | 1.2 | PID IL6 7 PATHWAY | IL6-mediated signaling events |
Gene overrepresentation in C2:CP:REACTOME category:
| Log-likelihood per target | Total log-likelihood | Term | Description |
|---|---|---|---|
| 0.4 | 24.2 | REACTOME PACKAGING OF TELOMERE ENDS | Genes involved in Packaging Of Telomere Ends |
| 0.0 | 0.9 | REACTOME HYALURONAN UPTAKE AND DEGRADATION | Genes involved in Hyaluronan uptake and degradation |
| 0.0 | 1.6 | REACTOME REGULATION OF GLUCOKINASE BY GLUCOKINASE REGULATORY PROTEIN | Genes involved in Regulation of Glucokinase by Glucokinase Regulatory Protein |
| 0.0 | 0.7 | REACTOME PURINE SALVAGE | Genes involved in Purine salvage |
| 0.0 | 0.8 | REACTOME RNA POL I TRANSCRIPTION TERMINATION | Genes involved in RNA Polymerase I Transcription Termination |
| 0.0 | 0.5 | REACTOME DEGRADATION OF THE EXTRACELLULAR MATRIX | Genes involved in Degradation of the extracellular matrix |
| 0.0 | 1.3 | REACTOME TRANSPORT TO THE GOLGI AND SUBSEQUENT MODIFICATION | Genes involved in Transport to the Golgi and subsequent modification |
| 0.0 | 0.9 | REACTOME ADHERENS JUNCTIONS INTERACTIONS | Genes involved in Adherens junctions interactions |
| 0.0 | 0.2 | REACTOME DIGESTION OF DIETARY CARBOHYDRATE | Genes involved in Digestion of dietary carbohydrate |
| 0.0 | 0.4 | REACTOME INFLAMMASOMES | Genes involved in Inflammasomes |
| 0.0 | 0.6 | REACTOME CYTOCHROME P450 ARRANGED BY SUBSTRATE TYPE | Genes involved in Cytochrome P450 - arranged by substrate type |