Project
A549 cells infected with IAV Analysis Results (GEO series: GSE147507)
Navigation
Downloads
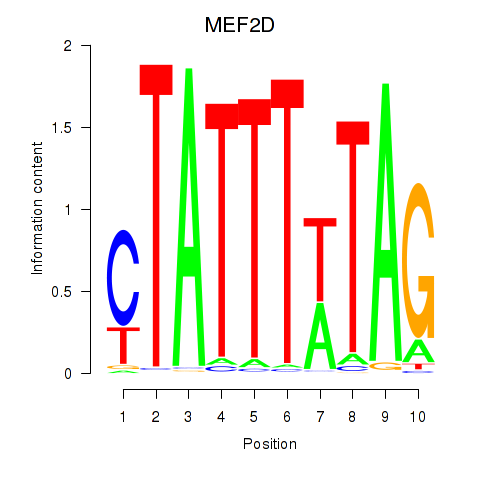
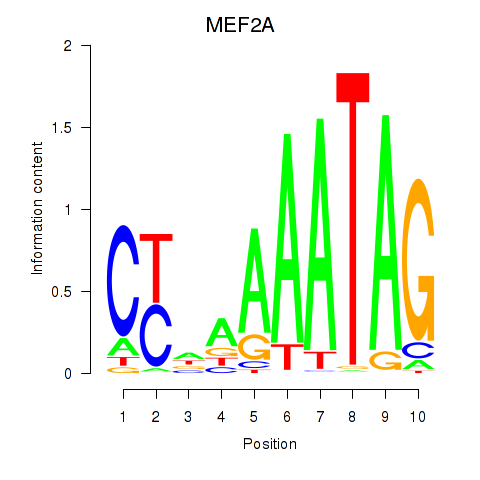
Results for MEF2D_MEF2A
Z-value: 0.85
Motif logo
Transcription factors associated with MEF2D_MEF2A
| Gene Symbol | Gene ID | Gene Info |
|---|---|---|
|
MEF2D
|
ENSG00000116604.13 | myocyte enhancer factor 2D |
|
MEF2A
|
ENSG00000068305.13 | myocyte enhancer factor 2A |
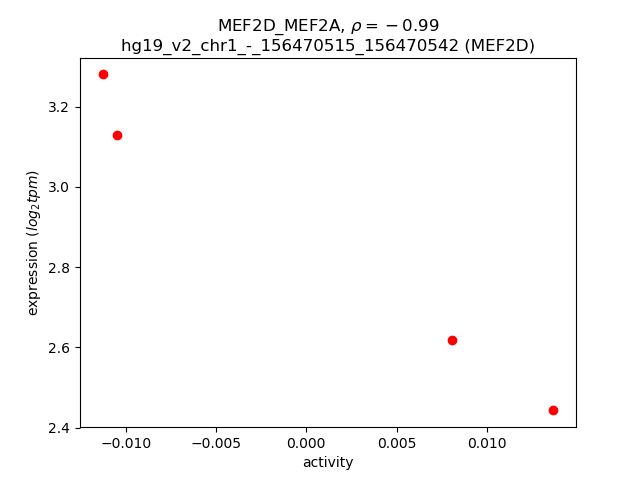
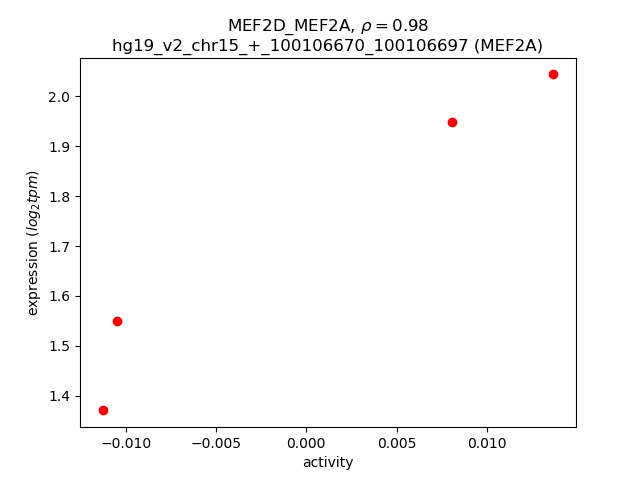
Activity-expression correlation:
| Gene | Promoter | Pearson corr. coef. | P-value | Plot |
|---|---|---|---|---|
| MEF2D | hg19_v2_chr1_-_156470515_156470542 | -0.99 | 8.3e-03 | Click! |
| MEF2A | hg19_v2_chr15_+_100106670_100106697 | 0.98 | 2.2e-02 | Click! |
Activity profile of MEF2D_MEF2A motif
Sorted Z-values of MEF2D_MEF2A motif
| Promoter | Log-likelihood | Transcript | Gene | Gene Info |
|---|---|---|---|---|
| chr17_+_68165657 | 0.49 |
ENST00000243457.3
|
KCNJ2
|
potassium inwardly-rectifying channel, subfamily J, member 2 |
| chr21_+_35107346 | 0.37 |
ENST00000456489.1
|
ITSN1
|
intersectin 1 (SH3 domain protein) |
| chr15_+_100106244 | 0.34 |
ENST00000557942.1
|
MEF2A
|
myocyte enhancer factor 2A |
| chr14_+_56046990 | 0.34 |
ENST00000438792.2
ENST00000395314.3 ENST00000395308.1 |
KTN1
|
kinectin 1 (kinesin receptor) |
| chr8_+_107282368 | 0.32 |
ENST00000521369.2
|
RP11-395G23.3
|
RP11-395G23.3 |
| chr12_-_49393092 | 0.31 |
ENST00000421952.2
|
DDN
|
dendrin |
| chr12_+_54384370 | 0.30 |
ENST00000504315.1
|
HOXC6
|
homeobox C6 |
| chr7_+_143013198 | 0.30 |
ENST00000343257.2
|
CLCN1
|
chloride channel, voltage-sensitive 1 |
| chr1_-_226187013 | 0.29 |
ENST00000272091.7
|
SDE2
|
SDE2 telomere maintenance homolog (S. pombe) |
| chr16_+_31225337 | 0.29 |
ENST00000322122.3
|
TRIM72
|
tripartite motif containing 72 |
| chr4_+_37892682 | 0.28 |
ENST00000508802.1
ENST00000261439.4 ENST00000402522.1 |
TBC1D1
|
TBC1 (tre-2/USP6, BUB2, cdc16) domain family, member 1 |
| chr17_-_48785216 | 0.27 |
ENST00000285243.6
|
ANKRD40
|
ankyrin repeat domain 40 |
| chr4_+_124571409 | 0.26 |
ENST00000514823.1
ENST00000511919.1 ENST00000508111.1 |
RP11-93L9.1
|
long intergenic non-protein coding RNA 1091 |
| chr17_-_42188598 | 0.26 |
ENST00000591714.1
|
HDAC5
|
histone deacetylase 5 |
| chr22_+_32340481 | 0.26 |
ENST00000397492.1
|
YWHAH
|
tyrosine 3-monooxygenase/tryptophan 5-monooxygenase activation protein, eta |
| chr4_-_143767428 | 0.25 |
ENST00000513000.1
ENST00000509777.1 ENST00000503927.1 |
INPP4B
|
inositol polyphosphate-4-phosphatase, type II, 105kDa |
| chr3_+_141106643 | 0.24 |
ENST00000514251.1
|
ZBTB38
|
zinc finger and BTB domain containing 38 |
| chr14_-_62217779 | 0.24 |
ENST00000554254.1
|
HIF1A-AS2
|
HIF1A antisense RNA 2 |
| chr15_+_100106126 | 0.24 |
ENST00000558812.1
ENST00000338042.6 |
MEF2A
|
myocyte enhancer factor 2A |
| chr5_+_138609782 | 0.24 |
ENST00000361059.2
ENST00000514694.1 ENST00000504203.1 ENST00000502929.1 ENST00000394800.2 ENST00000509644.1 ENST00000505016.1 |
MATR3
|
matrin 3 |
| chr1_+_25757376 | 0.24 |
ENST00000399766.3
ENST00000399763.3 ENST00000374343.4 |
TMEM57
|
transmembrane protein 57 |
| chr3_-_108248169 | 0.24 |
ENST00000273353.3
|
MYH15
|
myosin, heavy chain 15 |
| chr1_-_223853425 | 0.23 |
ENST00000366873.2
ENST00000419193.2 |
CAPN8
|
calpain 8 |
| chr12_-_111358372 | 0.22 |
ENST00000548438.1
ENST00000228841.8 |
MYL2
|
myosin, light chain 2, regulatory, cardiac, slow |
| chr14_+_56046914 | 0.22 |
ENST00000413890.2
ENST00000395309.3 ENST00000554567.1 ENST00000555498.1 |
KTN1
|
kinectin 1 (kinesin receptor) |
| chr5_-_137475071 | 0.20 |
ENST00000265191.2
|
NME5
|
NME/NM23 family member 5 |
| chr17_+_7184986 | 0.20 |
ENST00000317370.8
ENST00000571308.1 |
SLC2A4
|
solute carrier family 2 (facilitated glucose transporter), member 4 |
| chr10_-_45474237 | 0.19 |
ENST00000448778.1
ENST00000298295.3 |
C10orf10
|
chromosome 10 open reading frame 10 |
| chr1_-_100643765 | 0.19 |
ENST00000370137.1
ENST00000370138.1 ENST00000342895.3 |
LRRC39
|
leucine rich repeat containing 39 |
| chr1_+_90098606 | 0.19 |
ENST00000370454.4
|
LRRC8C
|
leucine rich repeat containing 8 family, member C |
| chr14_+_39735411 | 0.19 |
ENST00000603904.1
|
RP11-407N17.3
|
cTAGE family member 5 isoform 4 |
| chr17_+_7758374 | 0.18 |
ENST00000301599.6
ENST00000574668.1 |
TMEM88
|
transmembrane protein 88 |
| chr1_-_223853348 | 0.18 |
ENST00000366872.5
|
CAPN8
|
calpain 8 |
| chr22_+_32340447 | 0.18 |
ENST00000248975.5
|
YWHAH
|
tyrosine 3-monooxygenase/tryptophan 5-monooxygenase activation protein, eta |
| chr14_-_103989033 | 0.18 |
ENST00000553878.1
ENST00000557530.1 |
CKB
|
creatine kinase, brain |
| chrX_-_55208866 | 0.18 |
ENST00000545075.1
|
MTRNR2L10
|
MT-RNR2-like 10 |
| chr15_+_80364901 | 0.18 |
ENST00000560228.1
ENST00000559835.1 ENST00000559775.1 ENST00000558688.1 ENST00000560392.1 ENST00000560976.1 ENST00000558272.1 ENST00000558390.1 |
ZFAND6
|
zinc finger, AN1-type domain 6 |
| chr18_+_3252265 | 0.18 |
ENST00000580887.1
ENST00000536605.1 |
MYL12A
|
myosin, light chain 12A, regulatory, non-sarcomeric |
| chr19_-_51220176 | 0.18 |
ENST00000359082.3
ENST00000293441.1 |
SHANK1
|
SH3 and multiple ankyrin repeat domains 1 |
| chr14_-_21493649 | 0.18 |
ENST00000553442.1
ENST00000555869.1 ENST00000556457.1 ENST00000397844.2 ENST00000554415.1 |
NDRG2
|
NDRG family member 2 |
| chr5_-_150521192 | 0.17 |
ENST00000523714.1
ENST00000521749.1 |
ANXA6
|
annexin A6 |
| chr4_-_185303418 | 0.17 |
ENST00000610223.1
ENST00000608785.1 |
RP11-290F5.1
|
RP11-290F5.1 |
| chr17_-_41132088 | 0.16 |
ENST00000591916.1
ENST00000451885.2 ENST00000454303.1 |
PTGES3L
PTGES3L-AARSD1
|
prostaglandin E synthase 3 (cytosolic)-like PTGES3L-AARSD1 readthrough |
| chr3_+_159570722 | 0.16 |
ENST00000482804.1
|
SCHIP1
|
schwannomin interacting protein 1 |
| chr3_+_193853927 | 0.16 |
ENST00000232424.3
|
HES1
|
hes family bHLH transcription factor 1 |
| chr17_-_34524157 | 0.16 |
ENST00000378354.4
ENST00000394484.1 |
CCL3L3
|
chemokine (C-C motif) ligand 3-like 3 |
| chr5_+_66300464 | 0.16 |
ENST00000436277.1
|
MAST4
|
microtubule associated serine/threonine kinase family member 4 |
| chr19_+_45973120 | 0.16 |
ENST00000592811.1
ENST00000586615.1 |
FOSB
|
FBJ murine osteosarcoma viral oncogene homolog B |
| chr12_+_119616447 | 0.16 |
ENST00000281938.2
|
HSPB8
|
heat shock 22kDa protein 8 |
| chr1_-_154164534 | 0.15 |
ENST00000271850.7
ENST00000368530.2 |
TPM3
|
tropomyosin 3 |
| chr1_+_212782012 | 0.15 |
ENST00000341491.4
ENST00000366985.1 |
ATF3
|
activating transcription factor 3 |
| chr1_-_59249732 | 0.15 |
ENST00000371222.2
|
JUN
|
jun proto-oncogene |
| chr1_+_203097407 | 0.15 |
ENST00000367235.1
|
ADORA1
|
adenosine A1 receptor |
| chr9_+_129677123 | 0.15 |
ENST00000373436.1
|
RALGPS1
|
Ral GEF with PH domain and SH3 binding motif 1 |
| chr14_-_21493884 | 0.15 |
ENST00000556974.1
ENST00000554419.1 ENST00000298687.5 ENST00000397858.1 ENST00000360463.3 ENST00000350792.3 ENST00000397847.2 |
NDRG2
|
NDRG family member 2 |
| chr2_+_103378472 | 0.15 |
ENST00000412401.2
|
TMEM182
|
transmembrane protein 182 |
| chr1_-_206945830 | 0.15 |
ENST00000423557.1
|
IL10
|
interleukin 10 |
| chr3_+_36421971 | 0.15 |
ENST00000457375.2
ENST00000434649.1 |
STAC
|
SH3 and cysteine rich domain |
| chr9_+_127054254 | 0.15 |
ENST00000422297.1
|
NEK6
|
NIMA-related kinase 6 |
| chr2_-_148779106 | 0.15 |
ENST00000416719.1
ENST00000264169.2 |
ORC4
|
origin recognition complex, subunit 4 |
| chr11_+_65266507 | 0.14 |
ENST00000544868.1
|
MALAT1
|
metastasis associated lung adenocarcinoma transcript 1 (non-protein coding) |
| chr8_+_107282389 | 0.14 |
ENST00000577661.1
ENST00000445937.1 |
RP11-395G23.3
OXR1
|
RP11-395G23.3 oxidation resistance 1 |
| chr1_+_26348259 | 0.14 |
ENST00000374280.3
|
EXTL1
|
exostosin-like glycosyltransferase 1 |
| chr3_-_39234074 | 0.14 |
ENST00000340369.3
ENST00000421646.1 ENST00000396251.1 |
XIRP1
|
xin actin-binding repeat containing 1 |
| chr12_-_131200810 | 0.14 |
ENST00000536002.1
ENST00000544034.1 |
RIMBP2
RP11-662M24.2
|
RIMS binding protein 2 RP11-662M24.2 |
| chr8_-_62602327 | 0.14 |
ENST00000445642.3
ENST00000517847.2 ENST00000389204.4 ENST00000517661.1 ENST00000517903.1 ENST00000522603.1 ENST00000522349.1 ENST00000522835.1 ENST00000541428.1 ENST00000518306.1 |
ASPH
|
aspartate beta-hydroxylase |
| chr11_-_47400062 | 0.14 |
ENST00000533030.1
|
SPI1
|
spleen focus forming virus (SFFV) proviral integration oncogene |
| chr16_+_30075595 | 0.14 |
ENST00000563060.2
|
ALDOA
|
aldolase A, fructose-bisphosphate |
| chr7_+_18535321 | 0.14 |
ENST00000413380.1
ENST00000430454.1 |
HDAC9
|
histone deacetylase 9 |
| chr15_+_100106155 | 0.14 |
ENST00000557785.1
ENST00000558049.1 ENST00000449277.2 |
MEF2A
|
myocyte enhancer factor 2A |
| chr12_-_68845165 | 0.13 |
ENST00000360485.3
ENST00000441255.2 |
RP11-81H14.2
|
RP11-81H14.2 |
| chr14_+_76776957 | 0.13 |
ENST00000512784.1
|
ESRRB
|
estrogen-related receptor beta |
| chr1_+_145525015 | 0.13 |
ENST00000539363.1
ENST00000538811.1 |
ITGA10
|
integrin, alpha 10 |
| chr9_-_130639997 | 0.13 |
ENST00000373176.1
|
AK1
|
adenylate kinase 1 |
| chr2_-_165424973 | 0.13 |
ENST00000543549.1
|
GRB14
|
growth factor receptor-bound protein 14 |
| chr1_+_151129135 | 0.13 |
ENST00000602841.1
|
SCNM1
|
sodium channel modifier 1 |
| chr11_+_3666335 | 0.13 |
ENST00000250693.1
|
ART1
|
ADP-ribosyltransferase 1 |
| chr12_-_57644952 | 0.13 |
ENST00000554578.1
ENST00000546246.2 ENST00000553489.1 ENST00000332782.2 |
STAC3
|
SH3 and cysteine rich domain 3 |
| chr13_-_50367057 | 0.13 |
ENST00000261667.3
|
KPNA3
|
karyopherin alpha 3 (importin alpha 4) |
| chr1_+_160051319 | 0.13 |
ENST00000368088.3
|
KCNJ9
|
potassium inwardly-rectifying channel, subfamily J, member 9 |
| chr9_-_16728161 | 0.13 |
ENST00000603713.1
ENST00000603313.1 |
BNC2
|
basonuclin 2 |
| chr18_-_35145728 | 0.12 |
ENST00000361795.5
ENST00000603232.1 |
CELF4
|
CUGBP, Elav-like family member 4 |
| chr10_+_23728198 | 0.12 |
ENST00000376495.3
|
OTUD1
|
OTU domain containing 1 |
| chr3_-_4927447 | 0.12 |
ENST00000449914.1
|
AC018816.3
|
Uncharacterized protein |
| chr1_+_24018269 | 0.12 |
ENST00000374550.3
|
RPL11
|
ribosomal protein L11 |
| chr16_+_30075783 | 0.12 |
ENST00000412304.2
|
ALDOA
|
aldolase A, fructose-bisphosphate |
| chrX_-_142722897 | 0.12 |
ENST00000338017.4
|
SLITRK4
|
SLIT and NTRK-like family, member 4 |
| chr17_+_27369918 | 0.12 |
ENST00000323372.4
|
PIPOX
|
pipecolic acid oxidase |
| chr2_-_148778323 | 0.12 |
ENST00000440042.1
ENST00000535373.1 ENST00000540442.1 ENST00000536575.1 |
ORC4
|
origin recognition complex, subunit 4 |
| chr10_+_86184676 | 0.12 |
ENST00000543283.1
|
CCSER2
|
coiled-coil serine-rich protein 2 |
| chr3_+_121311966 | 0.12 |
ENST00000338040.4
|
FBXO40
|
F-box protein 40 |
| chr12_+_110562135 | 0.12 |
ENST00000361948.4
ENST00000552912.1 ENST00000242591.5 ENST00000546374.1 |
IFT81
|
intraflagellar transport 81 homolog (Chlamydomonas) |
| chr6_+_123038689 | 0.12 |
ENST00000354275.2
ENST00000368446.1 |
PKIB
|
protein kinase (cAMP-dependent, catalytic) inhibitor beta |
| chr16_+_15737124 | 0.12 |
ENST00000396355.1
ENST00000396353.2 |
NDE1
|
nudE neurodevelopment protein 1 |
| chr8_-_17533838 | 0.12 |
ENST00000400046.1
|
MTUS1
|
microtubule associated tumor suppressor 1 |
| chr15_+_59730348 | 0.12 |
ENST00000288228.5
ENST00000559628.1 ENST00000557914.1 ENST00000560474.1 |
FAM81A
|
family with sequence similarity 81, member A |
| chr12_-_16760195 | 0.12 |
ENST00000546281.1
ENST00000537757.1 |
LMO3
|
LIM domain only 3 (rhombotin-like 2) |
| chr3_+_141106458 | 0.12 |
ENST00000509883.1
|
ZBTB38
|
zinc finger and BTB domain containing 38 |
| chr1_-_117753540 | 0.11 |
ENST00000328189.3
ENST00000369458.3 |
VTCN1
|
V-set domain containing T cell activation inhibitor 1 |
| chr10_+_50507232 | 0.11 |
ENST00000374144.3
|
C10orf71
|
chromosome 10 open reading frame 71 |
| chr9_+_5450503 | 0.11 |
ENST00000381573.4
ENST00000381577.3 |
CD274
|
CD274 molecule |
| chr8_+_1993173 | 0.11 |
ENST00000523438.1
|
MYOM2
|
myomesin 2 |
| chr22_-_40929812 | 0.11 |
ENST00000422851.1
|
MKL1
|
megakaryoblastic leukemia (translocation) 1 |
| chr5_-_111091948 | 0.11 |
ENST00000447165.2
|
NREP
|
neuronal regeneration related protein |
| chr20_+_61147651 | 0.11 |
ENST00000370527.3
ENST00000370524.2 |
C20orf166
|
chromosome 20 open reading frame 166 |
| chr3_-_27498235 | 0.11 |
ENST00000295736.5
ENST00000428386.1 ENST00000428179.1 |
SLC4A7
|
solute carrier family 4, sodium bicarbonate cotransporter, member 7 |
| chr1_+_68150744 | 0.11 |
ENST00000370986.4
ENST00000370985.3 |
GADD45A
|
growth arrest and DNA-damage-inducible, alpha |
| chr8_+_76452097 | 0.11 |
ENST00000396423.2
|
HNF4G
|
hepatocyte nuclear factor 4, gamma |
| chr3_-_192445289 | 0.11 |
ENST00000430714.1
ENST00000418610.1 ENST00000448795.1 ENST00000445105.2 |
FGF12
|
fibroblast growth factor 12 |
| chr8_-_73793975 | 0.11 |
ENST00000523881.1
|
RP11-1145L24.1
|
RP11-1145L24.1 |
| chr7_+_152456829 | 0.11 |
ENST00000377776.3
ENST00000256001.8 ENST00000397282.2 |
ACTR3B
|
ARP3 actin-related protein 3 homolog B (yeast) |
| chr12_-_45269430 | 0.11 |
ENST00000395487.2
|
NELL2
|
NEL-like 2 (chicken) |
| chr1_-_150693318 | 0.11 |
ENST00000442853.1
ENST00000368995.4 ENST00000368993.2 ENST00000361824.2 ENST00000322343.7 |
HORMAD1
|
HORMA domain containing 1 |
| chr12_-_49581152 | 0.11 |
ENST00000550811.1
|
TUBA1A
|
tubulin, alpha 1a |
| chr1_+_156096336 | 0.10 |
ENST00000504687.1
ENST00000473598.2 |
LMNA
|
lamin A/C |
| chr5_+_96077888 | 0.10 |
ENST00000509259.1
ENST00000503828.1 |
CAST
|
calpastatin |
| chrX_+_18725758 | 0.10 |
ENST00000472826.1
ENST00000544635.1 ENST00000496075.2 |
PPEF1
|
protein phosphatase, EF-hand calcium binding domain 1 |
| chr13_-_103346854 | 0.10 |
ENST00000267273.6
|
METTL21C
|
methyltransferase like 21C |
| chr4_-_83280767 | 0.10 |
ENST00000514671.1
|
HNRNPD
|
heterogeneous nuclear ribonucleoprotein D (AU-rich element RNA binding protein 1, 37kDa) |
| chr21_+_17909594 | 0.10 |
ENST00000441820.1
ENST00000602280.1 |
LINC00478
|
long intergenic non-protein coding RNA 478 |
| chr10_+_88428206 | 0.10 |
ENST00000429277.2
ENST00000458213.2 ENST00000352360.5 |
LDB3
|
LIM domain binding 3 |
| chr2_-_148778258 | 0.10 |
ENST00000392857.5
ENST00000457954.1 ENST00000392858.1 ENST00000542387.1 |
ORC4
|
origin recognition complex, subunit 4 |
| chr11_+_77774897 | 0.10 |
ENST00000281030.2
|
THRSP
|
thyroid hormone responsive |
| chr7_-_35013217 | 0.10 |
ENST00000446375.1
|
DPY19L1
|
dpy-19-like 1 (C. elegans) |
| chr7_-_30739661 | 0.10 |
ENST00000445981.1
ENST00000348438.4 |
CRHR2
|
corticotropin releasing hormone receptor 2 |
| chr7_-_151217166 | 0.10 |
ENST00000496004.1
|
RHEB
|
Ras homolog enriched in brain |
| chr17_-_49021974 | 0.10 |
ENST00000501718.2
|
RP11-700H6.1
|
RP11-700H6.1 |
| chr3_+_127634312 | 0.10 |
ENST00000407609.3
|
KBTBD12
|
kelch repeat and BTB (POZ) domain containing 12 |
| chr2_-_10588630 | 0.10 |
ENST00000234111.4
|
ODC1
|
ornithine decarboxylase 1 |
| chr3_+_127634069 | 0.10 |
ENST00000405109.1
|
KBTBD12
|
kelch repeat and BTB (POZ) domain containing 12 |
| chrX_+_70521584 | 0.09 |
ENST00000373829.3
ENST00000538820.1 |
ITGB1BP2
|
integrin beta 1 binding protein (melusin) 2 |
| chr3_-_145878954 | 0.09 |
ENST00000282903.5
ENST00000360060.3 |
PLOD2
|
procollagen-lysine, 2-oxoglutarate 5-dioxygenase 2 |
| chr11_-_62457371 | 0.09 |
ENST00000317449.4
|
LRRN4CL
|
LRRN4 C-terminal like |
| chr6_+_132129151 | 0.09 |
ENST00000360971.2
|
ENPP1
|
ectonucleotide pyrophosphatase/phosphodiesterase 1 |
| chr9_+_100263912 | 0.09 |
ENST00000259365.4
|
TMOD1
|
tropomodulin 1 |
| chr14_+_56078695 | 0.09 |
ENST00000416613.1
|
KTN1
|
kinectin 1 (kinesin receptor) |
| chr4_+_95373037 | 0.09 |
ENST00000359265.4
ENST00000437932.1 ENST00000380180.3 ENST00000318007.5 ENST00000450793.1 ENST00000538141.1 ENST00000317968.4 ENST00000512274.1 ENST00000503974.1 ENST00000504489.1 ENST00000542407.1 |
PDLIM5
|
PDZ and LIM domain 5 |
| chr1_-_150693305 | 0.09 |
ENST00000368987.1
|
HORMAD1
|
HORMA domain containing 1 |
| chr15_+_40531243 | 0.09 |
ENST00000558055.1
ENST00000455577.2 |
PAK6
|
p21 protein (Cdc42/Rac)-activated kinase 6 |
| chr2_-_151344172 | 0.09 |
ENST00000375734.2
ENST00000263895.4 ENST00000454202.1 |
RND3
|
Rho family GTPase 3 |
| chr8_-_74659693 | 0.09 |
ENST00000518767.1
|
STAU2
|
staufen double-stranded RNA binding protein 2 |
| chr15_-_99057551 | 0.09 |
ENST00000558256.1
|
FAM169B
|
family with sequence similarity 169, member B |
| chr8_-_70745575 | 0.09 |
ENST00000524945.1
|
SLCO5A1
|
solute carrier organic anion transporter family, member 5A1 |
| chr11_+_7598239 | 0.09 |
ENST00000525597.1
|
PPFIBP2
|
PTPRF interacting protein, binding protein 2 (liprin beta 2) |
| chr3_+_69928256 | 0.09 |
ENST00000394355.2
|
MITF
|
microphthalmia-associated transcription factor |
| chr1_+_145524891 | 0.08 |
ENST00000369304.3
|
ITGA10
|
integrin, alpha 10 |
| chr22_-_31328881 | 0.08 |
ENST00000445980.1
|
MORC2
|
MORC family CW-type zinc finger 2 |
| chr5_-_159546396 | 0.08 |
ENST00000523662.1
ENST00000456329.3 ENST00000307063.7 |
PWWP2A
|
PWWP domain containing 2A |
| chr2_-_106054952 | 0.08 |
ENST00000336660.5
ENST00000393352.3 ENST00000607522.1 |
FHL2
|
four and a half LIM domains 2 |
| chr15_+_78830023 | 0.08 |
ENST00000599596.1
|
AC027228.1
|
HCG2005369; Uncharacterized protein |
| chr10_+_50507181 | 0.08 |
ENST00000323868.4
|
C10orf71
|
chromosome 10 open reading frame 71 |
| chr2_-_31637560 | 0.08 |
ENST00000379416.3
|
XDH
|
xanthine dehydrogenase |
| chr18_-_64271316 | 0.08 |
ENST00000540086.1
ENST00000580157.1 |
CDH19
|
cadherin 19, type 2 |
| chr13_+_76334498 | 0.08 |
ENST00000534657.1
|
LMO7
|
LIM domain 7 |
| chr10_+_14880157 | 0.08 |
ENST00000378372.3
|
HSPA14
|
heat shock 70kDa protein 14 |
| chr13_+_76210448 | 0.08 |
ENST00000377499.5
|
LMO7
|
LIM domain 7 |
| chr8_+_74903580 | 0.08 |
ENST00000284818.2
ENST00000518893.1 |
LY96
|
lymphocyte antigen 96 |
| chr7_-_37488547 | 0.08 |
ENST00000453399.1
|
ELMO1
|
engulfment and cell motility 1 |
| chr13_+_76334567 | 0.08 |
ENST00000321797.8
|
LMO7
|
LIM domain 7 |
| chr12_-_48111295 | 0.08 |
ENST00000542202.1
|
ENDOU
|
endonuclease, polyU-specific |
| chr1_-_159825137 | 0.08 |
ENST00000368102.1
|
C1orf204
|
chromosome 1 open reading frame 204 |
| chr1_+_150254936 | 0.08 |
ENST00000447007.1
ENST00000369095.1 ENST00000369094.1 |
C1orf51
|
chromosome 1 open reading frame 51 |
| chr1_-_201390846 | 0.08 |
ENST00000367312.1
ENST00000555340.2 ENST00000361379.4 |
TNNI1
|
troponin I type 1 (skeletal, slow) |
| chr8_+_27631903 | 0.08 |
ENST00000305188.8
|
ESCO2
|
establishment of sister chromatid cohesion N-acetyltransferase 2 |
| chr18_+_9708162 | 0.08 |
ENST00000578921.1
|
RAB31
|
RAB31, member RAS oncogene family |
| chrX_+_119384607 | 0.08 |
ENST00000326624.2
ENST00000557385.1 |
ZBTB33
|
zinc finger and BTB domain containing 33 |
| chr13_+_76334795 | 0.08 |
ENST00000526202.1
ENST00000465261.2 |
LMO7
|
LIM domain 7 |
| chr14_-_89021077 | 0.08 |
ENST00000556564.1
|
PTPN21
|
protein tyrosine phosphatase, non-receptor type 21 |
| chr3_-_176914238 | 0.08 |
ENST00000430069.1
ENST00000428970.1 |
TBL1XR1
|
transducin (beta)-like 1 X-linked receptor 1 |
| chr4_-_76823681 | 0.08 |
ENST00000286719.7
|
PPEF2
|
protein phosphatase, EF-hand calcium binding domain 2 |
| chr4_+_160025300 | 0.08 |
ENST00000505478.1
|
RAPGEF2
|
Rap guanine nucleotide exchange factor (GEF) 2 |
| chr15_+_40531621 | 0.07 |
ENST00000560346.1
|
PAK6
|
p21 protein (Cdc42/Rac)-activated kinase 6 |
| chr15_-_83474806 | 0.07 |
ENST00000541889.1
ENST00000334574.8 ENST00000561368.1 |
FSD2
|
fibronectin type III and SPRY domain containing 2 |
| chr2_+_113403434 | 0.07 |
ENST00000272542.3
|
SLC20A1
|
solute carrier family 20 (phosphate transporter), member 1 |
| chr1_+_150245099 | 0.07 |
ENST00000369099.3
|
C1orf54
|
chromosome 1 open reading frame 54 |
| chr22_-_51017084 | 0.07 |
ENST00000360719.2
ENST00000457250.1 ENST00000440709.1 |
CPT1B
|
carnitine palmitoyltransferase 1B (muscle) |
| chr10_+_88428370 | 0.07 |
ENST00000372066.3
ENST00000263066.6 ENST00000372056.4 ENST00000310944.6 ENST00000361373.4 ENST00000542786.1 |
LDB3
|
LIM domain binding 3 |
| chr16_-_15736953 | 0.07 |
ENST00000548025.1
ENST00000551742.1 ENST00000602337.1 ENST00000344181.3 ENST00000396368.3 |
KIAA0430
|
KIAA0430 |
| chr1_+_84630645 | 0.07 |
ENST00000394839.2
|
PRKACB
|
protein kinase, cAMP-dependent, catalytic, beta |
| chr7_-_151217001 | 0.07 |
ENST00000262187.5
|
RHEB
|
Ras homolog enriched in brain |
| chr3_-_148939835 | 0.07 |
ENST00000264613.6
|
CP
|
ceruloplasmin (ferroxidase) |
| chr9_+_70971815 | 0.07 |
ENST00000396392.1
ENST00000396396.1 |
PGM5
|
phosphoglucomutase 5 |
| chr7_+_152456904 | 0.07 |
ENST00000537264.1
|
ACTR3B
|
ARP3 actin-related protein 3 homolog B (yeast) |
| chr22_+_41487711 | 0.07 |
ENST00000263253.7
|
EP300
|
E1A binding protein p300 |
| chr2_-_157198860 | 0.07 |
ENST00000409572.1
|
NR4A2
|
nuclear receptor subfamily 4, group A, member 2 |
| chr14_-_102704783 | 0.07 |
ENST00000522534.1
|
MOK
|
MOK protein kinase |
| chr2_+_44502597 | 0.07 |
ENST00000260649.6
ENST00000409387.1 |
SLC3A1
|
solute carrier family 3 (amino acid transporter heavy chain), member 1 |
| chr11_-_47399942 | 0.07 |
ENST00000227163.4
|
SPI1
|
spleen focus forming virus (SFFV) proviral integration oncogene |
| chr22_-_51016846 | 0.07 |
ENST00000312108.7
ENST00000395650.2 |
CPT1B
|
carnitine palmitoyltransferase 1B (muscle) |
| chr20_-_14318248 | 0.07 |
ENST00000378053.3
ENST00000341420.4 |
FLRT3
|
fibronectin leucine rich transmembrane protein 3 |
| chr3_-_52486841 | 0.07 |
ENST00000496590.1
|
TNNC1
|
troponin C type 1 (slow) |
| chr4_+_160203650 | 0.07 |
ENST00000514565.1
|
RAPGEF2
|
Rap guanine nucleotide exchange factor (GEF) 2 |
| chr8_+_67039131 | 0.07 |
ENST00000315962.4
ENST00000353317.5 |
TRIM55
|
tripartite motif containing 55 |
| chr17_-_48277552 | 0.07 |
ENST00000507689.1
|
COL1A1
|
collagen, type I, alpha 1 |
| chr12_+_44229846 | 0.07 |
ENST00000551577.1
ENST00000266534.3 |
TMEM117
|
transmembrane protein 117 |
| chr10_+_71561649 | 0.07 |
ENST00000398978.3
ENST00000354547.3 ENST00000357811.3 |
COL13A1
|
collagen, type XIII, alpha 1 |
| chr14_+_100150622 | 0.07 |
ENST00000261835.3
|
CYP46A1
|
cytochrome P450, family 46, subfamily A, polypeptide 1 |
| chr1_+_160085501 | 0.07 |
ENST00000361216.3
|
ATP1A2
|
ATPase, Na+/K+ transporting, alpha 2 polypeptide |
| chr3_+_69812877 | 0.07 |
ENST00000457080.1
ENST00000328528.6 |
MITF
|
microphthalmia-associated transcription factor |
| chr3_+_113616317 | 0.06 |
ENST00000440446.2
ENST00000488680.1 |
GRAMD1C
|
GRAM domain containing 1C |
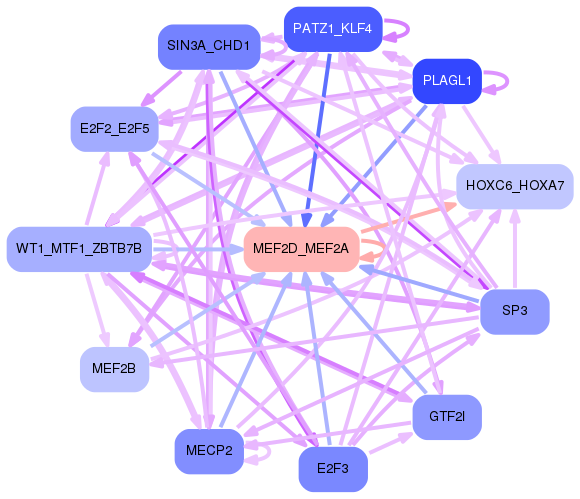
Network of associatons between targets according to the STRING database.

First level regulatory network of MEF2D_MEF2A
Gene Ontology Analysis
Gene overrepresentation in biological_process category:
| Log-likelihood per target | Total log-likelihood | Term | Description |
|---|---|---|---|
| 0.1 | 0.1 | GO:0051098 | regulation of protein binding(GO:0043393) regulation of binding(GO:0051098) |
| 0.1 | 0.5 | GO:0090076 | relaxation of skeletal muscle(GO:0090076) |
| 0.1 | 0.7 | GO:0055005 | ventricular cardiac myofibril assembly(GO:0055005) |
| 0.1 | 0.3 | GO:0044026 | DNA hypermethylation(GO:0044026) hypermethylation of CpG island(GO:0044027) |
| 0.1 | 0.2 | GO:0042138 | meiotic DNA double-strand break formation(GO:0042138) regulation of homologous chromosome segregation(GO:0060629) |
| 0.1 | 0.2 | GO:0060164 | negative regulation of auditory receptor cell differentiation(GO:0045608) negative regulation of mechanoreceptor differentiation(GO:0045632) regulation of timing of neuron differentiation(GO:0060164) negative regulation of inner ear receptor cell differentiation(GO:2000981) |
| 0.1 | 0.2 | GO:0061394 | regulation of transcription from RNA polymerase II promoter in response to arsenic-containing substance(GO:0061394) |
| 0.1 | 0.2 | GO:0032242 | regulation of nucleoside transport(GO:0032242) |
| 0.0 | 0.1 | GO:0002439 | chronic inflammatory response to antigenic stimulus(GO:0002439) |
| 0.0 | 0.1 | GO:1903280 | negative regulation of calcium:sodium antiporter activity(GO:1903280) |
| 0.0 | 0.2 | GO:0030644 | cellular chloride ion homeostasis(GO:0030644) |
| 0.0 | 0.1 | GO:0042264 | peptidyl-aspartic acid hydroxylation(GO:0042264) |
| 0.0 | 0.1 | GO:1904586 | response to putrescine(GO:1904585) cellular response to putrescine(GO:1904586) hepatocyte dedifferentiation(GO:1990828) |
| 0.0 | 0.3 | GO:0043569 | negative regulation of insulin-like growth factor receptor signaling pathway(GO:0043569) |
| 0.0 | 0.1 | GO:0060382 | regulation of DNA strand elongation(GO:0060382) |
| 0.0 | 0.1 | GO:0030505 | inorganic diphosphate transport(GO:0030505) |
| 0.0 | 0.1 | GO:2000434 | regulation of protein neddylation(GO:2000434) negative regulation of protein neddylation(GO:2000435) |
| 0.0 | 0.1 | GO:0000117 | regulation of transcription involved in G2/M transition of mitotic cell cycle(GO:0000117) |
| 0.0 | 0.2 | GO:0035026 | leading edge cell differentiation(GO:0035026) |
| 0.0 | 0.1 | GO:0035105 | sterol regulatory element binding protein import into nucleus(GO:0035105) |
| 0.0 | 0.2 | GO:0050893 | sensory processing(GO:0050893) |
| 0.0 | 0.1 | GO:0046947 | hydroxylysine metabolic process(GO:0046946) hydroxylysine biosynthetic process(GO:0046947) |
| 0.0 | 0.1 | GO:0051866 | general adaptation syndrome(GO:0051866) |
| 0.0 | 0.6 | GO:0050774 | negative regulation of dendrite morphogenesis(GO:0050774) |
| 0.0 | 0.4 | GO:0090360 | platelet-derived growth factor production(GO:0090360) regulation of platelet-derived growth factor production(GO:0090361) |
| 0.0 | 0.2 | GO:0002074 | extraocular skeletal muscle development(GO:0002074) |
| 0.0 | 0.1 | GO:0044691 | tooth eruption(GO:0044691) |
| 0.0 | 0.1 | GO:1905053 | regulation of base-excision repair(GO:1905051) positive regulation of base-excision repair(GO:1905053) |
| 0.0 | 0.1 | GO:0002188 | translation reinitiation(GO:0002188) |
| 0.0 | 0.1 | GO:0046110 | xanthine metabolic process(GO:0046110) |
| 0.0 | 0.2 | GO:0098735 | positive regulation of the force of heart contraction(GO:0098735) |
| 0.0 | 0.1 | GO:1903216 | negative regulation of late endosome to lysosome transport(GO:1902823) regulation of protein processing involved in protein targeting to mitochondrion(GO:1903216) negative regulation of protein processing involved in protein targeting to mitochondrion(GO:1903217) |
| 0.0 | 0.1 | GO:1900042 | positive regulation of interleukin-2 secretion(GO:1900042) |
| 0.0 | 0.1 | GO:0006059 | hexitol metabolic process(GO:0006059) |
| 0.0 | 0.1 | GO:0032484 | Ral protein signal transduction(GO:0032484) regulation of Ral protein signal transduction(GO:0032485) |
| 0.0 | 0.3 | GO:0098870 | neuronal action potential propagation(GO:0019227) action potential propagation(GO:0098870) |
| 0.0 | 0.2 | GO:1902866 | regulation of retina development in camera-type eye(GO:1902866) |
| 0.0 | 0.1 | GO:0018076 | N-terminal peptidyl-lysine acetylation(GO:0018076) |
| 0.0 | 0.1 | GO:0019474 | L-lysine catabolic process to acetyl-CoA(GO:0019474) L-lysine catabolic process(GO:0019477) L-lysine metabolic process(GO:0046440) |
| 0.0 | 0.1 | GO:0046013 | regulation of T cell homeostatic proliferation(GO:0046013) |
| 0.0 | 0.1 | GO:0032971 | regulation of muscle filament sliding(GO:0032971) |
| 0.0 | 0.1 | GO:0055014 | atrial cardiac muscle cell differentiation(GO:0055011) atrial cardiac muscle cell development(GO:0055014) |
| 0.0 | 0.1 | GO:0051083 | 'de novo' cotranslational protein folding(GO:0051083) |
| 0.0 | 0.1 | GO:0010735 | positive regulation of transcription via serum response element binding(GO:0010735) |
| 0.0 | 0.1 | GO:0032497 | detection of lipopolysaccharide(GO:0032497) |
| 0.0 | 0.1 | GO:0033387 | putrescine biosynthetic process from ornithine(GO:0033387) |
| 0.0 | 0.2 | GO:0070050 | neuron cellular homeostasis(GO:0070050) |
| 0.0 | 0.2 | GO:2000074 | regulation of type B pancreatic cell development(GO:2000074) |
| 0.0 | 0.0 | GO:1904404 | cellular response to vitamin B1(GO:0071301) response to formaldehyde(GO:1904404) |
| 0.0 | 0.2 | GO:0030388 | fructose 1,6-bisphosphate metabolic process(GO:0030388) |
| 0.0 | 0.1 | GO:0010961 | cellular magnesium ion homeostasis(GO:0010961) |
| 0.0 | 0.1 | GO:1905150 | regulation of voltage-gated sodium channel activity(GO:1905150) |
| 0.0 | 0.1 | GO:0032468 | Golgi calcium ion homeostasis(GO:0032468) |
| 0.0 | 0.2 | GO:0006228 | UTP biosynthetic process(GO:0006228) |
| 0.0 | 0.1 | GO:0034421 | post-translational protein acetylation(GO:0034421) |
| 0.0 | 0.0 | GO:0071288 | nitric oxide transport(GO:0030185) carbon dioxide transmembrane transport(GO:0035378) cellular response to mercury ion(GO:0071288) |
| 0.0 | 0.1 | GO:0010731 | protein glutathionylation(GO:0010731) regulation of protein glutathionylation(GO:0010732) negative regulation of protein glutathionylation(GO:0010734) |
| 0.0 | 0.1 | GO:0055009 | atrial cardiac muscle tissue development(GO:0003228) atrial cardiac muscle tissue morphogenesis(GO:0055009) |
| 0.0 | 0.1 | GO:0070779 | D-aspartate transport(GO:0070777) D-aspartate import(GO:0070779) |
| 0.0 | 0.1 | GO:0051694 | pointed-end actin filament capping(GO:0051694) |
Gene overrepresentation in cellular_component category:
| Log-likelihood per target | Total log-likelihood | Term | Description |
|---|---|---|---|
| 0.1 | 0.2 | GO:1990622 | CHOP-ATF3 complex(GO:1990622) |
| 0.0 | 0.2 | GO:0030936 | collagen type XIII trimer(GO:0005600) transmembrane collagen trimer(GO:0030936) |
| 0.0 | 0.2 | GO:0034680 | integrin alpha10-beta1 complex(GO:0034680) |
| 0.0 | 0.1 | GO:1990584 | cardiac Troponin complex(GO:1990584) |
| 0.0 | 0.2 | GO:0032593 | insulin-responsive compartment(GO:0032593) |
| 0.0 | 0.5 | GO:0032982 | myosin filament(GO:0032982) |
| 0.0 | 0.4 | GO:0000808 | origin recognition complex(GO:0000808) nuclear origin of replication recognition complex(GO:0005664) |
| 0.0 | 0.1 | GO:0005584 | collagen type I trimer(GO:0005584) |
| 0.0 | 0.2 | GO:0097512 | cardiac myofibril(GO:0097512) |
| 0.0 | 0.1 | GO:0043614 | multi-eIF complex(GO:0043614) |
| 0.0 | 0.2 | GO:0035976 | AP1 complex(GO:0035976) |
| 0.0 | 0.1 | GO:0071159 | NF-kappaB complex(GO:0071159) |
| 0.0 | 0.1 | GO:0044753 | amphisome(GO:0044753) |
| 0.0 | 0.3 | GO:0032591 | dendritic spine membrane(GO:0032591) |
| 0.0 | 0.1 | GO:0005638 | lamin filament(GO:0005638) |
| 0.0 | 0.0 | GO:0020005 | symbiont-containing vacuole(GO:0020003) symbiont-containing vacuole membrane(GO:0020005) |
| 0.0 | 0.1 | GO:0036396 | MIS complex(GO:0036396) mRNA editing complex(GO:0045293) |
| 0.0 | 0.1 | GO:0032541 | cortical endoplasmic reticulum(GO:0032541) |
| 0.0 | 0.1 | GO:0097454 | Schwann cell microvillus(GO:0097454) |
| 0.0 | 0.1 | GO:1990246 | uniplex complex(GO:1990246) |
Gene overrepresentation in molecular_function category:
| Log-likelihood per target | Total log-likelihood | Term | Description |
|---|---|---|---|
| 0.0 | 0.1 | GO:0004597 | peptide-aspartate beta-dioxygenase activity(GO:0004597) |
| 0.0 | 0.2 | GO:0032795 | heterotrimeric G-protein binding(GO:0032795) |
| 0.0 | 0.0 | GO:0047498 | calcium-dependent phospholipase A2 activity(GO:0047498) |
| 0.0 | 0.5 | GO:0086008 | voltage-gated potassium channel activity involved in cardiac muscle cell action potential repolarization(GO:0086008) |
| 0.0 | 0.2 | GO:0098639 | collagen binding involved in cell-matrix adhesion(GO:0098639) |
| 0.0 | 0.3 | GO:0004332 | fructose-bisphosphate aldolase activity(GO:0004332) |
| 0.0 | 0.1 | GO:0050508 | glucuronosyl-N-acetylglucosaminyl-proteoglycan 4-alpha-N-acetylglucosaminyltransferase activity(GO:0050508) |
| 0.0 | 0.1 | GO:0008475 | procollagen-lysine 5-dioxygenase activity(GO:0008475) procollagen glucosyltransferase activity(GO:0033823) |
| 0.0 | 0.2 | GO:0030160 | GKAP/Homer scaffold activity(GO:0030160) |
| 0.0 | 0.1 | GO:0008808 | cardiolipin synthase activity(GO:0008808) phosphatidyltransferase activity(GO:0030572) CDP-diacylglycerol-phosphatidylglycerol phosphatidyltransferase activity(GO:0043337) |
| 0.0 | 0.2 | GO:0042835 | BRE binding(GO:0042835) |
| 0.0 | 0.1 | GO:0016647 | oxidoreductase activity, acting on the CH-NH group of donors, oxygen as acceptor(GO:0016647) |
| 0.0 | 0.2 | GO:0051525 | NFAT protein binding(GO:0051525) |
| 0.0 | 0.1 | GO:0016316 | phosphatidylinositol-3,4-bisphosphate 4-phosphatase activity(GO:0016316) inositol-1,3,4-trisphosphate 4-phosphatase activity(GO:0017161) inositol-3,4-bisphosphate 4-phosphatase activity(GO:0052828) |
| 0.0 | 0.1 | GO:0015056 | corticotrophin-releasing factor receptor activity(GO:0015056) |
| 0.0 | 0.1 | GO:1904713 | beta-catenin destruction complex binding(GO:1904713) |
| 0.0 | 0.1 | GO:0004468 | lysine N-acetyltransferase activity, acting on acetyl phosphate as donor(GO:0004468) |
| 0.0 | 0.1 | GO:0035529 | phosphodiesterase I activity(GO:0004528) NADH pyrophosphatase activity(GO:0035529) |
| 0.0 | 0.2 | GO:0004111 | creatine kinase activity(GO:0004111) |
| 0.0 | 0.1 | GO:0004095 | carnitine O-palmitoyltransferase activity(GO:0004095) |
| 0.0 | 0.1 | GO:0030550 | acetylcholine receptor inhibitor activity(GO:0030550) |
| 0.0 | 0.2 | GO:0032036 | myosin heavy chain binding(GO:0032036) |
| 0.0 | 0.1 | GO:0010521 | telomerase inhibitor activity(GO:0010521) |
| 0.0 | 0.4 | GO:0003688 | DNA replication origin binding(GO:0003688) |
| 0.0 | 0.0 | GO:0061663 | NEDD8 ligase activity(GO:0061663) |
| 0.0 | 0.1 | GO:0004322 | ferroxidase activity(GO:0004322) oxidoreductase activity, oxidizing metal ions, oxygen as acceptor(GO:0016724) |
| 0.0 | 0.1 | GO:0003956 | NAD(P)+-protein-arginine ADP-ribosyltransferase activity(GO:0003956) |
| 0.0 | 0.2 | GO:0031697 | beta-1 adrenergic receptor binding(GO:0031697) |
| 0.0 | 0.0 | GO:0005146 | leukemia inhibitory factor receptor binding(GO:0005146) |
| 0.0 | 0.0 | GO:0031433 | telethonin binding(GO:0031433) |
| 0.0 | 0.1 | GO:0015501 | glutamate:sodium symporter activity(GO:0015501) |
| 0.0 | 0.1 | GO:0004911 | interleukin-2 receptor activity(GO:0004911) interleukin-2 binding(GO:0019976) |
| 0.0 | 0.0 | GO:0035379 | carbon dioxide transmembrane transporter activity(GO:0035379) |
| 0.0 | 0.0 | GO:0080130 | L-phenylalanine aminotransferase activity(GO:0070546) L-phenylalanine:2-oxoglutarate aminotransferase activity(GO:0080130) |
| 0.0 | 0.3 | GO:0005247 | voltage-gated chloride channel activity(GO:0005247) |
| 0.0 | 0.1 | GO:0055104 | ligase inhibitor activity(GO:0055104) ubiquitin ligase inhibitor activity(GO:1990948) |
| 0.0 | 0.1 | GO:0008321 | Ral guanyl-nucleotide exchange factor activity(GO:0008321) |
| 0.0 | 0.4 | GO:0008327 | methyl-CpG binding(GO:0008327) |
| 0.0 | 0.0 | GO:0003845 | 11-beta-hydroxysteroid dehydrogenase [NAD(P)] activity(GO:0003845) |
| 0.0 | 0.5 | GO:0004198 | calcium-dependent cysteine-type endopeptidase activity(GO:0004198) |
| 0.0 | 0.8 | GO:0001105 | RNA polymerase II transcription coactivator activity(GO:0001105) |
| 0.0 | 0.2 | GO:0005225 | volume-sensitive anion channel activity(GO:0005225) |
| 0.0 | 0.2 | GO:0097493 | structural molecule activity conferring elasticity(GO:0097493) |
| 0.0 | 0.1 | GO:0005332 | gamma-aminobutyric acid:sodium symporter activity(GO:0005332) |
| 0.0 | 0.1 | GO:0001025 | RNA polymerase III transcription factor binding(GO:0001025) |
| 0.0 | 0.1 | GO:0004614 | phosphoglucomutase activity(GO:0004614) |
Gene overrepresentation in C2:CP category:
| Log-likelihood per target | Total log-likelihood | Term | Description |
|---|---|---|---|
| 0.0 | 0.7 | PID INSULIN GLUCOSE PATHWAY | Insulin-mediated glucose transport |
| 0.0 | 0.2 | PID THROMBIN PAR4 PATHWAY | PAR4-mediated thrombin signaling events |
Gene overrepresentation in C2:CP:REACTOME category:
| Log-likelihood per target | Total log-likelihood | Term | Description |
|---|---|---|---|
| 0.0 | 0.4 | REACTOME CDC6 ASSOCIATION WITH THE ORC ORIGIN COMPLEX | Genes involved in CDC6 association with the ORC:origin complex |
| 0.0 | 0.6 | REACTOME INHIBITION OF VOLTAGE GATED CA2 CHANNELS VIA GBETA GAMMA SUBUNITS | Genes involved in Inhibition of voltage gated Ca2+ channels via Gbeta/gamma subunits |
| 0.0 | 0.7 | REACTOME ERK MAPK TARGETS | Genes involved in ERK/MAPK targets |
| 0.0 | 0.1 | REACTOME DEFENSINS | Genes involved in Defensins |