|
chrX_-_71442488
|
3.388
|
NM_001144885
NM_001144887
|
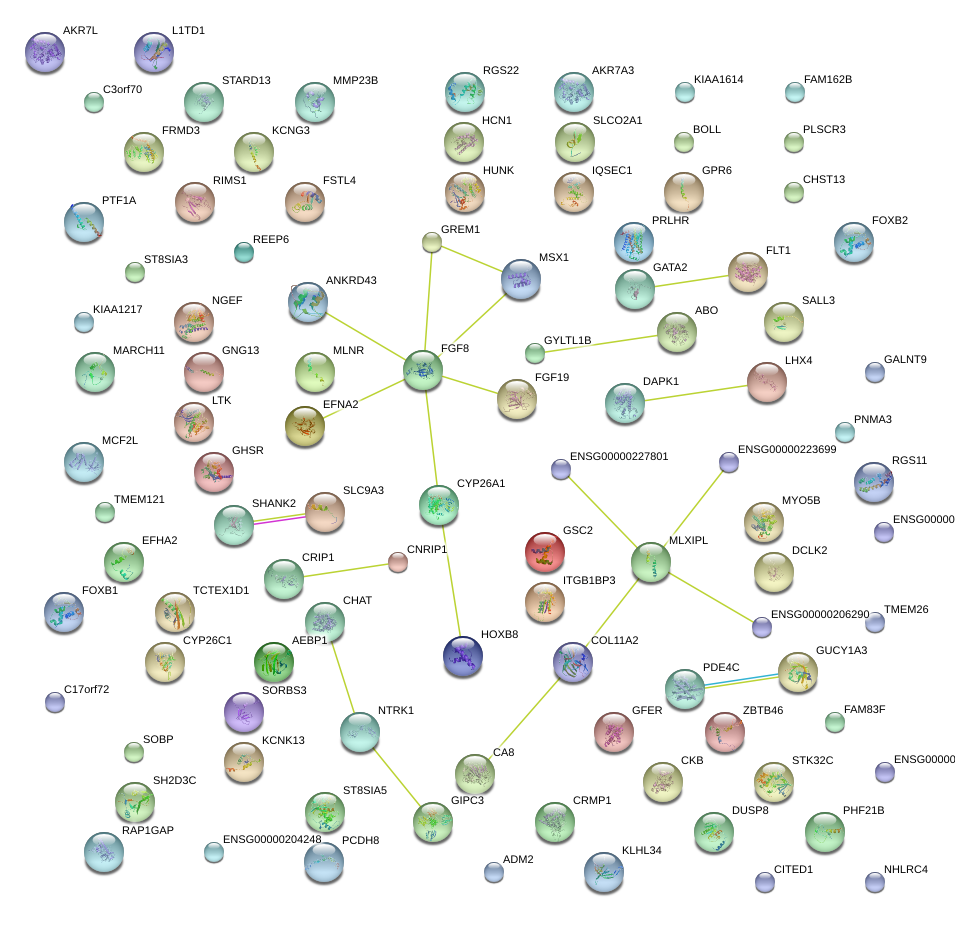
CITED1
|
Cbp/p300-interacting transactivator, with Glu/Asp-rich carboxy-terminal domain, 1
|
|
chr1_+_62433061
|
3.122
|
NM_001164835
NM_019079
|
L1TD1
|
LINE-1 type transposase domain containing 1
|
|
chr1_-_29322993
|
2.762
|
NM_001003682
|
TMEM200B
|
transmembrane protein 200B
|
|
chr8_-_61356436
|
2.406
|
NM_004056
|
CA8
|
carbonic anhydrase VIII
|
|
chr11_-_69228286
|
2.401
|
NM_005117
|
FGF19
|
fibroblast growth factor 19
|
|
chr9_-_85342868
|
2.306
|
NM_174938
|
FRMD3
|
FERM domain containing 3
|
|
chr7_+_6622051
|
2.223
|
NM_017560
|
ZNF853
|
zinc finger protein 853
|
|
chr1_+_1062137
|
2.174
|
|
LOC254099
|
hypothetical protein LOC254099
|
|
chr10_-_120345148
|
2.045
|
NM_004248
|
PRLHR
|
prolactin releasing hormone receptor
|
|
chr22_-_43783449
|
2.021
|
|
PHF21B
|
PHD finger protein 21B
|
|
chr3_-_13089547
|
1.969
|
NM_001134382
|
IQSEC1
|
IQ motif and Sec7 domain 1
|
|
chr3_-_173648896
|
1.966
|
NM_004122
NM_198407
|
GHSR
|
growth hormone secretagogue receptor
|
|
chr16_+_550394
|
1.962
|
NM_145270
|
C16orf11
|
chromosome 16 open reading frame 11
|
|
chr18_-_45975163
|
1.892
|
NM_001080467
|
MYO5B
|
myosin VB
|
|
chr17_-_7238546
|
1.854
|
NM_020360
|
PLSCR3
|
phospholipid scramblase 3
|
|
chr7_-_28964186
|
1.834
|
|
|
|
|
chr2_-_198358253
|
1.812
|
NM_033030
|
BOLL
|
bol, boule-like (Drosophila)
|
|
chr1_+_1557419
|
1.802
|
NM_006983
|
MMP23B
|
matrix metallopeptidase 23B
|
|
chr18_+_74841262
|
1.794
|
NM_171999
|
SALL3
|
sal-like 3 (Drosophila)
|
|
chr19_+_1236766
|
1.785
|
NM_001405
|
EFNA2
|
ephrin-A2
|
|
chr2_-_233501069
|
1.768
|
NM_001114090
|
NGEF
|
neuronal guanine nucleotide exchange factor
|
|
chr16_-_265868
|
1.731
|
NM_003834
NM_183337
|
RGS11
|
regulator of G-protein signaling 11
|
|
chr19_-_18198234
|
1.708
|
NM_001098818
|
PDE4C
|
phosphodiesterase 4C, cAMP-specific
|
|
chr13_+_112670757
|
1.687
|
NM_001112732
|
MCF2L
|
MCF.2 cell line derived transforming sequence-like
|
|
chr14_+_105063975
|
1.667
|
NM_025268
|
TMEM121
|
transmembrane protein 121
|
|
chr10_+_23521464
|
1.648
|
NM_178161
|
PTF1A
|
pancreas specific transcription factor, 1a
|
|
chr1_+_179148935
|
1.624
|
NM_020950
|
KIAA1614
|
KIAA1614
|
|
chr14_+_105024301
|
1.621
|
NM_001311
|
CRIP1
|
cysteine-rich protein 1 (intestinal)
|
|
chr4_+_156808261
|
1.607
|
NM_001130684
|
GUCY1A3
|
guanylate cyclase 1, soluble, alpha 3
|
|
chr7_-_72676750
|
1.585
|
NM_032951
NM_032952
NM_032953
NM_032954
|
MLXIPL
|
MLX interacting protein-like
|
|
chr22_+_38720881
|
1.583
|
NM_138435
|
FAM83F
|
family with sequence similarity 83, member F
|
|
chr6_+_110406890
|
1.578
|
NM_005284
|
GPR6
|
G protein-coupled receptor 6
|
|
chr4_+_156807311
|
1.569
|
NM_000856
NM_001130682
NM_001130686
NM_001130687
NM_001130683
NM_001130685
|
GUCY1A3
|
guanylate cyclase 1, soluble, alpha 3
|
|
chr4_-_41579325
|
1.569
|
|
|
|
|
chr15_+_30797466
|
1.564
|
NM_001191322
NM_001191323
NM_013372
|
GREM1
|
gremlin 1
|
|
chr4_+_151218862
|
1.540
|
NM_001040260
NM_001040261
|
DCLK2
|
doublecortin-like kinase 2
|
|
chr5_-_132976094
|
1.526
|
|
FSTL4
|
follistatin-like 4
|
|
chr10_+_94811010
|
1.521
|
NM_183374
|
CYP26C1
|
cytochrome P450, family 26, subfamily C, polypeptide 1
|
|
chr3_-_129690056
|
1.521
|
NM_001145661
|
GATA2
|
GATA binding protein 2
|
|
chr13_-_27967215
|
1.479
|
NM_001159920
NM_001160030
NM_001160031
NM_002019
|
FLT1
|
fms-related tyrosine kinase 1 (vascular endothelial growth factor/vascular permeability factor receptor)
|
|
chr2_-_42574587
|
1.476
|
NM_133329
NM_172344
|
KCNG3
|
potassium voltage-gated channel, subfamily G, member 3
|
|
chr10_+_50492088
|
1.472
|
NM_001142929
NM_001142933
NM_001142934
NM_020549
|
CHAT
|
choline O-acetyltransferase
|
|
chr10_+_24023680
|
1.471
|
NM_001098500
|
KIAA1217
|
KIAA1217
|
|
chr11_-_1549719
|
1.446
|
NM_004420
|
DUSP8
|
dual specificity phosphatase 8
|
|
chr13_-_52320774
|
1.402
|
NM_002590
NM_032949
|
PCDH8
|
protocadherin 8
|
|
chr1_+_178466064
|
1.401
|
NM_033343
|
LHX4
|
LIM homeobox 4
|
|
chr5_+_132176921
|
1.394
|
NM_175873
|
ANKRD43
|
ankyrin repeat domain 43
|
|
chr13_+_112671497
|
1.365
|
|
MCF2L
|
MCF.2 cell line derived transforming sequence-like
|
|
chr1_+_155097230
|
1.363
|
NM_001012331
NM_002529
|
NTRK1
|
neurotrophic tyrosine kinase, receptor, type 1
|
|
chr5_+_167889123
|
1.358
|
|
|
|
|
chr12_-_131256525
|
1.352
|
NM_021808
|
GALNT9
|
UDP-N-acetyl-alpha-D-galactosamine:polypeptide N-acetylgalactosaminyltransferase 9 (GalNAc-T9)
|
|
chr9_+_89302574
|
1.348
|
NM_004938
|
DAPK1
|
death-associated protein kinase 1
|
|
chr4_+_4912272
|
1.336
|
NM_002448
|
MSX1
|
msh homeobox 1
|
|
chr11_+_45900731
|
1.331
|
|
GYLTL1B
|
glycosyltransferase-like 1B
|
|
chr1_-_21850874
|
1.309
|
NM_001145658
|
RAP1GAP
|
RAP1 GTPase activating protein
|
|
chr6_+_72949092
|
1.292
|
|
RIMS1
|
regulating synaptic membrane exocytosis 1
|
|
chr10_+_94823221
|
1.279
|
NM_057157
|
CYP26A1
|
cytochrome P450, family 26, subfamily A, polypeptide 1
|
|
chr15_-_39593285
|
1.263
|
NM_001135685
NM_002344
NM_206961
|
LTK
|
leukocyte receptor tyrosine kinase
|
|
chr3_+_127743868
|
1.221
|
|
CHST13
|
carbohydrate (chondroitin 4) sulfotransferase 13
|
|
chr19_+_3536541
|
1.215
|
NM_133261
|
GIPC3
|
GIPC PDZ domain containing family, member 3
|
|
chr4_-_5942818
|
1.210
|
|
CRMP1
|
collapsin response mediator protein 1
|
|
chr22_+_49266836
|
1.198
|
NM_024866
|
ADM2
|
adrenomedullin 2
|
|
chr21_+_32167175
|
1.193
|
NM_014586
|
HUNK
|
hormonally up-regulated Neu-associated kinase
|
|
chr5_-_577444
|
1.185
|
NM_004174
|
SLC9A3
|
solute carrier family 9 (sodium/hydrogen exchanger), member 3
|
|
chr5_-_45731588
|
1.170
|
|
HCN1
|
hyperpolarization activated cyclic nucleotide-gated potassium channel 1
|
|
chr19_+_3884100
|
1.140
|
NM_170678
|
ITGB1BP3
|
integrin beta 1 binding protein 3
|
|
chrX_+_151975518
|
1.139
|
|
PNMA3
|
paraneoplastic antigen MA3
|
|
chr14_+_89597860
|
1.129
|
NM_022054
|
KCNK13
|
potassium channel, subfamily K, member 13
|
|
chr17_-_44047299
|
1.117
|
NM_024016
|
HOXB8
|
homeobox B8
|
|
chr2_+_149349643
|
1.115
|
|
|
|
|
chr9_+_78824390
|
1.109
|
NM_001013735
|
FOXB2
|
forkhead box B2
|
|
chr18_+_53170718
|
1.106
|
NM_015879
|
ST8SIA3
|
ST8 alpha-N-acetyl-neuraminide alpha-2,8-sialyltransferase 3
|
|
chr1_+_66990692
|
1.106
|
NM_152665
|
TCTEX1D1
|
Tctex1 domain containing 1
|
|
chr9_-_129557373
|
1.099
|
NM_001142534
NM_001142533
|
SH2D3C
|
SH2 domain containing 3C
|
|
chr8_+_22465368
|
1.096
|
|
SORBS3
|
sorbin and SH3 domain containing 3
|
|
chrX_-_21586337
|
1.075
|
NM_153270
|
KLHL34
|
kelch-like 34 (Drosophila)
|
|
chr7_+_44110470
|
1.062
|
NM_001129
|
AEBP1
|
AE binding protein 1
|
|
chr3_-_135231417
|
1.043
|
|
SLCO2A1
|
solute carrier organic anion transporter family, member 2A1
|
|
chr3_-_186353321
|
1.041
|
|
C3orf70
|
chromosome 3 open reading frame 70
|
|
chr11_-_70641267
|
1.037
|
|
SHANK2
|
SH3 and multiple ankyrin repeat domains 2
|
|
chr14_-_103058568
|
1.031
|
|
CKB
|
creatine kinase, brain
|
|
chr1_-_19473021
|
1.025
|
NM_001145289
NM_201252
|
AKR7L
|
aldo-keto reductase family 7-like
|
|
chr8_-_101187519
|
1.024
|
NM_015668
|
RGS22
|
regulator of G-protein signaling 22
|
|
chr22_-_17517795
|
1.018
|
NM_005315
|
GSC2
|
goosecoid homeobox 2
|
|
chr20_-_61933012
|
1.006
|
|
ZBTB46
|
zinc finger and BTB domain containing 46
|
|
chr6_-_33268177
|
0.983
|
NM_001163771
NM_080679
NM_080680
NM_080681
|
COL11A2
|
collagen, type XI, alpha 2
|
|
chr6_-_117193505
|
0.983
|
NM_001085480
|
FAM162B
|
family with sequence similarity 162, member B
|
|
chr6_+_107917965
|
0.980
|
NM_018013
|
SOBP
|
sine oculis binding protein homolog (Drosophila)
|
|
chr13_-_32822759
|
0.978
|
|
STARD13
|
StAR-related lipid transfer (START) domain containing 13
|
|
chr10_-_62882930
|
0.977
|
|
TMEM26
|
transmembrane protein 26
|
|
chr17_+_59429442
|
0.976
|
NM_001164257
NM_001191029
NM_001191030
NM_001191031
|
C17orf72
|
chromosome 17 open reading frame 72
|
|
chr10_-_133971136
|
0.973
|
NM_173575
|
STK32C
|
serine/threonine kinase 32C
|
|
chr22_-_43784093
|
0.973
|
NM_138415
|
PHF21B
|
PHD finger protein 21B
|
|
chr5_-_16232896
|
0.972
|
NM_001102562
|
MARCH11
|
membrane-associated ring finger (C3HC4) 11
|
|
chr16_+_1974017
|
0.972
|
NM_005262
|
GFER
|
growth factor, augmenter of liver regeneration
|
|
chr16_-_790699
|
0.970
|
NM_016541
|
GNG13
|
guanine nucleotide binding protein (G protein), gamma 13
|
|
chr8_+_16929116
|
0.958
|
NM_181723
|
EFHA2
|
EF-hand domain family, member A2
|
|
chr9_-_135140425
|
0.955
|
|
ABO
|
ABO blood group (transferase A, alpha 1-3-N-acetylgalactosaminyltransferase; transferase B, alpha 1-3-galactosyltransferase)
|
|
chr13_+_48692472
|
0.952
|
NM_001507
|
MLNR
|
motilin receptor
|
|
chr14_+_105024576
|
0.951
|
|
CRIP1
|
cysteine-rich protein 1 (intestinal)
|
|
chr18_-_42590989
|
0.946
|
NM_013305
|
ST8SIA5
|
ST8 alpha-N-acetyl-neuraminide alpha-2,8-sialyltransferase 5
|
|
chr10_-_103525646
|
0.945
|
NM_006119
NM_033163
NM_033164
NM_033165
|
FGF8
|
fibroblast growth factor 8 (androgen-induced)
|
|
chr3_-_186353421
|
0.942
|
NM_001025266
|
C3orf70
|
chromosome 3 open reading frame 70
|
|
chr19_+_1442000
|
0.936
|
NM_138393
|
REEP6
|
receptor accessory protein 6
|
|
chr22_-_36245155
|
0.931
|
NM_014550
|
CARD10
|
caspase recruitment domain family, member 10
|
|
chr9_-_135140450
|
0.925
|
NM_020469
|
ABO
|
ABO blood group (transferase A, alpha 1-3-N-acetylgalactosaminyltransferase; transferase B, alpha 1-3-galactosyltransferase)
|
|
chr11_-_63014986
|
0.923
|
NM_001146728
NM_001146729
NM_054108
|
HRASLS5
|
HRAS-like suppressor family, member 5
|
|
chr12_+_3470685
|
0.921
|
NM_019854
|
PRMT8
|
protein arginine methyltransferase 8
|
|
chr17_+_19377732
|
0.915
|
NM_018242
|
SLC47A1
|
solute carrier family 47, member 1
|
|
chr10_+_26545241
|
0.896
|
NM_000818
NM_001134366
|
GAD2
|
glutamate decarboxylase 2 (pancreatic islets and brain, 65kDa)
|
|
chr19_-_54267690
|
0.892
|
|
KCNA7
|
potassium voltage-gated channel, shaker-related subfamily, member 7
|
|
chr6_+_30082331
|
0.891
|
|
HLA-J
|
major histocompatibility complex, class I, J (pseudogene)
|
|
chr5_+_1061900
|
0.888
|
NM_033120
|
NKD2
|
naked cuticle homolog 2 (Drosophila)
|
|
chr7_+_153215316
|
0.883
|
NM_001039350
|
DPP6
|
dipeptidyl-peptidase 6
|
|
chr6_-_11152340
|
0.880
|
NM_017770
|
ELOVL2
|
elongation of very long chain fatty acids (FEN1/Elo2, SUR4/Elo3, yeast)-like 2
|
|
chr11_-_118716244
|
0.871
|
|
MFRP
|
membrane frizzled-related protein
|
|
chr10_-_125641484
|
0.870
|
NM_198148
|
CPXM2
|
carboxypeptidase X (M14 family), member 2
|
|
chr17_-_34635446
|
0.868
|
NM_198993
|
STAC2
|
SH3 and cysteine rich domain 2
|
|
chr19_-_19245022
|
0.866
|
NM_001001524
|
TM6SF2
|
transmembrane 6 superfamily member 2
|
|
chr12_-_61614930
|
0.864
|
NM_020700
|
PPM1H
|
protein phosphatase, Mg2+/Mn2+ dependent, 1H
|
|
chr15_-_49174107
|
0.862
|
|
TNFAIP8L3
|
tumor necrosis factor, alpha-induced protein 8-like 3
|
|
chr3_-_135231518
|
0.855
|
NM_005630
|
SLCO2A1
|
solute carrier organic anion transporter family, member 2A1
|
|
chr14_+_51804180
|
0.854
|
NM_000953
|
PTGDR
|
prostaglandin D2 receptor (DP)
|
|
chr11_+_56984702
|
0.852
|
NM_178570
|
RTN4RL2
|
reticulon 4 receptor-like 2
|
|
chr3_-_10724715
|
0.850
|
|
ATP2B2
|
ATPase, Ca++ transporting, plasma membrane 2
|
|
chr8_+_1937711
|
0.847
|
|
KBTBD11
|
kelch repeat and BTB (POZ) domain containing 11
|
|
chr16_-_1971360
|
0.838
|
NM_144603
|
NOXO1
|
NADPH oxidase organizer 1
|
|
chr9_+_89302239
|
0.836
|
|
DAPK1
|
death-associated protein kinase 1
|
|
chr8_-_101187346
|
0.833
|
|
RGS22
|
regulator of G-protein signaling 22
|
|
chr3_+_156280129
|
0.828
|
NM_000902
|
MME
|
membrane metallo-endopeptidase
|
|
chr9_-_16860719
|
0.828
|
NM_017637
|
BNC2
|
basonuclin 2
|
|
chr1_+_66990736
|
0.825
|
|
TCTEX1D1
|
Tctex1 domain containing 1
|
|
chr17_-_7106497
|
0.822
|
|
CLDN7
|
claudin 7
|
|
chr19_-_47190061
|
0.810
|
|
ATP1A3
|
ATPase, Na+/K+ transporting, alpha 3 polypeptide
|
|
chrX_+_113724806
|
0.806
|
NM_000868
|
HTR2C
|
5-hydroxytryptamine (serotonin) receptor 2C
|
|
chr15_-_77024408
|
0.804
|
NM_004390
|
CTSH
|
cathepsin H
|
|
chr19_-_14447163
|
0.804
|
NM_000955
|
PTGER1
|
prostaglandin E receptor 1 (subtype EP1), 42kDa
|
|
chr16_+_88512769
|
0.803
|
|
MC1R
|
melanocortin 1 receptor (alpha melanocyte stimulating hormone receptor)
|
|
chr16_+_971808
|
0.799
|
NM_014587
|
SOX8
|
SRY (sex determining region Y)-box 8
|
|
chr1_-_239587007
|
0.798
|
|
RGS7
|
regulator of G-protein signaling 7
|
|
chr3_+_50217692
|
0.795
|
NM_006841
|
SLC38A3
|
solute carrier family 38, member 3
|
|
chr19_-_47190160
|
0.795
|
NM_152296
|
ATP1A3
|
ATPase, Na+/K+ transporting, alpha 3 polypeptide
|
|
chr22_+_22445035
|
0.794
|
NM_005940
|
MMP11
|
matrix metallopeptidase 11 (stromelysin 3)
|
|
chr22_-_19122047
|
0.789
|
|
SCARF2
|
scavenger receptor class F, member 2
|
|
chr4_+_184257337
|
0.786
|
NM_024949
|
WWC2
|
WW and C2 domain containing 2
|
|
chr1_-_13712744
|
0.780
|
NM_001010847
|
LRRC38
|
leucine rich repeat containing 38
|
|
chr13_+_50694364
|
0.774
|
NM_145019
|
FAM124A
|
family with sequence similarity 124A
|
|
chr11_-_75599433
|
0.773
|
|
WNT11
|
wingless-type MMTV integration site family, member 11
|
|
chr16_-_87535106
|
0.770
|
NM_175931
|
CBFA2T3
|
core-binding factor, runt domain, alpha subunit 2; translocated to, 3
|
|
chr4_+_2013517
|
0.770
|
NM_001168243
NM_001141936
|
C4orf48
|
chromosome 4 open reading frame 48
|
|
chr5_-_59225377
|
0.768
|
NM_001104631
|
PDE4D
|
phosphodiesterase 4D, cAMP-specific
|
|
chrX_+_151975421
|
0.764
|
NM_013364
|
PNMA3
|
paraneoplastic antigen MA3
|
|
chr19_-_44503328
|
0.762
|
|
|
|
|
chr14_+_99273751
|
0.761
|
|
EML1
|
echinoderm microtubule associated protein like 1
|
|
chr17_-_47590975
|
0.754
|
|
CA10
|
carbonic anhydrase X
|
|
chr1_-_19487790
|
0.751
|
NM_012067
|
AKR7A3
|
aldo-keto reductase family 7, member A3 (aflatoxin aldehyde reductase)
|
|
chr10_-_62883213
|
0.749
|
NM_178505
|
TMEM26
|
transmembrane protein 26
|
|
chr10_+_118990573
|
0.745
|
NM_003054
|
SLC18A2
|
solute carrier family 18 (vesicular monoamine), member 2
|
|
chr22_-_19122107
|
0.742
|
NM_153334
NM_182895
|
SCARF2
|
scavenger receptor class F, member 2
|
|
chr18_+_61569136
|
0.741
|
NM_004361
|
CDH7
|
cadherin 7, type 2
|
|
chr12_-_21818881
|
0.736
|
NM_004982
|
KCNJ8
|
potassium inwardly-rectifying channel, subfamily J, member 8
|
|
chr13_+_112681626
|
0.732
|
NM_024979
|
MCF2L
|
MCF.2 cell line derived transforming sequence-like
|
|
chr19_+_44697592
|
0.719
|
NM_182704
|
SELV
|
selenoprotein V
|
|
chr22_+_43442987
|
0.718
|
NM_001017528
NM_001017529
|
PRR5
|
proline rich 5 (renal)
|
|
chr6_+_168584722
|
0.716
|
|
SMOC2
|
SPARC related modular calcium binding 2
|
|
chr15_-_56145140
|
0.710
|
NM_003888
NM_170696
|
ALDH1A2
|
aldehyde dehydrogenase 1 family, member A2
|
|
chr19_+_10392128
|
0.701
|
NM_001111307
|
PDE4A
|
phosphodiesterase 4A, cAMP-specific
|
|
chr2_-_200044233
|
0.701
|
NM_015265
|
SATB2
|
SATB homeobox 2
|
|
chr2_+_238200922
|
0.701
|
NM_001137550
|
LRRFIP1
|
leucine rich repeat (in FLII) interacting protein 1
|
|
chr16_+_1143241
|
0.693
|
NM_001005407
NM_021098
|
CACNA1H
|
calcium channel, voltage-dependent, T type, alpha 1H subunit
|
|
chr1_-_23730298
|
0.692
|
NM_004091
|
E2F2
|
E2F transcription factor 2
|
|
chr9_-_16860664
|
0.692
|
|
BNC2
|
basonuclin 2
|
|
chr17_+_71095733
|
0.678
|
|
MYO15B
|
myosin XVB pseudogene
|
|
chr15_-_77024375
|
0.677
|
|
CTSH
|
cathepsin H
|
|
chr11_+_110675175
|
0.669
|
NM_001136105
|
C11orf93
|
chromosome 11 open reading frame 93
|
|
chr9_-_139047112
|
0.665
|
NM_004479
|
FUT7
|
fucosyltransferase 7 (alpha (1,3) fucosyltransferase)
|
|
chr17_-_70401299
|
0.665
|
NM_178128
|
FADS6
|
fatty acid desaturase domain family, member 6
|
|
chr7_-_4965270
|
0.664
|
NM_001100600
NM_198403
|
MMD2
|
monocyte to macrophage differentiation-associated 2
|
|
chr1_+_108765634
|
0.662
|
|
LOC400768
|
hypothetical LOC400768
|
|
chr7_+_100047660
|
0.660
|
NM_001040097
|
MOSPD3
|
motile sperm domain containing 3
|
|
chr20_-_930806
|
0.659
|
NM_001029871
NM_001040007
|
RSPO4
|
R-spondin family, member 4
|
|
chr17_+_77910411
|
0.658
|
NM_207459
|
TEX19
|
testis expressed 19
|
|
chr14_+_99507848
|
0.658
|
|
EVL
|
Enah/Vasp-like
|
|
chr19_+_61711008
|
0.657
|
NM_020813
|
ZNF471
|
zinc finger protein 471
|
|
chr5_-_1165106
|
0.652
|
NM_006598
|
SLC12A7
|
solute carrier family 12 (potassium/chloride transporters), member 7
|
|
chr17_+_70431964
|
0.645
|
NM_178160
|
OTOP2
|
otopetrin 2
|
|
chr14_+_105012106
|
0.643
|
NM_001312
|
CRIP2
|
cysteine-rich protein 2
|
|
chr19_-_14447122
|
0.643
|
|
PTGER1
|
prostaglandin E receptor 1 (subtype EP1), 42kDa
|
|
chr9_-_83493415
|
0.640
|
NM_005077
|
TLE1
|
transducin-like enhancer of split 1 (E(sp1) homolog, Drosophila)
|
|
chr10_-_135232865
|
0.637
|
NM_130784
|
SYCE1
|
synaptonemal complex central element protein 1
|
|
chr17_+_41327808
|
0.637
|
|
MAPT
|
microtubule-associated protein tau
|
|
chr16_+_1974182
|
0.635
|
|
GFER
|
growth factor, augmenter of liver regeneration
|
|
chr17_+_26742903
|
0.633
|
|
RAB11FIP4
|
RAB11 family interacting protein 4 (class II)
|
|
chr19_-_50518072
|
0.631
|
NM_001824
|
CKM
|
creatine kinase, muscle
|
|
chr8_+_144428083
|
0.631
|
|
GLI4
|
GLI family zinc finger 4
|
|
chr13_-_25523164
|
0.630
|
NM_001007538
|
SHISA2
|
shisa homolog 2 (Xenopus laevis)
|
|
chr3_-_124650081
|
0.627
|
NM_183357
|
ADCY5
|
adenylate cyclase 5
|
|
chr19_-_1463997
|
0.627
|
|
ADAMTSL5
|
ADAMTS-like 5
|
|
chr12_-_128954164
|
0.626
|
NM_133448
|
TMEM132D
|
transmembrane protein 132D
|
|
chr10_+_122206455
|
0.626
|
NM_001030059
|
PPAPDC1A
|
phosphatidic acid phosphatase type 2 domain containing 1A
|